Abstract
Objective
The goal of this study was to establish measures of sun damage in histopathologically normal skin.
Materials
Biopsies were taken from the upper inner arm, representing skin with presumably minimum sun exposure, from skin of the forearm with no visible sun damage, from skin of the forearm with visible sun damage and from normal-appearing skin from the forearm of individuals who had sun exposure that had resulted in actinic keratosis lesions. In addition, a data set of nuclei from actinic keratoses was recorded.
Results
In histopathologically normal skin, monotonically increasing damage is observed in individuals with increased exposure to solar radiation.
Conclusions
Karyometry can detect and statistically secure changes in skin due to solar exposure at a stage where the skin is histopathologically determined to be "normal."
Keywords: Histopathologically normal skin, karyometry, actinic keratosis, sun damage
Introduction
A chemopreventive intervention can be expected to be most effective at the earliest onset of any deviation from "normal." However, in such situations it is difficult to assess the efficacy of such an intervention since changes in the histopathologic appearance must be expected to be very subtle, or even undetectable, by visual inspection. Karyometry lends itself ideally for a quantitative assessment of efficacy of a chemopreventive intervention. It provides a numerically defined measure of changes and allows establishing statistical significance of an agent's effects.
Earlier studies have established a progression curve for skin lesions from normal skin to actinic keratosis (AK) lesions and squamous cell cancer (SCC).1,2,3 Nuclear morphometry has been related to molecular biomarkers and to neoplastic changes concomitant to the progression from sun damage to AK and SCC4. A recent study has derived estimates for the smallest statistically significant change in the nuclear chromatin pattern that can be detected by karyometry.5
To relate visual assessment of skin biopsies to karyometric results, it is of interest to survey the range of changes that can be recorded by karyometry in histopathologically normal skin. In this study, biopsies are analyzed from minimally sun exposed skin, from sun exposed skin without visually apparent damage, from sun exposed skin with visually apparent damage, from normal appearing skin of individuals who have developed solar keratoses, and finally, from AK lesions.
Materials and Methods
The materials processed in this study were collected in the context of a skin cancer program project at the Arizona Cancer Center.6 Three groups of study participants provided skin biopsy samples for this study: 1) individuals with no visually apparent sun damage (n=36); 2) individuals with visually apparent sun damage (n=32); and 3) individuals with AKs (n=24).
Biopsies from the upper inner arm were taken from 152 individuals, with 23,437 nuclei recorded. In addition, biopsies from 36 cases with no visible sun damage were obtained, with 5,435 nuclei recorded. Of 32 biopsies obtained from cases with visually apparent sun damage, 5,407 nuclei were recorded. The 24 AK cases resulted in 2,974 nuclei recorded from normal-appearing skin. Also recorded were 2,874 nuclei from biopsies taken of AK lesions from these same 24 individuals
All of the biopsies included in this study were assessed by a dermatopathologist as histopathologically normal. Processing, staining and digital recording of these materials, as well as the chromatin feature definitions, have been described in detail earlier.2,3
To establish a basis for the assessment of progressive change as a function of sun exposure, a discriminant function (DF I,1) with nuclei from minimally sun exposed skin and nuclei from skin from AK lesions as anchor points was established. Feature selection was performed based on a Kruskal Wallis test as described elsewhere.7
To survey which features undergo the most distinct changes between nuclei with minimal and with evident sun damage, a threshold was set after visual inspection on a discriminant function (DF I,2) score distribution. For the two sets of nuclei below and above the threshold, the ambiguity function of Genchi and Mori was evaluated.8,9 The function has a value of 1.00 for no distinction, and of zero for perfect discrimination.
Results
Two training sets were formed from a random selection of cases such that 50% of the nuclei were chosen, resulting in training sets of 11,751 nuclei from normal upper arm and 1,443 nuclei from AK cases, respectively. The remaining 50% of nuclei comprised the test set. Feature selection resulted in the choice of six features. They are listed in Table I with their values from the full data set, and the standardized coefficients in the discriminant function DF I,1. The function reduced Wilks' Lambda to 0.753. The classification matrix for nuclei is given in Table II, for the training sets, the test sets, and the combined sets. The overall accuracy reached 85.8%.
Table I.
Features for the discriminant function minimally-exposed skin versus actinic keratosis (AK)
| Feature | Upper inner arm |
AK lesion | Standardized coefficient |
|---|---|---|---|
| # 319 light stained pixels | 193.4 | 327.0 | 0.623 |
| # 002 relative nuclear area | 23.9 | 34.8 | 0.443 |
| # 307 run percentage | 427.2 | 557.1 | − 0.327 |
| # 001 total optical density | 0.726 | 0.985 | 0.146 |
| # 321 dark stained pixels | 300.0 | 453.6 | 0.120 |
| # 314 pixel optical density clumpiness | 0.647 | 0.699 | 0.092 |
Table II.
Nuclear classification results from DF I,1
| Upper inner arm | Actinic keratosis | |
|---|---|---|
| Training sets | ||
| Upper inner arm | 91.9% | 8.1% |
| Actinic keratosis | 38.2% | 61.8% |
| Test sets | ||
| Upper inner arm | 92.3% | 7.7% |
| Actinic keratosis | 51.7% | 48.3% |
| Combined sets | ||
| Upper inner arm | 88.6% | 11.4% |
| Actinic keratosis | 37.3% | 62.7% |
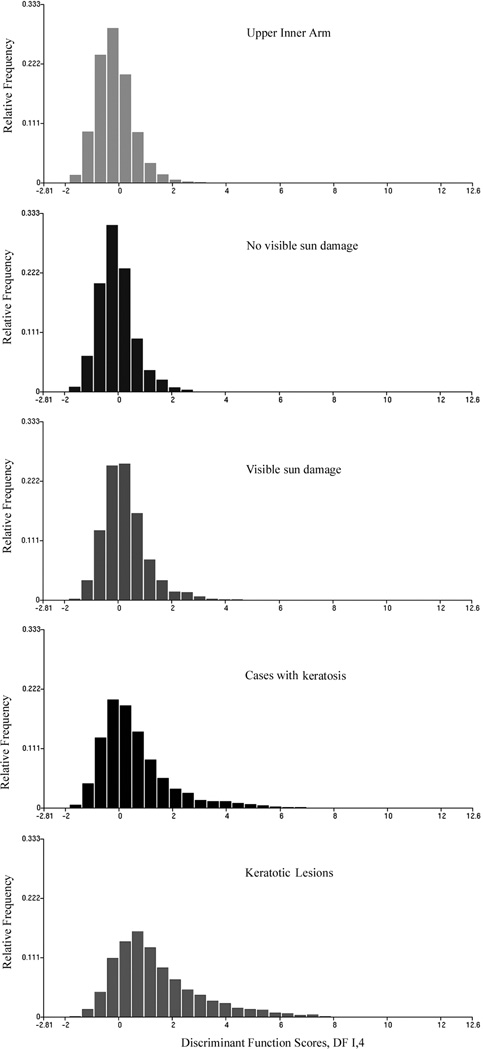
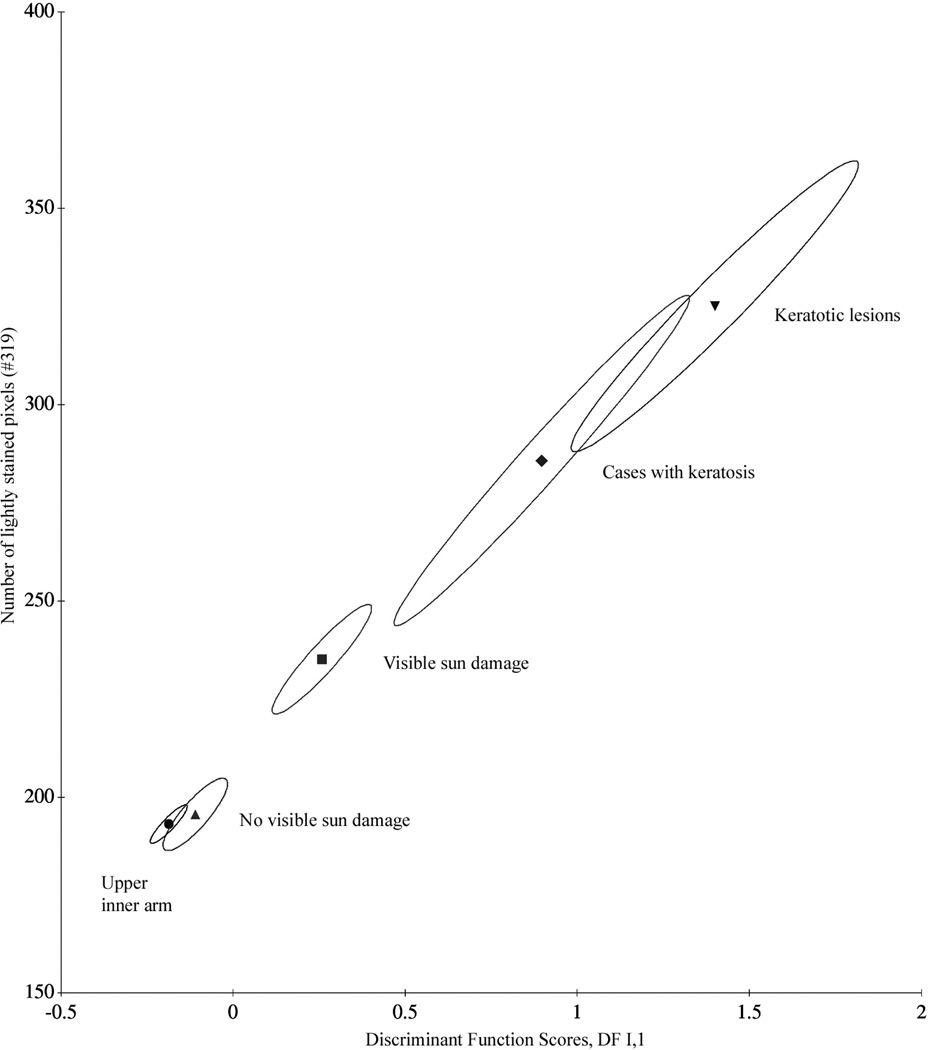
The function DF I,1 was next applied to all sampling sites. Figure 1 shows the monotonic shift in the score distributions, and Table III lists the discriminant function scores. Figure 2 shows a bivariate plot using the chromatin texture feature #319, lightly stained pixels, and the mean discriminant function score DF I,1 to plot a progression curve. The figure shows the confidence ellipses for the case mean values. Progressive sun damage finds expression not only in the increase of feature values, and of the discriminant function scores for the different sampling sites, but in a notable increase in dispersion. Table IV lists, for the features used in the discriminant function DF I,1, the standard deviations as a function of increased sun exposure.
Figure 1.
Score distributions for discriminant function DF I,1
Table III.
Mean discriminant function scores and sample sizes
| DF I,1 | n | |
|---|---|---|
| Normal-appearing skin | ||
| Upper inner arm | −0.1742 | 23,437 |
| Participants with no visible sun damage | −0.0808 | 5,435 |
| Participants with visible sun damage | 0.2416 | 5,407 |
| Participants with actinic keratosis | 0.5609 | 2,974 |
| Actinic keratoses | 1.4190 | 2,874 |
Figure 2.
Progression curve for sun damage in skin and 95% confidence regions for bivariate case means
Table IV.
Standard deviations of features used in DF I,1
| Feature | Upper inner arm |
No visible sun damage |
Visible sun damage |
Normal skin from participants with actinic keratoses |
Actinic keratoses |
|---|---|---|---|---|---|
| # 319 light stained pixels | 62.7 | 63.3 | 80.2 | 122.5 | 160.36 |
| # 002 relative nuclear area | 6.5 | 6.5 | 6.96 | 11.2 | 13.12 |
| # 307 run percentage | 122.5 | 129.8 | 126.1 | 189.0 | 221.5 |
| # 001 total optical density | 0.207 | 0.184 | 0.219 | 0.352 | 0.4141 |
| # 321 dark stained pixels | 89.8 | 87.99 | 106.8 | 145.2 | 174.7 |
| # 314 pixel optical density clumpiness | 0.069 | 0.065 | 0.065 | 0.068 | 0.070 |
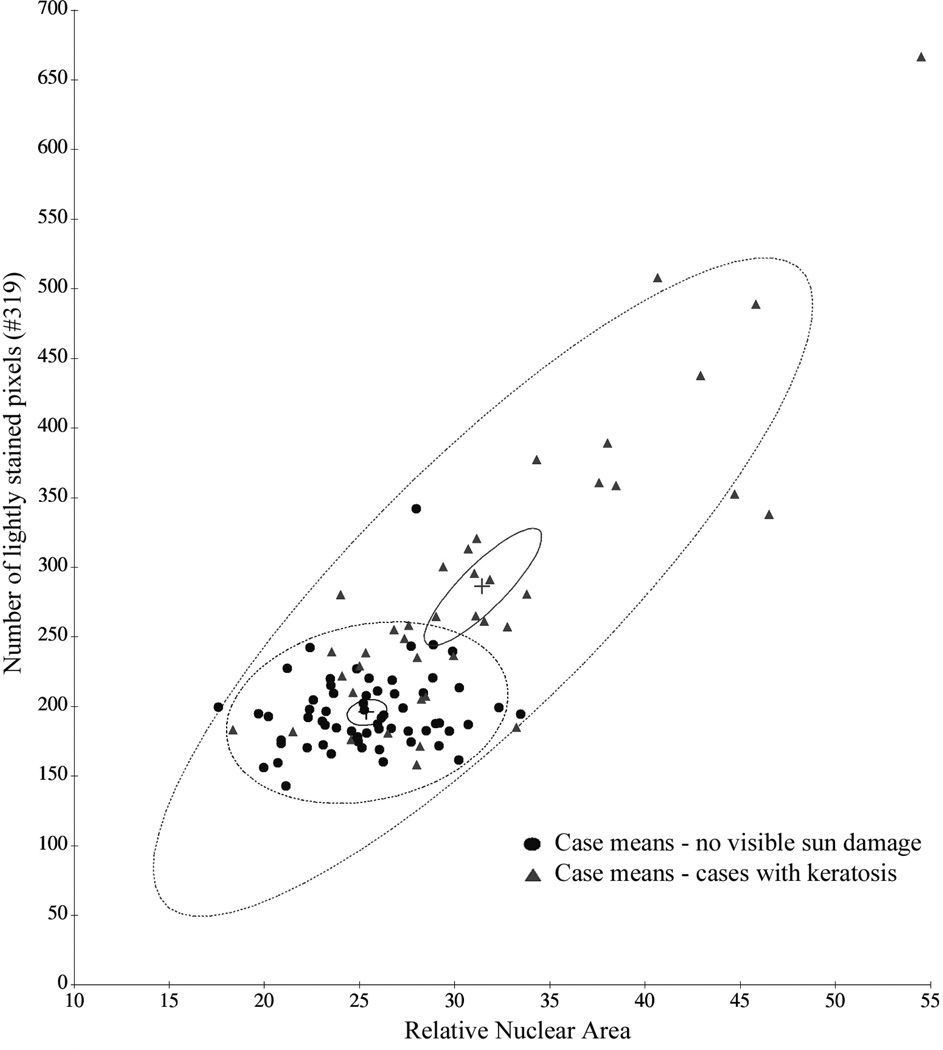
This is also illustrated by the plot in Figure 3, which shows the case mean values for the two features relative nuclear area and number of lightly stained pixels in cases of sun-exposed skin without visible sun damage and histopathologically normal skin from cases with AK.
Figure 3.
Increase in case mean values and in variance as a function of increased sun exposure
Nuclei were examined to determine if one could distinguish sun-exposed skin but no visible sun damage from histopathologically normal, sun-exposed skin with visually-apparent sun damage. Two training sets were formed by splitting the cases into two subsets, with 2,732 and 2,569 nuclei respectively. Feature selection, based on a Kruskal Wallis test, resulted in four features: the number of lightly stained pixels in the nucleus (feature #319), the average pixel optical density (feature #317), a run length feature in the high optical density, long run range (feature #290), and a cooccurrence feature in the high optical density value range (feature #54). Table V lists these features with their values in order of their standardized coefficients of the discriminant function DF I,2. All feature values are given in relative, arbitrary numbers.
Table V.
Features used in discriminant function DF I,2
| Feature | No visible sun damage |
Visible sun damage |
Standardized coefficient |
|---|---|---|---|
| # 319 lightly stained pixels | 196.5 | 232.4 | 0.7105 |
| # 317 average pixel optical density | 70.27 | 76.1 | 0.4181 |
| # 290 run length, high optical density | 5.79 | 11.58 | 0.2898 |
| # 54 coocurrence, high optical density | 7.82 | 24.55 | 0.1084 |
The discriminant function resulted in the nuclear classifications shown in Table VI. Applied to the remaining data set of 2,703 and 2,838 nuclei, respectively, the test set results were obtained. Table VI also shows the results for the combined data sets. The overall accuracy was 65.9%. Wilks’ Lambda was reduced by 12% to a value of 0.88.
Table VI.
Nuclear classification in training and test sets from skin with no visually apparent sun damage and skin with visually apparent sun damage
| No visible sun damage | Visible sun damage | |
|---|---|---|
| Training sets | ||
| No visible sun damage | 75.6% | 24.4% |
| Visible sun damage | 39.3% | 60.7% |
| Test sets | ||
| No visible sun damage | 68.7% | 31.3% |
| Visible sun damage | 43.3% | 56.7% |
| Combined sets | ||
| No visible sun damage | 72.7% | 27.3% |
| Visible sun damage | 40.9% | 59.1% |
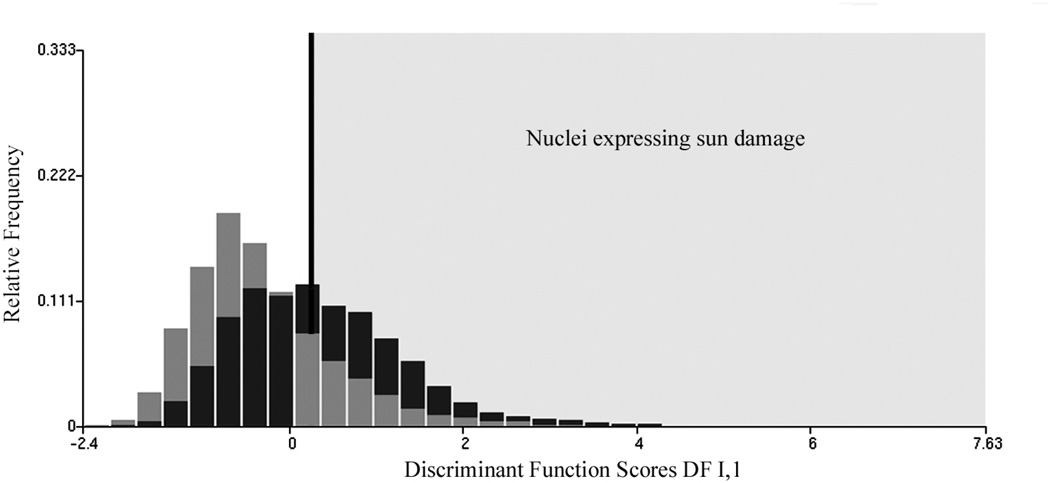
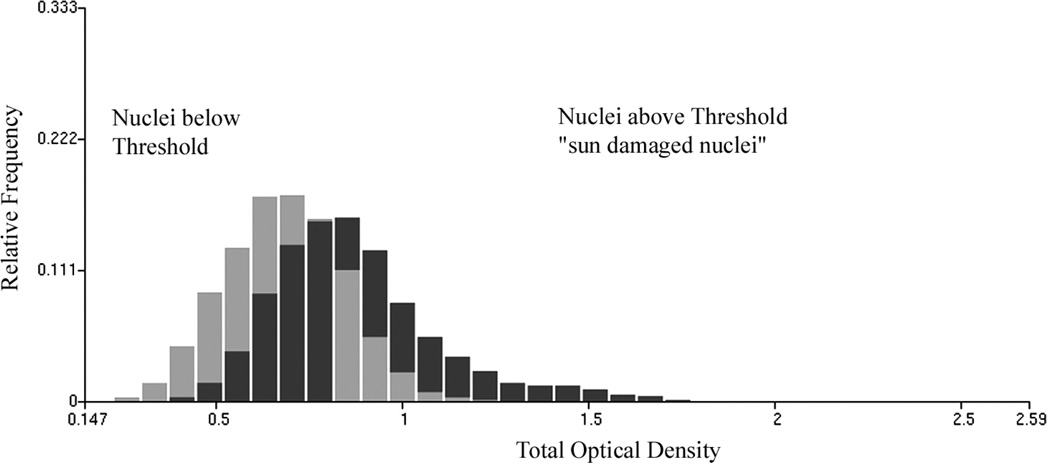
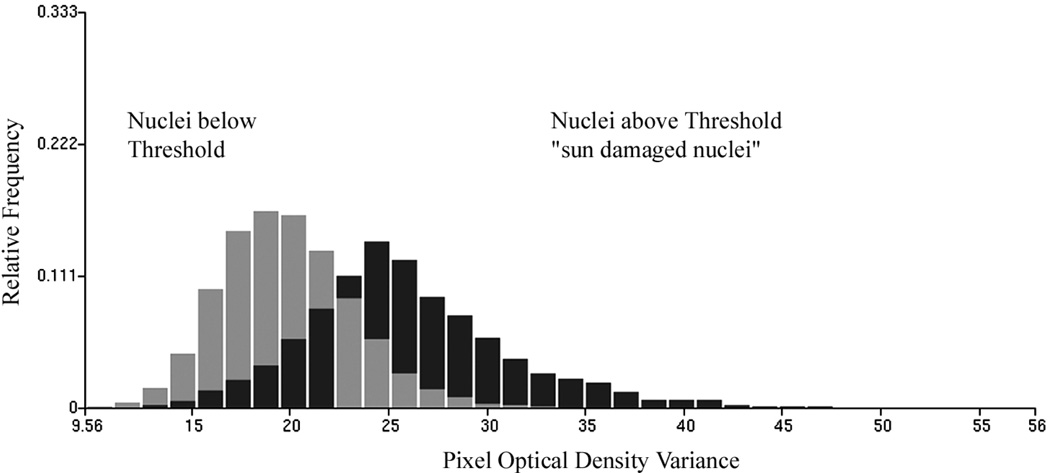
In an effort to characterize the change in feature values in nuclei revealing sun damage a threshold was set on the discriminant function DF I,2 score axis, arbitrarily at a value of +0.25, as indicated in Figure 4. For the nuclei from skin with no visible damage, 20% of nuclei fall above the threshold, for the nuclei from skin with visible sun damage there are 48.8% above threshold. The nuclei above threshold are presumed to reflect the effects of sun-damage, the ones below are taken to be much less affected. Table VII lists the differences in feature values for these two groups of nuclei for selected chromatin features. Table VIII shows the values of the amibiguity function to demonstrate which features show the most distinct changes between the two sets of nuclei below and above the threshold. Figure 5 shows the increase in total optical density in the sun damaged nuclei, and Figure 6 shows the increase in pixel optical density variance.
Figure 4.
Threshold set in discriminant function DF I,2, to enrich nuclei expressing sun damage
Table VII.
Feature values for nuclei above and below threshold
| Feature | Below threshold | Above threshold |
|---|---|---|
| # 001 total optical density (OD) | 0.682 | 0.877 |
| # 002 relative nuclear area | 25.8 | 26.9 |
| # 006 pixel optical density variance | 19.77 | 26.0 |
| # 306 run length non-uniformity | 7.90 | 11.2 |
| # 307 run percentage | 428.6 | 502.8 |
| # 312 pixel OD heterogeneity | 0.294 | 0.374 |
| # 315 pixel OD condensation | 0.188 | 0.254 |
| # 316 pixel OD 20 % below mean | 53.8 | 67.3 |
| # 317 mean pixel OD | 67.3 | 84.1 |
| # 318 pixel OD 20 % above mean | 80.7 | 100.9 |
| # 319 lightly stained pixels | 180.7 | 216.7 |
| # 320 medium stained pixels | 1219 | 1125 |
| # 321 dark stained pixels | 302.5 | 379.8 |
Table VIII.
Values of ambiguity function
| Feature | Ambiguity function value |
|---|---|
| # 015 pixel optical density dn/n 0.7–0.8 | 0.672 |
| # 290 runs > 11, pixel optical density 0.9–1.2 | 0.670 |
| # 316 pixel optical density 20 % below mean | 0.680 |
| # 317 average pixel O.D. | 0.680 |
| # 006 pixel O.D. variance | 0.710 |
| # 306 run length non-uniformity | 0.742 |
| # 319 number of lightly stained pixels | 0.750 |
| # 016 pixel optical density dn/n 0.8–0.9 | 0.768 |
| # 040 coocurrence pixel optical density 0.6–0.9 | 0.797 |
| # 001 total optical density | 0.842 |
| # 315 pixel optical density condensation | 0.844 |
Figure 5.
Increase in total optical density for sun damaged nuclei
Figure 6.
Increase in pixel optical density variance for sun damaged nuclei
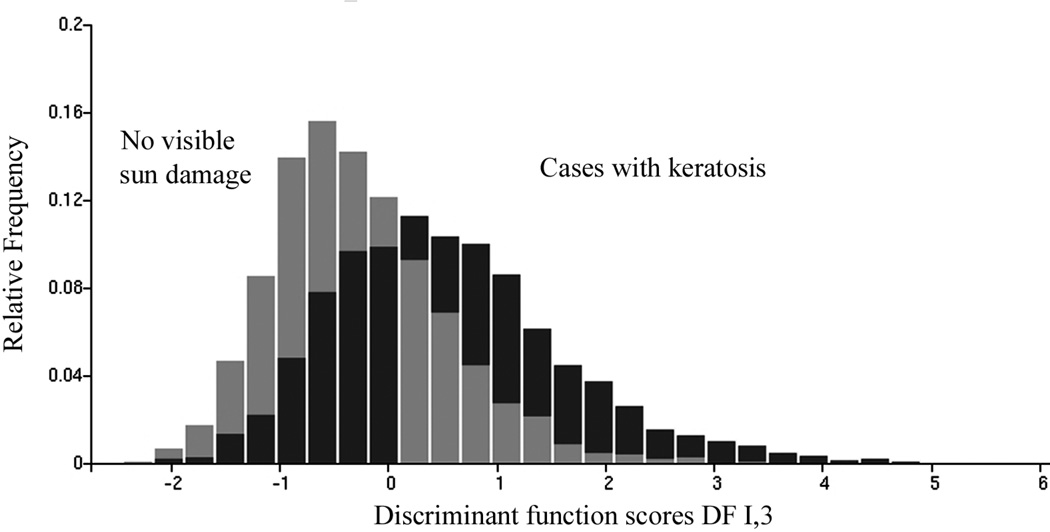
The next analysis tested the hypothesis that histopathologically normal skin from the forearms of individuals who had sun exposure to the extent that they developed AK shows more damage than the differences seen between biopsies from cases with no visible and with visible sun damage. Of the 5,435 nuclei available for the "no visible damage" data set and 2,974 nuclei from the biopsies of individuals who had developed AK lesions, two training sets were formed of 2,722 and 1,489 nuclei, respectively. The remaining 2,713 and 1,485 nuclei were used for the test sets of no visible damage and AK lesions, respectively. Feature selection resulted in the choice of five features, four of which were used in the discriminant function DF I,3 . These four features and their standardized coefficients are presented in Table IX. The distribution of discriminant function scores for DF I,3 is shown in Figure 7. Table X shows the nuclear classification results for the training sets, test sets, and the combined data sets.
Table IX.
Features used in the discriminant function DF I,3
| Feature | No visible damage |
Normal skin from cases with actinic keratosis |
Standardized coefficient |
|---|---|---|---|
| # 319 number of lightly stained pixels | 196.1 | 253.7 | −0.4763 |
| #040 coocurrence 3.3 | 521.0 | 389.8 | +0.4162 |
| #314 pixel optical density clumpiness | 0.693 | 0.677 | −0.3508 |
| #292 runs 3–4, pixel optical density 1.2–1.5 | 0.655 | 2.67 | −0.250 |
Figure 7.
Distribution of discriminant function scores for DF I,3
Table X.
Classification results from DF I,3
| No visible sun damage |
Normal skin from cases with actinic keratosis (AK) |
|
|---|---|---|
| Training sets | ||
| No visible sun damage | 78.9% | 21.1% |
| Normal skin from cases with AK | 39.2% | 60.8% |
| Test sets | ||
| No visible sun damage | 77.5% | 22.5% |
| Normal skin from cases with AK | 48.5% | 51.5% |
| Combined sets | ||
| No visible sun damage | 73.3% | 26.7% |
| Normal skin from cases with AK | 38.2% | 61.8% |
Discussion
Karyometry provides an exquisitely sensitive method to measure and monitor actinic damage in skin. In this study the progression of damage in histopathologically "normal" skin is reported. A number of characteristics of the nuclear chromatin pattern undergo changes on the order of 200% and more, from skin with minimum sun exposure to skin from the forearms of individuals with sufficient sun exposure to have developed actinic keratoses (AKs). Additional sun damage does occur, as is also evident from the data shown in Table IV.
Karyometry thus offers itself, with its ability to serve as an integrating biomarker, to a monitoring of accruing sun damage, and to a quantitative assessment of efficacy of a chemopreventive intervention.
The nuclear chromatin pattern undergoes a gradual change with increasing sun exposure. These changes reach a notable level once visually apparent sun damage can be observed. In the forearm of individuals who had sufficient sun exposure to have developed AK lesions feature values may increase in value by as much as 150% -- halfway to values seen in AK lesions.
The discriminant analyses conducted on biopsies from histopathologically normal skin are targeted at nuclei with varying degrees of progressive change. The interpretation of classification results therefore must put emphasis on the percentage of nuclei exhibiting actinic damage, rather than on a percentage of "correctly" classified nuclei. In minimally exposed skin about 90% of nuclei exhibit a "normal" chromatin pattern, in sun exposed skin this percentage is reduced to about 70 to 80%, and in the extreme of individuals with AK only 40% of nuclei are less affected, the same percentage as seen in AK lesions.
Acknowledgement
This study was supported by grant number P01 CA027502 from the National Cancer Institute.
Contributor Information
Peter H. Bartels, Professor Emeritus at the College of Optical Sciences, University of Arizona, Tucson AZ
Robert S. Krouse, Staff General and Oncologic Surgeon, Southern Arizona Veterans Affairs Health Care System; Associate Professor of Surgery, University of Arizona, Tucson AZ
Anil R. Prasad, Staff Pathologist, Southern Arizona Veterans Affairs Health Care System; Assistant Professor of Clinical Pathology, University of Arizona, Tucson AZ
Michael Yozwiak, Research Specialist, Senior, Arizona Cancer Center, University of Arizona, Tucson AZ
Yun Liu, Research Specialist, Senior, Arizona Cancer Center, University of Arizona, Tucson AZ
Hubert G. Bartels, Applications Programmer, Senior, Arizona Cancer Center, University of Arizona, Tucson AZ
David S. Alberts, Regents’ Professor of Medicine, Pharmacology, Nutrition and Public Health, Arizona Cancer Center, University of Arizona, Tucson AZ
References
- 1.Bozzo PD, Vaught LC, Alberts DS, Thompson D, Bartels PH. Nuclear morphometry in solar keratosis. Anal Quant Cytol Histol. 1998;20(1):21–28. [PubMed] [Google Scholar]
- 2.Bozzo P, Alberts DS, Vaught L, da Silva VD, Thompson D, Warnecke J, Miller RC, Einspahr J, Bartels PH. Measurement of chemopreventive efficacy in skin biopsies. Anal Quant Cytol Histol. 2001;23:300–312. [PubMed] [Google Scholar]
- 3.Ranger Moore J, Bozzo P, Alberts DS, Einspahr J, Yun Liu, Thompson D, Stratton S, Stratton MS, Bartels PH. Karyometry of nuclei from actinic keratosis and squamous cell cancer of the skin. Anal Quant Cytol Histol. 2003;25:353–361. ( 2003 ). [PubMed] [Google Scholar]
- 4.Carpenter PM, Linden KG, McLaren CE, Kuo-Tong Li, Arain S, Barr RJ, Hite P, Sun JD, Meyskens FL. Nuclear morphometry and molecular biomarkers of actinic keratosis, sun-damaged, and nonexposed skin. Cancer Epidemiol, Biomarkers Prev. 2004;13:1996–2002. [PubMed] [Google Scholar]
- 5.Bartels PH, Alberts DS, Hess LM, Yozwiak M, Bartels HG. Limits of detection of chemopreventive efficacy: karyometry of skin biopsies. Cancer Epidemiol Biomarkers Prev. doi: 10.1158/1055-9965.EPI-08-0313. submitted. [DOI] [PMC free article] [PubMed] [Google Scholar]
- 6.Alberts DS(PI) Chemoprevention of Skin Cancer Program Project P01 CA027502. NCI/NIH; [Google Scholar]
- 7.Kruskal WH, Wallis WA. Use of ranks on one-criterion variance analysis. J. Amer Stat Assoc. 1952;47:583–621. Addendum: 48: 907–911, 1953. [Google Scholar]
- 8.Genchi H, Mori K. Evaluation and feature extraction on automatic pattern recognition system. Denki Tsuchin Gakkai Pari (in Japanese) 1965:1. [Google Scholar]
- 9.Bartels PH, Olson GB. Computer analysis of lymphocyte images. In: Catsimpoolas N, editor. Methods of Cell separation. New York: Plenum Press; 1980. pp. 1–99. [Google Scholar]


