Abstract
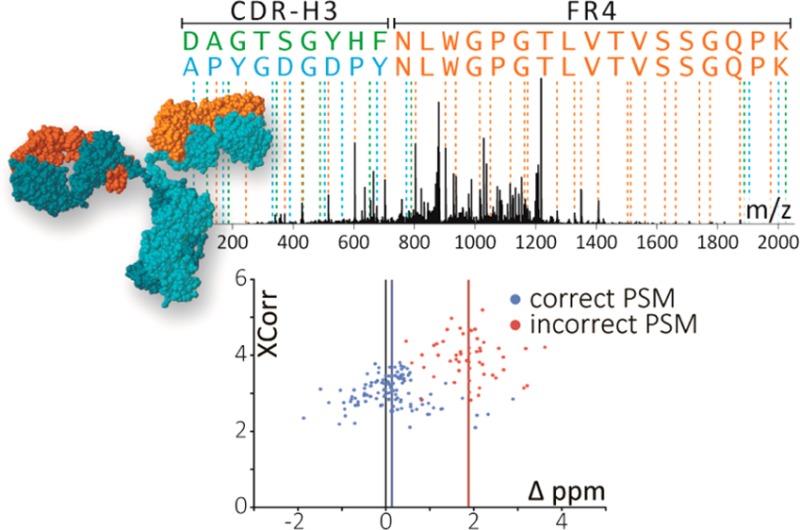
Characterizing the in vivo dynamics of the polyclonal antibody repertoire in serum, such as that which might arise in response to stimulation with an antigen, is difficult due to the presence of many highly similar immunoglobulin proteins, each specified by distinct B lymphocytes. These challenges have precluded the use of conventional mass spectrometry for antibody identification based on peptide mass spectral matches to a genomic reference database. Recently, progress has been made using bottom-up analysis of serum antibodies by nanoflow liquid chromatography/high-resolution tandem mass spectrometry combined with a sample-specific antibody sequence database generated by high-throughput sequencing of individual B cell immunoglobulin variable domains (V genes). Here, we describe how intrinsic features of antibody primary structure, most notably the interspersed segments of variable and conserved amino acid sequences, generate recurring patterns in the corresponding peptide mass spectra of V gene peptides, greatly complicating the assignment of correct sequences to mass spectral data. We show that the standard method of decoy-based error modeling fails to account for the error introduced by these highly similar sequences, leading to a significant underestimation of the false discovery rate. Because of these effects, antibody-derived peptide mass spectra require increased stringency in their interpretation. The use of filters based on the mean precursor ion mass accuracy of peptide-spectrum matches is shown to be particularly effective in distinguishing between “true” and “false” identifications. These findings highlight important caveats associated with the use of standard database search and error-modeling methods with nonstandard data sets and custom sequence databases.
The ability of the humoral immune system to provide broad protection against a diverse and constantly changing population of invasive pathogens stems largely from the antigen-binding capabilities of the antibody (immunoglobulin, Ig) repertoire. Antibodies recognize foreign molecules (antigens) through epitope-binding sites in the variable domains of the antigen binding fragment (Fab) and alert immune cells to putative threats through interaction sites in the constant domain of the tail region. Individual antibodies will preferentially bind a particular antigenic epitope, with specificity largely determined by the antigen-binding site sequences in the variable domains of immunoglobulin heavy chain (VH) and light chain (VL) genes. In order to provide coverage against a large variety of potential antigens, the B cell-encoded antibody repertoire is incredibly diverse, estimated to comprise >108 immunoglobulins with distinct variable domain sequences in human serum,1,2 resulting in an antibody population capable of binding a broad range of antigens with high affinity and specificity.
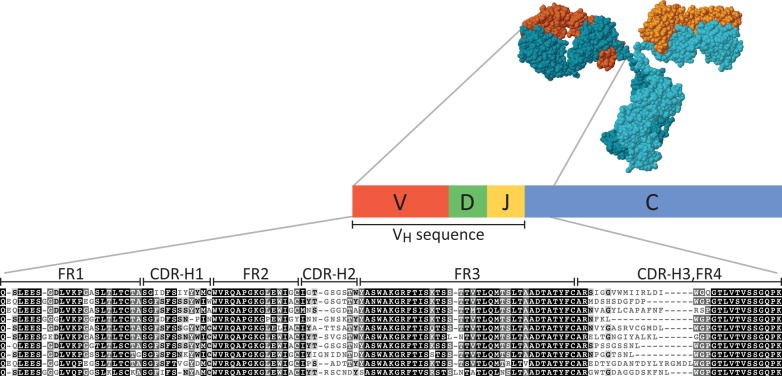
This massive diversification of sequence is the product of two processes: V(D)J recombination during B cell maturation and somatic hypermutation during B cell affinity maturation.3 In the heavy chain specifically, the variable domain is generated by recombination of V, D, and J gene segments, with a single subgene of each segment selected from multiple variants encoded in the germline genome (Figure 1). Two of the three hypervariable loops responsible for antigen-binding (CDR-H1 and CDR-H2) are encoded within the V gene segment, while the third (CDR-H3) is largely nontemplated and is constructed by the addition of random nucleotides (N-nucleotides) between the recombination joints of the V, D, and J segments.3,4 V(D)J recombination generates a single pair of VH and VL genes per B cell, such that every B cell expresses only one antibody variant. Somatic hypermutation during humoral immune response fine-tunes affinity for antigen by introducing additional mutations in the variable domain, further increasing the sequence variation and in turn expanding the sequence diversity within a clonotype.5 Consequently, antibodies that originate from the same B cell precursor lineage are designated as belonging to the same clonotype and generally exhibit specificity for the same antigen.
Figure 1.
A schematic of the structure and representative sequences of the immunoglobulin (Ig) heavy chain variable domain (VH). The VH sequence is created by recombination of V, D, and J subgenes and encodes epitope binding sites for antigen-recognition. Complementarity determining regions (CDRs) represent uniquely nondegenerate fingerprints, interspersed between constant framework sequences (FRs), and manifest as hypervariable and conserved sequences, respectively, in the multiple sequence alignment. Antigen binding specificity is primarily dictated by the CDR-H3 region. Hence, the challenge of antibody repertoire proteomics can be largely reduced to the problem of successfully identifying CDR-H3-containing peptides.
The process of Ig diversification has been elucidated, and methods for the identification and expression of monoclonal antibodies, including creation of hybridomas, immortalization of B lymphocytes, and cloning of antibody genes from primary lymphocytes, have revolutionized diagnostics and expanded our understanding of how immune responses induce the production of circulating antibodies that help clear a pathogen. Recently, next-generation (NextGen) sequencing has made possible investigations of the scope and sequence composition of the antibody repertoire, as represented in the population of B cells sequenced.6,7 With technical and financial barriers to personalized sequencing substantially dropping with advances in NextGen technologies, immune-related repertoire sequencing is becoming more commonplace.8,9 However, the B cell repertoire includes many sequences which are not represented in the circulating pool of serum immunoglobulins. Characterization of the polyclonal serum response thus requires direct observation of the constituent monoclonal antibodies present at functionally relevant concentrations.
Unfortunately, the proteomic analysis of serum immunoglobulins by mass spectrometry (MS) presents several challenges. One such challenge arises from the fact that antibody genes are not encoded in the germline but are assembled via DNA recombination and diversified within individual B cells. As a result, the typical strategy of constructing a reference database from the genome sequence is not useful for interpreting antibody-derived mass spectra.10,11 The use of de novo peptide sequencing for mass spectral interpretation does not require a reference database,12 thus offering a promising solution to this problem; however, current methods are not yet capable of handling the complexity of peptide sequence diversity present in serum.
A strategy has recently emerged which largely overcomes these barriers by utilizing high-throughput sequencing of the immunoglobulin variable domain (V gene) from an individual’s B cell population to construct a sample-specific antibody sequence database for the interpretation of antibody-derived mass spectral data.13,14 With the ability to generate a personalized reference database, it is now possible to apply shotgun-style MS proteomics to the analysis of serum antibodies, as demonstrated by recent studies identifying antigen-specific monoclonal antibodies directly from serum,13−16 yet even with the availability of such a database, confident identification of monoclonal antibodies is not trivial. The high degree of sequence identity shared across antibodies introduces additional complications in sequence-to-spectrum assignments and protein inference, making proteomic analysis of the repertoire particularly challenging.
The complexity of the V gene repertoire can best be understood as a massively expanded set of homologous proteins, each sharing regions of highly conserved (or identical) sequences with short intervening hypervariable sequences. From a proteomics perspective, this creates a large pool of potential peptide sequences with at least partial sequence identity. Proteolytic digestion of antibodies for shotgun proteomics yields many peptides that map to multiple clonotypes and are therefore noninformative for monoclonal antibody identification or that share partial sequence identity with many other candidate peptides, resulting in highly similar mass spectra that are difficult to interpret unambiguously, even with the high resolution and mass accuracy of current mass spectrometers.
In this paper, we detail how these interspersed segments of variable and conserved amino acid sequences create unusual features in the corresponding antibody peptide mass spectra. We demonstrate the importance of using high mass accuracy liquid chromatography mass spectrometry (LC-MS/MS) and describe how antibody proteomics requires a particularly high stringency in the interpretation of the peptide mass spectra for reasons that are intrinsic to antibody gene structure. Finally, we offer specific guidelines for the interpretation of antibody peptide mass spectra focusing on correctly distinguishing CDR-H3 peptides with shared subsequences.
Experimental Methods
Materials and Reagents
Concholepas concholepas hemocyanin (CCH), Protein A agarose, Protein G Plus agarose, N-hydroxysuccinimide (NHS)-activated agarose, immobilized pepsin resin, and Zeba spin columns were acquired from Pierce (Thermo Fisher Scientific, Rockford, IL). Incomplete Freund’s Adjuvant (IFA), TRIS hydrocholoride (Tris-HCl), ammonium bicarbonate (NH4HCO3), 2,2,2-trifluoroethanol (TFE), dithiothrietol (DTT), triethylphosphine (TEP), iodoacetamide (IAM), and iodoethanol (IE) were obtained from Sigma-Aldrich (St. Louis, MO). Urea and AG-5Ol-X8 resin were purchased from Bio-Rad (Hercules, CA). Microcon 10 kDa MWCO (Microcon-10) centrifugal filter columns from Millipore (Bedford, MA) and Hypersep SpinTip C18 columns (C18-SpinTips) from Thermo Scientific (Rockford, IL) were used in LC-MS/MS sample preparation along with LC-MS grade water, acetonitrile (ACN), and formic acid from EMD (Billerica, MA).
Rabbit Immunization, V Gene Sequencing, and Preparation of Serum Antibodies
Methods for immunization, V gene sequencing, and preparation of antibodies for this study were previously described in Wine et al.13 Briefly, a New Zealand white rabbit was immunized with 100 μg of CCH protein. Booster immunization with antigen in IFA was administered at days 14 and 28. The animal was sacrificed at day 35. Total RNA was isolated from femoral bone marrow cells (BM), peripheral B cells (PBCs), and CD138+ bone marrow plasma cells (BM-PCs), and cDNA libraries were generated from poly(A)+ RNA. V gene cDNA was amplified by 5′RACE with primers complementary to rabbit IgG CH1 and sequenced using the Roche 454 GS FLX Titanium platform (Roche Diagnostics GmbH, Mannheim, Germany). Sequencing data was processed using sequence quality and signal filters in the 454 Roche analysis pipeline, followed by identification of conserved framework regions and V germline gene identification using the IMGT/HighV-Quest Tool. Additional filters were applied to remove truncations (sequence length <70 amino acids, misalignment of framework regions FR1 and FR4) and sequences containing stop codons or ambiguous reads. In total, >1.5 × 10⁵ reads were obtained, resulting in 107 672 unique full-length, in-frame VH genes. For reference sequence database construction, single read sequences were excluded to reduce the impact of sequencing errors (18 593 VH genes ≥2 reads).
Serum IgG was purified by protein A agarose affinity chromatography, and F(ab′)2 fragments were generated by digestion with immobilized pepsin. Antigen-specific IgG-derived F(ab′)2 was isolated by affinity chromatography against CCH protein coupled to NHS-activated agarose and eluted in 100 mM glycine, pH 2.7. Immediately following elution, the pH was neutralized with 1 M Tris-HCl, pH 8.5. Protein concentrations were measured using an ND-1000 spectrophotometer (Nanodrop, DE, USA).
Alternative Cysteine Alkylation and Trypsin Digestion
Protein samples were concentrated on Microcon-10 columns and split into aliquots for alternative cysteine modification. For IAM alkylation, aliquots were resuspended in 50% (v/v) TFE, 50 mM NH4HCO3, and 2.5 mM DTT and incubated at 37 °C for 60 min. Reduced samples were then alkylated with 32 mM IAM at room temperature, in the dark, for 60 min. Alkylation was quenched by addition of 7.7 mM DTT. Samples were diluted to 5% TFE and digested with trypsin at a ratio of 1:75 trypsin/protein at 37 °C for 5 h. Digestion was halted by addition of formic acid to 1% (v/v) concentration.
For IE alkylation, trypsin digestion in the presence of urea was carried out as previously described17 with the following modifications: Samples were resuspended in 8 M urea and then diluted to a final reaction solution consisting of 2.4 M urea, 200 mM NH4HCO3, pH 11.0, 49% (v/v) ACN, 8.5 mM TEP, and 65 mM IE. pH was adjusted to 10, and samples were incubated at 37 °C for 60 min. Samples were concentrated by SpeedVac (Eppendorf, NY, USA) and resuspended in 100 mM Tris-HCl, pH 8.5, to reach a final urea concentration of 1.6 M prior to trypsin digestion. Trypsin was added at a ratio of 1:75 trypsin/protein at 37 °C for 5 h. The digestion was quenched with 1% formic acid.
Human Raw Spectral Data and VH Sequence Database
All human data used in this study corresponds to the donor HD1 data set previously described in Lavinder et al.15 In summary, a healthy human subject (HD1) was administered the tetanus toxoid/diphtheria toxoid vaccine (Sanofi Pasteur MSD GmbH, Leimen, Germany) for booster immunization 7 years after the previous booster. VH and VL gene sequences from plasmablasts and memory B cells isolated at 7 days and 3 months postboost were determined by Roche 454 sequencing. Sequence data was processed and filtered as described for rabbit sequencing. In total, 70 326 VH gene sequences were used in construction of the human HD1 reference sequence database.
IgG was purified by affinity chromatography with Protein G Plus agarose from serum samples collected at prevaccination (day 0), 7 days, 3 months, and 9 months postvaccination and digested with immobilized pepsin resin to generate F(ab′)2 fragments. Antigen-specific F(ab′)2 was isolated by affinity chromatography against vaccine-grade tetanus toxoid protein (Statens Serum Institut) coupled to NHS-activated agarose and eluted with 20 mM HCl (pH 1.7). Eluted samples were neutralized with 1 M NaOH, 10 mM Tris-HCl and desalted on a 2 mL Zeba spin column prior to denaturation with 50% TFE, reduction with 10 mM DTT, and alkylation with 32 mM IAM. Samples were diluted 10-fold with 50 mM NH4HCO3 and digested with trypsin (1:35 trypsin/protein) overnight at 37 °C. Digestion was quenched with 1% formic acid.
Sample Preparation and LC-MS/MS Analysis
Digested IAM (human, rabbit) and IE (rabbit) samples were concentrated by SpeedVac, resuspended in Buffer C (5% ACN, 0.1% formic acid), and loaded and washed on C18-SpinTips according to the manufacturer’s protocol. Bound peptides were eluted in 60% ACN, 0.1% formic acid, concentrated by SpeedVac, resuspended in Buffer C, and filtered through Microcon-10 columns prior to LC-MS/MS analysis.
Peptides were separated by reverse phase chromatography on a Dionex UltiMate 3000 RSLCnano system (Thermo Scientific) using a Dionex Acclaim PepMap RSLC C18 column (Thermo Scientific), with eluting peptides analyzed on-line by nano-electrospray ionization tandem mass spectrometry on an Orbitrap Velos Pro (Thermo Scientific). Parent ion (MS1) scans were collected in the orbitrap at 60,000 resolution. Ions >+1 charge were selected for fragmentation by collision-induced dissociation, with up to 20 fragmentation spectra (MS2) collected per MS1. Monoisotopic precursor selection and dynamic exclusion were enabled, with 45-s exclusion time for ions selected more than twice in a 30-s window.
Construction of Target and Decoy Databases
Sample-specific target protein sequence databases were constructed for SEQUEST searches of rabbit and human mass spectral data. The CCH rabbit database consisted of VH and VL gene sequences (≥2 reads), Ensembl rabbit protein-coding sequences (OryCun2.0), and common contaminants (from MaxQuant Web site, http://maxquant.org/downloads.htm). The human HD1 database included VH and VL gene sequences, Ensemble human protein-coding sequences (release 64, longest sequence variant/gene), and MaxQuant common contaminants.
Decoy databases were constructed for rabbit and human analyses to evaluate the effects of decoy variants on error modeling of V-gene peptides. Reversed and shuffled databases were generated for each database at the protein level. Additionally, conserved-J region shuffled decoys were generated by preserving the conserved J-segment sequence (which directly follows the CDR-H3) of VH gene sequences. For the remaining V gene sequence, amino acids between arginine and lysine residues were shuffled, with Arg/Lys residues fixed to preserve peptide length and precursor mass distributions.
Computational Interpretation of Peptide Mass Spectra
Spectra were searched against the protein sequence and decoy databases described above using SEQUEST (Proteome Discoverer 1.3, Thermo Scientific). Fully tryptic peptides with up to 2 missed cleavages were considered. Mass tolerance filters of 5 ppm (MS1) and 0.5 Da (MS2) were applied. Static cysteine modifications of either carbamidomethylation (IAM-alkylation, +57.0215 Da) or ethanolyl (IE-alkylation, +44.0262 Da) were included on the basis of which modifying reagent was used. Oxidation of methionine (+15.9949 Da) was allowed as a dynamic modification. PSMs were filtered using Percolator (implemented in Proteome Discoverer) to control false discovery rates (FDR) to <1% as determined using a reverse-sequence decoy database.18 All observed precursor masses were recalibrated according to the methods of Cox et al.,19 and the average mass deviation (AMD) was calculated for all high-confidence PSMs (Percolator FDR <1%) matching the same reference peptide, as the mean difference between the observed precursor masses and the expected mass of that reference peptide in units of ppm. Due to the high frequency of isobaric peptides with isoleucine–leucine substitutions in V-gene sequences, we considered all Iso/Leu sequence variants as a single group and mapped the group to all CDR-H3 peptides associated with any of the group members. For other isobaric pairings (e.g., Asp/Gly-Gly, Gln/Gly-Ala) and ambiguous identifications where MS/MS spectral differences can distinguish between pairings, we considered only the top-ranked PSM determined by the SEQUEST-Percolator pipeline.
Survey of Covalent Peptide Modifications
In order to confirm the specificity of cysteine modifications and to assess the general overall presence of covalent post-translational modifications (PTMs) among antibody peptides, raw peptide mass spectra from the rabbit samples were computationally searched for the dominant, differentially observed PTMs as follows: Tandem mass spectral sets were first reduced in size and complexity through spectral clustering, in which merged spectra were represented by a single consensus spectrum. For each sample, spectra were initially grouped based on precursor mass so that all the members within a group were within 25 ppm of at least 1 other member. Hierarchical clustering was performed on the tandem mass spectra of each weight group using a fuzzy cosine similarity metric and weighted linkage criteria with a distance cutoff of 0.25. The fuzzy cosine similarity, or correlation, between two spectra A and B is defined as
where Ac is the convolution of spectrum A with a Gaussian 1 Da in width. This serves to influence the correlation by both the intensity of each peak pair and the closeness of the peaks in m/z. Spectra composing each cluster were then reduced into a single consensus spectrum. An average parent ion mass was then assigned to each cluster.
All pairs of spectral clusters between IAM- and IE-labeled samples were compiled with the constraint that the parent ion mass difference between pair members fell within ±60.5 Da. Similarity measures were calculated for each pair, the sum of which was a composite metric for judging spectral correlation. Pairs were then binned in 2D arrays by mass offset and composite correlation score. Because clusters had varying numbers of members, all cluster pairs were not equal and were therefore weighted by 0.5 plus the log of the product of the two membership counts. The sum of these weights gave a single summary statistic for each bin, and the data was visualized as a stacked bar graph consisting of 121 offset bins of width 0.02 Da that are centered at an integer value.
Differential Analysis of Cysteine Modifications
PTM analysis (described above) was used to identify pairs of spectral clusters exhibiting an observed parent mass difference of 12.995 ± 0.005 Da (or 25.99 ± 0.005 Da for two Cys) between IAM- and IE-treated samples. Paired clusters with similar elution times and fragmentation patterns were flagged as originating from cysteine-containing peptides. The top-ranked SEQUEST peptide identification for each cluster was then considered. If the same sequence was identified in both treatments (inherently requiring the presence of cysteine to match), the peptide sequence was flagged as a likely correct, or “true positive”, identification. If the peptide identification differed between treatment sets (precluding the presence of cysteine in the sequence), the corresponding peptide sequences were flagged as definitely incorrect, or “false positive”, identifications.
Results and Discussion
The goal of serum antibody proteomics is to systematically identify the distinct antibodies present in a serum sample, as assayed through the use of shotgun proteomics mass spectrometry. To achieve this, our approach relies on the integration of two main experimental pipelines: (1) high-throughput sequencing of B lymphocyte cDNAs to generate a database of class-switched antibody variable domain sequences in a particular individual; (2) a protein biochemistry and mass spectrometry-based proteomics pipeline for the identification of peptides derived from antigen-specific antibodies.
A personalized reference sequence database generated by the high-throughput sequencing pipeline is used to interpret antibody-derived peptide mass spectra obtained through the proteomics pipeline. Identified peptides can be mapped back onto the antibody sequence database to determine the distribution of specific clonotypes comprising the antigen-specific repertoire. However, the frequency of degenerate peptides mapping to multiple clonotypes complicates this analysis. Given that the CDR-H3 is the most hypervariable region in immunoglobulins and is overwhelmingly responsible for antigen specificity, as well as being the primary determinant of clonality, this problem can be largely simplified to that of the quantitation and sequence determination of CDR-H3 peptides. The remaining sequence of each antibody can then be retrieved from the V gene reference database.
For this study, we largely focused on analysis of serum samples from a New Zealand white rabbit (Oryctolagus cuniculus) immunized with Concholepas concholepas hemocyanin (CCH). Sequencing data for this rabbit was previously described13 and is summarized in the Experimental Methods. We focus here only on the VH sequences; while the partner VL chain contributes to antibody stability and binding characteristics, native VH-VL pairing information cannot be determined by proteomic analysis but can be derived by other methods once VH chains are known.13,20
From this rabbit, we prepared antigen-specific F(ab′)2 fragments, proteolytically digested them with trypsin, and analyzed the resulting peptides by quantitative shotgun proteomics, employing nanoflow LC-MS/MS (see Experimental Methods). A conventional analysis of the peptide mass spectra would involve comparing the spectra against the rabbit’s VH gene database in order to identify those antibodies actually present in the serum. However, as we next discuss, the conventional proteomics database search process is insufficient for the analysis of antibody peptide mass spectra due to intrinsic properties of the antibody sequences.
Limitations of Standard Peptide-Spectrum Assignments and Decoy-Based Error Modeling
While the general process of identifying the best peptide-spectrum match (PSM) is well established for conventional data sets searched against normal proteomic sequence databases,21,22 V-gene databases contain unique sequence characteristics which pose challenges to this standard method of data interpretation.
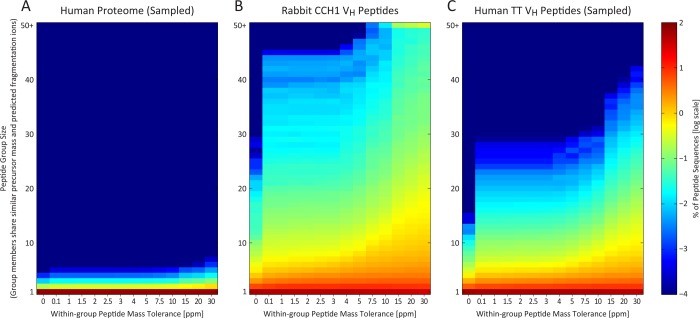
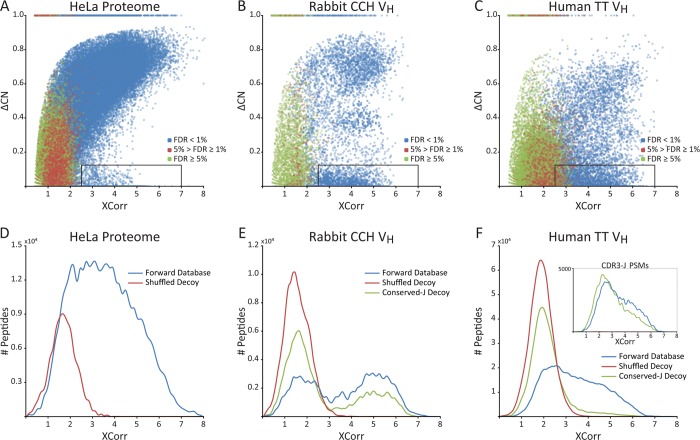
Under the standard target-decoy approach, candidate peptides within a specified mass range of the parent ion are initially scored based on cross-correlation to the observed fragmentation spectrum (XCorr), subjected to additional quality filters, and ultimately assigned confidence scores by reference to the score distributions of decoy sequences. For a conventional proteome, the occurrence of multiple peptides sharing partial sequence identity and mass is extremely rare, as can be seen for proteins sampled from the human proteome (Figure 2A). Thus, while multiple theoretical peptides may fall close in mass to a given precursor ion, the correct peptide sequence will almost always match the MS2 spectrum with a significantly higher score than competing, incorrect peptides. This is reflected by the positive correlation between XCorr and the normalized difference in XCorr between the top two PSMs of a given spectrum (ΔCN) (Figure 3A).
Figure 2.
In contrast to the proteome in general, antibody peptide sequences resemble each other in both mass and expected fragmentation patterns. The peptide sequence search space is thus strongly dependent on mass accuracy, as seen by plotting the extent of theoretical peptide-spectral match ambiguity, for (A) human proteome peptide sequences, (B) rabbit CCH antibody VH peptides, and (C) human tetanus toxoid antibody VH peptides. Reducing precursor mass tolerance thus more strongly affects the potential for false identifications in VH peptides than for a typical proteome. Here, an in silico digest of the rabbit CCH VH antibody sequences generated 505 790 unique peptide sequences (constrained to fully tryptic peptides of ≥8 amino acids, ≤6000 Da theoretical mass, and ≤2 missed cleavages). Each peptide sequence contributes to a y-axis bin defined by the self-inclusive count of all theoretical peptides within a specified mass tolerance (x-axis) and sharing at least 60% predicted fragmentation ion similarity. For comparison, the human proteome (A) and human TT VH (C) sequence databases were processed likewise and subsampled to include the same number of peptide sequences as (B). The intersequence similarity evident in the antibody sets is negligible in this size-matched human proteome control.
Figure 3.
Confidently identified spectra from most proteomics samples generally score well against only one database sequence. In contrast, the interspersal of conserved (framework) and variable regions in antibody F(ab′)2 sequences often leads to multiple high-scoring PSMs for a single IgG-VH peptide spectrum. Plotting the primary PSM score (XCorr) vs the normalized difference in XCorr scores between the two top-scoring matches (ΔCN) from proteomic analysis of (A) human HeLa cell lysate compared to (B) rabbit and (C) human IgG-VH peptide spectra reveals a substantial proportion of high XCorr/low ΔCN PSMs (denoted by black boxes) in the IgG-VH data sets. Standard false discovery rate (FDR) calculations fail for these PSMs, as illustrated by high (blue), medium (green), and low (red) Percolator confidence scores: many high XCorr/low ΔCN PSMs are erroneously assigned high confidence in spite of high-scoring second hits implicit in the low ΔCN values. Filtering out low ΔCN PSMs inadvertently removes many true hits. Comparison of PSM XCorr distributions between target (blue) and decoy (red) databases reveals that standard decoys do not adequately model the nonrandom structure of IgG-VH peptides [(D) human proteome, (E) rabbit IgG-VH, (F) human IgG-VH]. This is attributable to high-scoring, incorrect matches to IgG framework region-derived sequences. By constructing an alternate decoy database for which variable residues were shuffled but J-region framework regions were preserved (“Conserved-J Decoy”), ambiguity of CDR-H3,J peptide assignment can be modeled (green). These peptides acount for the majority of high-XCorr PSMs in rabbit (E), while additional framework-derived peptides add to the complexity of the human IG-VH sample (F, inset).
For the case of immunoglobulin variable genes, however, large numbers of peptide sequences overlap in both mass and partial sequence identity (as plotted for our VH data sets in Figure 2B,C), yielding sets of highly similar theoretical MS2 spectra. This confounds proteomics analysis and often results in, for a single spectrum, multiple ambiguous peptide-spectral matches sharing similarly high PSM correlation scores (observed as high-XCorr/low-ΔCN, i.e., high scoring-second rank hits) (Figure 3B,C). In some cases, incorrect sequences out-score the correct PSMs. Even when applying an extremely strict mass accuracy filter, requiring a peptide mass to fall within 5 ppm of the observed precursor ion mass to be considered, false identifications are still prevalent.
V-gene sequence similarity also effects decoy-based error-modeling. Standard errors in PSM assignment normally arise from poor quality spectra, which contain significant noise and/or additional peaks due to unaccounted for contaminating peptide fragments following ion isolation. In order to assign PSM confidence and calculate a false identification rate, a decoy reference database of either reversed or shuffled protein sequences is generally used to model this standard error, allowing for confidence-filtering based on discernible differences in the distributions of true and false positive PSMs (Figure 3D).22,23 Software programs such as Percolator18 analyze multiple parameters of target and decoy results (including XCorr, ΔCN, and others) in order to determine a set of high-confidence PSMs at a given FDR (Figure 3A–C). For the case of Ig V genes, reversing or shuffling sequences did not replicate the high incidence of high scoring-second rank hits observed in the forward search, demonstrating that a standard decoy database fails to model this aspect of IgG sequences (Figure 3E,F).
Immunoglobulin PSM Ambiguity Arises from Ig Peptides Containing Highly Immutable Framework Regions
To further investigate this trend, we focused on the partial sequence identity of CDR-H3-containing peptides. Most such peptides also contained the entirety of the J-region subsequence in both the rabbit and human samples, generally a series of 12 or more residues sharing exceptional self-similarity within each species. Hence, peptides containing the J-region shared a significant fraction of identical peaks within their fragmentation spectra, in addition to peaks contributed by the variable CDR-H3 sequence (Figure 4).
Figure 4.
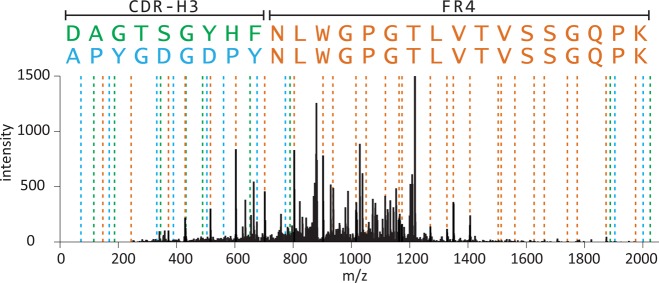
High-scoring PSMs for antibody CDR-H3 peptide mass spectra are dominated by matches to peptides sharing identical C-terminal J region FR4 framework sequences. This is illustrated by two top-scoring peptide sequences mapped to a single observed rabbit spectrum, with shared (orange) and unique in silico predicted MS2 fragmentation peaks associated with APYGDGDPYNLWGPGTLVTVSSGQPK (blue) and DAGTSGYHFNLWGPGTLVTVSSGQPK (green). Both sequences exhibit PSMs with XCorr >4.7 with a normalized difference in XCorr scores (ΔCN) of 0.006. A similar trend accounts for a large proportion of the high-scoring matches in Figure 3B,C,E,F.
In order to assess the magnitude of this effect on the resulting PSM scores, we generated sample-specific shuffled decoy databases in which the J-region residues were explicitly preserved (“Conserved-J Decoy”). Importantly, the Conserved-J Decoy database reproduced the incidence of high scoring-second rank hits observed in the J-region peptides and evident in the VH forward peptide database (Figure 3E,F[inset]). A significant portion of high scoring-second rank hits can therefore be attributed to CDR-H3-containing peptides partially matching other CDR-H3-containing peptides by their conserved J region sequences. More generally, Ig peptides containing an antibody framework region at one terminus are subject to this kind of ambiguous PSM assignment. Consequently, standard decoy-based error modeling significantly underestimates false identifications for this class of peptides.
Construction of a High-Confidence Set of Rabbit VH Identifications
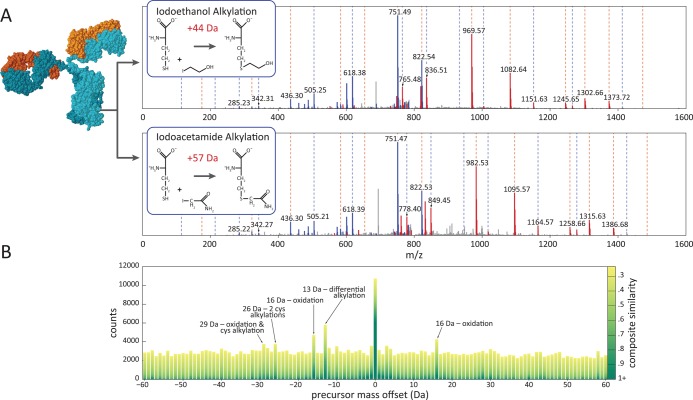
In order to determine the prevalence of incorrect identifications and find characteristics by which to discriminate between true and false matches, we employed differential labeling of cysteine residues to create a set of higher confidence identifications consistent with the cysteine labeling data and to flag a subset of definitively incorrect identifications as high-scoring false positives (Figure 5A). Rabbit F(ab′)2 fragments were divided into two aliquots. One aliquot was alkylated with iodoacetamide (IAM), while the second was alkylated with iodoethanol (IE). This created equivalent samples with the exception of a 13 Da mass difference between modified cysteine residues in the two samples.
Figure 5.
A limited set of higher-confidence identifications can be created using differential covalent modification to flag cysteine-containing peptides. (A) Comparison of rabbit CCH spectra from samples treated with iodoacetamide (Cys +57 Da) vs iodoethanol (Cys +44 Da) results in a 13 Da mass difference per cysteine. PSMs for paired spectra exhibiting a mass shift but no cysteine residues in the corresponding matched sequences can be flagged as false identifications. (B) Comparison of precursor mass offsets between differentially labeled rabbit CCH samples confirms alkylation and oxidation account for the most abundant modifications.
Following LC-MS/MS analysis, data sets corresponding to IAM- and IE-treated samples were compared to identify parent ion pairs across the two data sets exhibiting the signature 13 Da mass difference, similar chromatographic elution times, and correlated MS2 fragmentation spectra. Qualifying ion pairs were considered cysteine-containing; upon peptide-spectrum sequence assignment, ion pairs with identical sequences containing cysteine residues and displaying the 13 Da difference in the two aliquots were flagged as more likely to be correct and considered for these purposes to be “true positive” identifications. In contrast, those spectra shifted by 13 Da but lacking a cysteine residue in their assigned sequences were considered definitely incorrect, or “false positive”. By flagging peptides in this manner, we defined a set of 53 “true positive” and 40 “false positive” peptide identifications comprising 11 077 and 425 PSMs, respectively. This set was used both to diagnose PSM assignment error and to define filtering criteria appropriate for more general application across all PSMs, not just those containing cysteine residues.
To further assess these samples, we examined the frequency of all potential precursor ion mass offsets between the differentially treated samples so as to survey the most common covalent modifications, thus confirming the cysteine modifications and testing for other potential modifications (Figure 5B). Besides modified cysteine, only one other prevalent modification was found, occurring in both samples at a mass offset of 15.99 Da and consistent with oxidation. Detailed manual analysis of fragmentation spectra confirmed oxidized methionine as the main contributor to this offset peak.
A Stringent Average Mass Accuracy Filter Successfully Removes False Identifications
Using the high confidence true and false identification sets, we searched for mass spectral properties that distinguished these cases. We observed a robust difference in mass accuracy distributions (defined as the difference between observed precursor mass and expected peptide mass, in units of parts per million (ppm)), with the “true positive” PSMs centered around 0.127 ppm with a standard deviation of 0.637 ppm (following mass recalibration), while “false positive” PSMs were more evenly distributed throughout the mass range. This signal, while clear, was not suitable for direct use as a mass accuracy filter at the level of PSMs, since many individual “true positive” PSMs still deviated from expected mass by several ppm. Application of a strict mass accuracy filter to remove false PSMs would therefore inevitably remove many true PSMs as well (Figure 6A).
Figure 6.
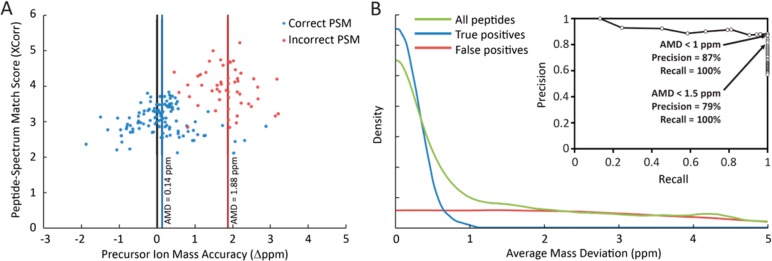
Correctly matched PSMs exhibit a systematically smaller average mass deviation (AMD) compared to incorrect identifications. (A) Plotting the difference in precursor ion mass from expected peptide mass (Precursor Mass Accuracy) vs XCorr scores of individual rabbit CCH PSMs reveals overlapping mass accuracy distributions for PSMs matched to the same peptide sequence for correct (blue) and incorrect (red) identifications. While individual incorrect PSMs may achieve higher XCorr scores than correct matches, the average precursor mass accuracy across all PSMs for a given peptide (AMD) discriminates well between correct and incorrect identifications. (B) For the set of high-confidence rabbit CCH PSMs derived from cysteine-labeling, true identifications exhibit low AMD scores while false identifications are more uniformly distributed. Thus, filtering by AMD strongly controls misidentifications. Here, controlling AMD to within 1.5 ppm provides 100% recall of true identifications and increases precision from near 50% (background rate) to 79%. Requiring AMD < 1 ppm further increases precision to 87% with no loss of recall.
However, the average mass deviation (AMD) of a peptide identification, calculated as the average mass accuracy of all high-confidence PSMs associated with a given peptide, showed an extremely narrow distribution for the “true positive” set (mean 0.141 ppm, stdev 0.238 ppm). In contrast, the “false positive” set exhibited a roughly uniform AMD distribution across the mass range. Consequently, filtering hits by applying a strict AMD filter was feasible without substantial loss of true identifications. Requiring AMD < 1.5 ppm in this data set improved the precision from a prior rate of approximately 50% to 79%, with no loss of true identifications. Applying an even stricter AMD threshold of 1 ppm further improved the precision to 87%, again with no loss of true identifications (Figure 6B). High mass accuracy LC-MS/MS is therefore sufficient to identify antibody CDR-H3 peptides from serum at relatively high precision when combined with a stringent AMD filter beyond the conventional proteomics analytical pipeline.
Conclusions
Proteomic analysis of serum immunoglobulins has only recently become feasible with the ability to generate appropriate mass spectrometry reference databases via next-generation sequencing of personal B cell antibody repertoires. Even with an appropriate custom database in hand, however, antibody sequences still present significant challenges for mass spectral interpretation due to the frequency of interspersed variable and conserved amino acid sequences within the same peptides. We have shown how these sequence properties lead to certain systematic trends in the fragmentation spectra of antibody-derived peptides, which introduce additional errors in peptide-spectrum correlation scoring not accounted for by standard decoy-based error modeling. The observation of similar sequence properties in rabbit and human data sets indicates that these are intrinsic features of immunoglobulin primary structure which should be accounted for in any proteomic analysis of antibody repertoire, regardless of species. To this end, we have demonstrated a strategy to reduce false discovery and improve the accuracy of antibody identification by shotgun proteomics through the use of high mass accuracy LC-MS/MS and high stringency filters applied to groups of peptide-spectral matches, rather than individual PSMs.
These findings highlight the importance of evaluating methods of data analysis when applied to nonstandard data sets. While we specifically addressed complications encountered in the analysis of antibodies, we would expect similar trends for any protein samples where many close variant sequences might be present, such as in samples assaying human genetic variants or large protein families with related sequences.
Acknowledgments
Funding for this work was provided by the Clayton Foundation (G.G.), Welch Foundation Grant F1515 (to E.M.M.), Defense Advanced Research Projects Agency (G.G.), Defense Threat Reduction Agency (G.G. and E.M.M.), and National Institutes of Health (NIH) Grants 5 RC1DA028779 (to G.G. via a subcontract from University of Chicago) and GM 076536 and DP1 OD009572 (to E.M.M.). J.J.L. was supported by a postdoctoral fellowship by Cancer Prevention and Research Institute of Texas. The Linear Trap Quadrupole (LTQ) Orbitrap Velos MS was purchased with generous support by the NIH Western Research Center of Excellence in Biodefense (NIH Grant 5U54AI057156) and the Texas Institute for Drug and Diagnostics Development (TI-3D).
Author Contributions
‡ D.R.B., A.P.H., and Y.W. contributed equally.
The authors declare the following competing financial interest(s): A patent application on this work has been filed. No other competing interests exist.
Notes
The mass spectrometry proteomics data have been deposited to the ProteomeXchange Consortium24 via the PRIDE partner repository, with dataset identifiers PXD000916 (Rabbit) and PXD000917 (Human).
Funding Statement
National Institutes of Health, United States
References
- Poulsen T. R.; Meijer P. J.; Jensen A.; Nielsen L. S.; Andersen P. S. J. Immunol 2007, 179, 3841–3850. [DOI] [PubMed] [Google Scholar]
- Glanville J.; Zhai W.; Berka J.; Telman D.; Huerta G.; Mehta G. R.; Ni I.; Mei L.; Sundar P. D.; Day G. M.; Cox D.; Rajpal A.; Pons J. Proc. Natl. Acad. Sci. U.S.A. 2009, 106, 20216–20221. [DOI] [PMC free article] [PubMed] [Google Scholar]
- Briney B. S.; Crowe J. E. Jr. Front. Immunol. 2013, 4, 42. [DOI] [PMC free article] [PubMed] [Google Scholar]
- Murphy K.; Travers P.; Walport M.; Janeway C.. Janeway′s immunobiology, 8th ed.; Garland Science: New York, 2012; p xix, 868 p. [Google Scholar]
- Tarlinton D.; Good-Jacobson K. Science 2013, 341, 1205–1211. [DOI] [PubMed] [Google Scholar]
- Weinstein J. A.; Jiang N.; White R. A. 3rd; Fisher D. S.; Quake S. R. Science 2009, 324, 807–810. [DOI] [PMC free article] [PubMed] [Google Scholar]
- Reddy S. T.; Ge X.; Miklos A. E.; Hughes R. A.; Kang S. H.; Hoi K. H.; Chrysostomou C.; Hunicke-Smith S. P.; Iverson B. L.; Tucker P. W.; Ellington A. D.; Georgiou G. Nat. Biotechnol. 2010, 28, 965–969. [DOI] [PubMed] [Google Scholar]
- Vollmers C.; Sit R. V.; Weinstein J. A.; Dekker C. L.; Quake S. R. Proc. Natl. Acad. Sci. U.S.A. 2013, 110, 13463–13468. [DOI] [PMC free article] [PubMed] [Google Scholar]
- Britanova O. V.; Putintseva E. V.; Shugay M.; Merzlyak E. M.; Turchaninova M. A.; Staroverov D. B.; Bolotin D. A.; Lukyanov S.; Bogdanova E. A.; Mamedov I. Z.; Lebedev Y. B.; Chudakov D. M. J. Immunol. 2014, 192, 2689–2698. [DOI] [PubMed] [Google Scholar]
- de Costa D.; Broodman I.; VanDuijn M. M.; Stingl C.; Dekker L. J. M.; Burgers P. C.; Hoogsteden H. C.; Smitt P. A. E. S.; van Klaveren R. J.; Luider T. M. J. Proteome Res. 2010, 9, 2937–2945. [DOI] [PubMed] [Google Scholar]
- Dekker L. J. M.; Zeneyedpour L.; Brouwer E.; van Duijn M. M.; Smitt P. A. E. S.; Luider T. M. Anal. Bioanal. Chem. 2011, 399, 1081–1091. [DOI] [PMC free article] [PubMed] [Google Scholar]
- Bandeira N.; Pham V.; Pevzner P.; Arnott D.; Lill J. R. Nat. Biotechnol. 2008, 26, 1336–1338. [DOI] [PMC free article] [PubMed] [Google Scholar]
- Wine Y.; Boutz D. R.; Lavinder J. J.; Miklos A. E.; Hughes R. A.; Hoi K. H.; Jung S. T.; Horton A. P.; Murrin E. M.; Ellington A. D.; Marcotte E. M.; Georgiou G. Proc. Natl. Acad. Sci. U.S.A. 2013, 110, 2993–2998. [DOI] [PMC free article] [PubMed] [Google Scholar]
- Cheung W. C.; Beausoleil S. A.; Zhang X.; Sato S.; Schieferl S. M.; Wieler J. S.; Beaudet J. G.; Ramenani R. K.; Popova L.; Comb M. J.; Rush J.; Polakiewicz R. D. Nat. Biotechnol. 2012, 30, 447–452. [DOI] [PubMed] [Google Scholar]
- Lavinder J. J.; Wine Y.; Giesecke C.; Ippolito G. C.; Horton A. P.; Lungu O. I.; Hoi K. H.; Dekosky B. J.; Murrin E. M.; Wirth M. M.; Ellington A. D.; Dorner T.; Marcotte E. M.; Boutz D. R.; Georgiou G. Proc. Natl. Acad. Sci. U.S.A. 2014, 111, 2259–2264. [DOI] [PMC free article] [PubMed] [Google Scholar]
- Sato S.; Beausoleil S. A.; Popova L.; Beaudet J. G.; Ramenani R. K.; Zhang X.; Wieler J. S.; Schieferl S. M.; Cheung W. C.; Polakiewicz R. D. Nat. Biotechnol. 2012, 30, 1039–1043. [DOI] [PubMed] [Google Scholar]
- Hale J. E.; Butler J. P.; Gelfanova V.; You J. S.; Knierman M. D. Anal. Biochem. 2004, 333, 174–181. [DOI] [PubMed] [Google Scholar]
- Kall L.; Canterbury J. D.; Weston J.; Noble W. S.; MacCoss M. J. Nat. Methods 2007, 4, 923–925. [DOI] [PubMed] [Google Scholar]
- Cox J.; Michalski A.; Mann M. J. Am. Soc. Mass Spectrom. 2011, 22, 1373–1380. [DOI] [PMC free article] [PubMed] [Google Scholar]
- DeKosky B. J.; Ippolito G. C.; Deschner R. P.; Lavinder J. J.; Wine Y.; Rawlings B. M.; Varadarajan N.; Giesecke C.; Dorner T.; Andrews S. F.; Wilson P. C.; Hunicke-Smith S. P.; Willson C. G.; Ellington A. D.; Georgiou G. Nat. Biotechnol. 2013, 31, 166–169. [DOI] [PMC free article] [PubMed] [Google Scholar]
- Marcotte E. M. Nat. Biotechnol. 2007, 25, 755–757. [DOI] [PubMed] [Google Scholar]
- Nesvizhskii A. I. J. Proteomics 2010, 73, 2092–2123. [DOI] [PMC free article] [PubMed] [Google Scholar]
- Elias J. E.; Gygi S. P. Nat. Methods 2007, 4, 207–214. [DOI] [PubMed] [Google Scholar]
- Vizcaíno J. A.; Deutsch E. W.; Wang R.; Csordas A.; Reisinger F.; Ríos D.; Dianes J. A.; Sun Z.; Farrah T.; Bandeira N.; Binz P. A.; Xenarios I.; Eisenacher M.; Mayer G.; Gatto L.; Campos A.; Chalkley R. J.; Kraus H. J.; Albar J. P.; Martinez-Bartolomé S.; Apweiler R.; Omenn G. S.; Martens L.; Jones A. R.; Hermjakob H. Nat. Biotechnol. 2014, 30, 223–226. [DOI] [PMC free article] [PubMed] [Google Scholar]


