Abstract
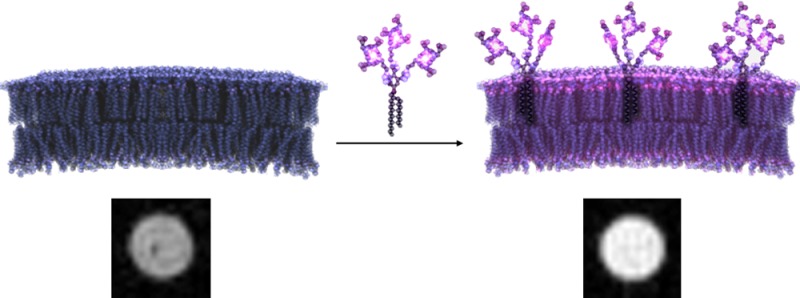
Cell tracking in vivo with MR imaging requires the development of contrast agents with increased sensitivity that effectively label and are retained by cells. Most clinically approved Gd(III)-based contrast agents require high incubation concentrations and prolonged incubation times for cellular internalization. Strategies to increase contrast agent permeability have included conjugating Gd(III) complexes to cell penetrating peptides, nanoparticles, and small molecules which have greatly improved cell labeling but have not resulted in improved cellular retention. To overcome these challenges, we have synthesized a series of lipophilic Gd(III)-based MR contrast agents that label cell membranes in vitro. Two of the agents were synthesized with a multiplexing strategy to contain three Gd(III) chelates (1 and 2) while the third contains a single Gd(III) chelate (3). These new agents exhibit significantly enhanced labeling and retention in HeLa and MDA-MB-231-mcherry cells compared to agents that are internalized by cells (4 and Prohance).
Introduction
The ability to track cells in vivo will facilitate applications such as detection of tissue rejection,1 fate mapping of transplanted stem cells,2−4 and early detection of cancer.5 MR imaging is ideally suited for long-term cell tracking since it is noninvasive, possesses high spatial resolution and unlimited penetration depth, and provides tomographic information without the use of ionizing radiation.6 Intrinsic MR image contrast is enhanced using paramagnetic contrast agents, typically iron oxide nanoparticles or Gd(III) complexes.7 Iron oxide nanoparticles generate contrast by reducing the transverse relaxation time (T2) of surrounding water protons thereby producing negative (dark) image contrast. Gd(III) contrast agents decrease the proton spin–lattice relaxation time (T1) of surrounding water protons and generate positive (bright) image contrast.8 Few examples of cell tracking with Gd(III) contrast agents exist in the literature because these agents usually efflux rapidly from cells prohibiting long-term imaging studies.2,9−11
For long-term imaging and tracking of cells using Gd(III)-based contrast agents it is necessary to develop probes that effectively label and are retained by cells. Clinically approved Gd(III)-based MR agents (such as Magnevist and Prohance) are largely confined to the extracellular space and require high incubation concentrations and long incubation times for cellular internalization. Attempts to increase agent permeability have included conjugating Gd(III) complexes to cell penetrating peptides,12−15 nanoparticles,16−18 polymers,2 and small molecules.9 While these labeling strategies improve agent uptake, rapid cellular efflux leads to significant reduction of intracellular Gd(III) resulting in decreased MR image contrast, thereby prohibiting long-term longitudinal imaging studies.9 Furthermore, internalized agents are typically compartmentalized in endosomes that can lead to relaxivity quenching and contrast agent degradation.19,20
Our strategy to overcome these challenges is the development of cell membrane-anchored contrast agents that label cells without the need for cellular internalization. Li et al. reported a membrane-anchored MR contrast agent that labels cell at low incubation concentrations with long-term imaging potential.21 Their strategy (modeled after lipophilic fluorescent dyes such as DiI and DiO) involves conjugating alkyl chains to a Gd(III) complex to serve as anchors in the cell membrane. Several alternative strategies for synthesizing lipophilic contrast agents with alkyl chains have been developed; however, these agents have only been used to investigate relaxometric properties and have not been tested in vitro.22−27
We propose the further development of lipophilic MR contrast agents using multimeric cyclen-based chelates to increase Gd(III) payload and therefore amplify MR signal. We have previously reported the synthesis of a multimeric MR contrast agent that uses copper(I)-catalyzed azide alkyne cycloaddition (CuAAC) “click” chemistry to attach azide modified chelates to an alkyne modified scaffold.28 This strategy generates rigid triazole linkages that have been shown to hinder the local rotation of Gd(III) complexes and enhance relaxivity.29 Herein, we modify this scaffold to include lipophilic alkyl chains to generate a series of contrast agents that label the cell membrane with increased labeling efficiency, retention, and MR image contrast compared to nonlipophilic monomeric Gd(III) contrast agents (Prohance and an azide-modified Gd(III) complex, 4).
Results and Discussion
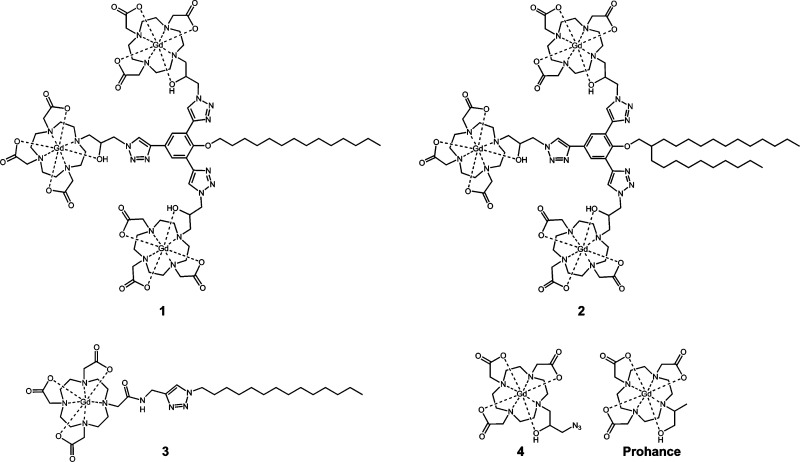
Previously, we have described a strategy to generate high-relaxivity, multimeric MR contrast agents with “click” chemistry using a phenol-based scaffold functionalized with three alkyne groups.28 The resultant agents are synthesized from this scaffold by attaching an azide modified Gd(III) complex (4) where the observed relaxivity increases 5-fold when attached to the scaffold. Here, we describe conjugating alky chains to this scaffold to generate cell membrane-anchored MR contrast agents (Figure 1).
Figure 1.
Three lipophilic and two nonlipophilic contrast agents are described. 1 and 2 are multimeric MR contrast agents that contain three Gd(III) chelates while 3, 4, and Prohance are monomeric complexes. 4 and Prohance were selected as controls because they accumulate in the cytosol whereas the lipophilic agents label the cell membrane.
Synthesis and Characterization of Multimeric Complexes
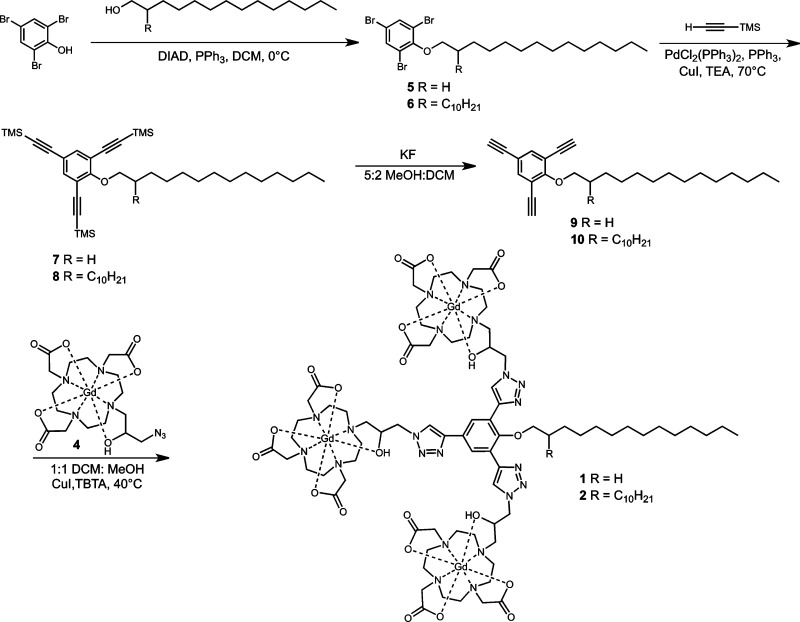
Multimeric lipophilic agents were synthesized according to Scheme 1. Alkyl chains were attached to 2,4,6-tribromophenol via a Mitsunobu reaction followed by a Sonogashira reaction to introduce the TMS-protected alkyne groups. TMS deprotection was carried out using potassium fluoride and the final product was obtained by conjugating 4 onto the scaffold via “click” chemistry in 1:1 DCM:MeOH with CuI and TBTA. Two complexes were synthesized using this procedure: the first with a 14 carbon single alkyl chain (1) and the second with two alkyl chains of 10 and 14 carbon units (2).
Scheme 1. Synthesis of Multimeric Lipophilic Contrast Agents That Contain a Single or Double Alkyl Chain.
Agents were synthesized with “click” chemistry and contain three Gd(III) chelates. The resultant complexes have limited water solubility and were solubilized in 4 mM cholate.
The resultant agents have limited water solubility prohibiting accurate relaxivity measurements. Therefore, 1 and 2 were solubilized in the detergent sodium cholate hydrate (4 mM) to increase solubility 25-fold from 28 μM (in 10% DMSO) to 700 μM. Relaxivity was measured in 4 mM cholate at 1.41 and 7 T, where the ionic relaxivities (r1) of 1 and 2 were 16.5 ± 0.1 mM–1 s–1 and 17.4 ± 1.3 mM–1 s–1 at 1.41 T, respectively (Table 1), and decrease to 4.00 ± 0.15 mM–1 s–1 for 1 and 4.86 ± 0.19 mM–1 s–1 for 2 at 7 T (Table S1). These relaxivities are consistent with those obtained from a previously reported contrast agent that was synthesized from a similar scaffold (15.4 ± 0.8 mM–1 s–1 at 1.41 T).28
Table 1. Ionic Relaxivities of 1–4 and Prohance at 1.41 T and 37 °C in Water and 4 mM Cholate Show That Use of Cholate as a Solubilizing Agent Does Not Significantly Impact Relaxivity.
| r1 in watera (mM–1 s–1), | r1 in 4 mM cholate (mM–1 s–1) | r2 in watera (mM–1 s–1), | r2 in 4 mM cholate (mM–1 s–1) | r2/r1 in water | r2/r1 in cholate | |
|---|---|---|---|---|---|---|
| 1 | ND | 16.5 ± 0.1 | ND | 26.5 ± 0.3 | ND | 1.61 |
| 2 | ND | 17.4 ± 1.3 | ND | 30.4 ± 1.4 | ND | 1.75 |
| 3 | 17.6 ± 0.7 | 16.4 ± 2.9 | 21.8 ± 0.7 | 18.4 ± 2.7 | 1.24 | 1.21 |
| 4 | 2.98 ± 0.07 | 2.97 ± 0.31 | 3.56 ± 0.05 | 3.50 ± 0.61 | 1.19 | 1.18 |
| Prohance | 2.60 ± 0.08 | 2.61 ± 0.16 | 2.86 ± 0.08 | 2.98 ± 0.25 | 0.96 | 1.00 |
Complexes 1 and 2 are not water-soluble. ND= Not Determined.
Synthesis and Characterization of Water-Soluble Lipophilic Complex
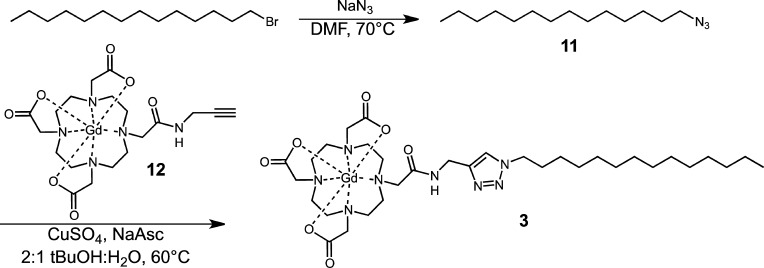
To increase water solubility we prepared a monomeric lipophilic contrast agent (Scheme 2). Specifically, 1-azidotetradecane was reacted with an alkyne modified chelate (12) in 2:1 tBuOH:H2O with CuSO4 and sodium ascorbate to afford the final product (3).
Scheme 2. Synthesis of Monomeric Lipophilic Contrast Agent 3 Prepared with “Click”Chemistry.
The agent is soluble in water and 4 mM cholate.
The relaxivity of the resultant agent was measured in water (17.6 ± 0.7 mM–1 s–1 at 1.41 T, 4.32 ± 0.10 mM–1 s–1 at 7 T) and 4 mM cholate (16.4 ± 2.9 7 mM–1 s–1 at 1.41 T, 5.57 ± 0.12 mM–1 s–1 at 7 T) (Table 1, Table S1). These values are approximately 6-fold higher at 1.41 T and 2-fold higher at 7 T than the relaxivity of 12 which can be attributed to contrast agent aggregation.29
Lipophilic Contrast Agents Form Micelles and Liposomes in Solution
The extent of agent aggregation and the effect of cholate on micelle formation were determined using dynamic light scattering (DLS). The data show that under the conditions measured complexes 1, 2, and 3 form micelles with a size distribution of 6 ± 3 nm. Additionally, 1 and 2 form a marginal population (≪0.1%) of liposomes 50–200 nm in size (Table 2). Conversely, the control solutions of water, 4 mM cholate, 4 in water and cholate, and Prohance in water and cholate do not form light-scattering structures (Figure S22B). These data suggest that the use of cholate (required for solubilization of 1 and 2) does not significantly alter micelle formation or size distribution.
Table 2. Summary of DLS Size Measurementsa.
| 1 (cholate) | 2 (cholate) | 3 (cholate) | 3 (water) | |
|---|---|---|---|---|
| Cumulant Analysis | ||||
| Z-averageb (nm) | 49.9 ± 1.5d | 82.3 ± 2.6d | 5.8 ± 0.3 | 7.1 ± 0.2 |
| PDI | 0.67 ± 0.02 | 0.41 ± 0.07 | 0.25 ± 0.03 | 0.29 ± 0.01 |
| Distribution Analysis | ||||
| Peak 1 (nm)c | 5.9 ± 2.4 | 6.0 ± 1.6 | 6.1 ± 2.5 | 6.7 ± 2.0 |
| Peak 2 (nm)c | 117 ± 69 | 133 ± 66 | - | - |
Data was analyzed by autocorrelation as fitted by cumulant and distribution analysis for 1–3 (see Supporting Information for a more detailed description of the fitting).
± represents standard deviation of z-average and reflects reproducibility of the fit (N = 3).
± represents standard deviation of size distribution based on intensity and reflects variance in size (N = 3).
Low expected accuracy due to poor fitting.
Cell Labeling and Toxicity of Lipophilic Contrast Agents
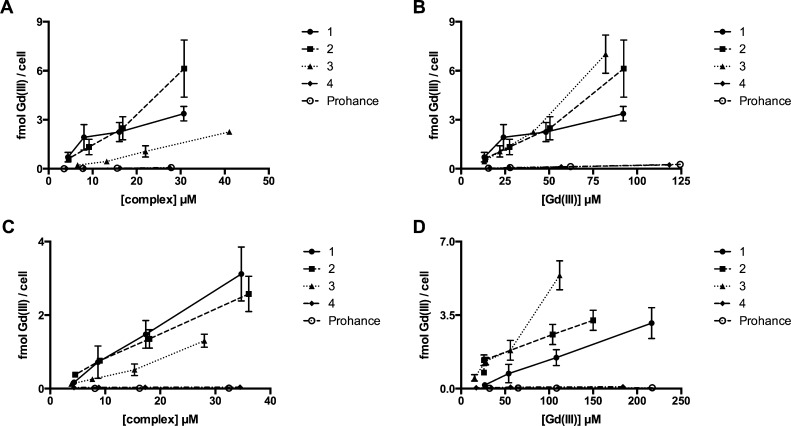
In order to optimize cell labeling, the incubation conditions of 1–4 and Prohance in HeLa cells were determined by quantifying toxicity (Figure S30, Table S2, Figure S31, Figure S32), nonspecific binding (Figure S33), and the effects of cholate (Figure S34, Figure S35) and incubation time on cell labeling (Figure S36). Based on these data, all incubations were prepared in 0.4 mM cholate for 24 h at concentrations of 1–4 and Prohance that maintain ≥90% cell viability. Concentration-dependent cell labeling was determined by two approaches: normalizing contrast agent or Gd(III) incubation concentrations. Data from studies where agent incubation concentration was normalized show that multiplexed agents (1 and 2) have increased cell labeling compared to the monomeric contrast agent (3) (Figure 2A).
Figure 2.
Concentration-dependent cell labeling for 1–4 and Prohance. HeLa cells incubated with normalized contrast agent (A) or normalized Gd(III) concentrations (B) for 24 h. MDA-MB-231-mcherry cells incubated with normalized contrast agent (C) or normalized Gd(III) concentrations (D) for 24 h. Error bars represent ± standard deviation of the mean of triplicate samples.
Specifically, HeLa cells incubated with 1 and 2 exhibited a 1.5-fold and 2.7-fold increase in cell labeling, respectively, compared to 3. The labeling of lipophilic 1, 2, and 3 is 48-, 88-, and 32-fold higher, respectively, than nonlipophilic 4 and Prohance. Interestingly, data from studies where Gd(III) incubation concentration is normalized (i.e., 3, 4, and Prohance are present at 3× the agent concentration of 1 and 2) show that at high incubation concentrations ([Gd(III)] > 75 μM) complexes 2 and 3 label cells approximately 2-fold more effectively than 1 (∼6 fmol Gd(III)/cell versus ∼3 fmol Gd(III)/cell, Figure 2B). This is likely due to the two alkyl chains present on 2 increasing cell membrane affinity (compared to one alkyl chain for 1), whereas the increased labeling of 3 is likely due to higher packing density in the cell membrane since 3 has less steric bulk than multimeric 1 and 2.
To ensure that cell labeling is independent of cell line selection, agent labeling was determined using MDA-MB-231-mcherry cells at both normalized agent and Gd(III) incubation concentrations (Figure 2C and D). Multimeric 1 and 2 showed a 2.3- and 2.4-fold reduction in Gd(III) per cell, respectively, compared to the values measured in HeLa cells. 3 showed the same Gd(III) per cell in both cell lines suggesting it may be a more universal cell labeling agent.
MR Imaging of Cells Labeled with Lipophilic Contrast Agents
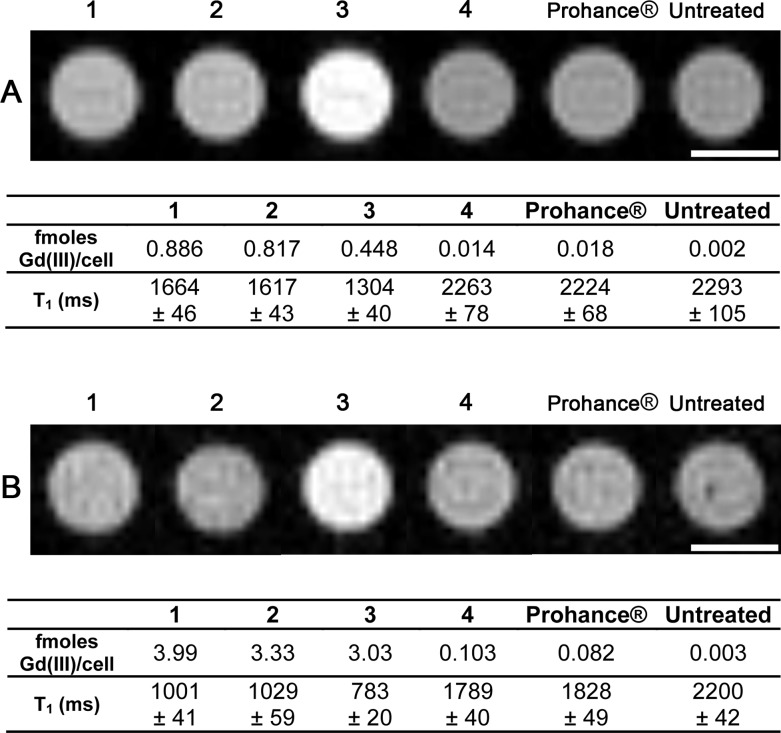
To evaluate contrast enhancement of HeLa cells labeled with lipophilic contrast agents 1–3, MR images of cell pellets were acquired at 7 T. HeLa cells were incubated with either 20 μM contrast agent (Figure 3A) or 90 μM normalized Gd(III) (Figure 3B). For both studies, lipophilic complexes 1–3 reduced the T1 relaxation time (and thereby increased MR image contrast) compared to untreated cells more effectively than 4 or Prohance.
Figure 3.
T1-weighted cell pellet images of HeLa cells incubated with 1–4 and Prohance acquired at 7 T. A: Probe concentration was equalized at 20 μM. B: Gd(III) concentration was equalized at 90 μM. For both images TE = 11 ms, TR = 500 ms, MTX = 256 × 256, and slice thickness is 1.0 mm. Scale bars represent 1 mm. Error represents ±1 standard deviation of the mean of four 1-mm slices. These images show that 3 produces the most significant contrast enhancement compared to untreated cells.
Interestingly, complex 3 produced the greatest reduction in T1 relaxation time and therefore the highest image contrast for both studies (Figure 3, T2 data is in Figure S32). Since the Gd(III) concentration per cell is lower for 3 in both experiments, the enhanced image contrast observed is likely due to increased relaxivity when embedded in the cell membrane or 1 and 2 being limited as T1 contrast agents by their higher r2/r1 ratios (approximately 2.8-fold higher than 3 at 7 T, Table S1).
Lipophilic Contrast Agents Localized in the Cell Membrane
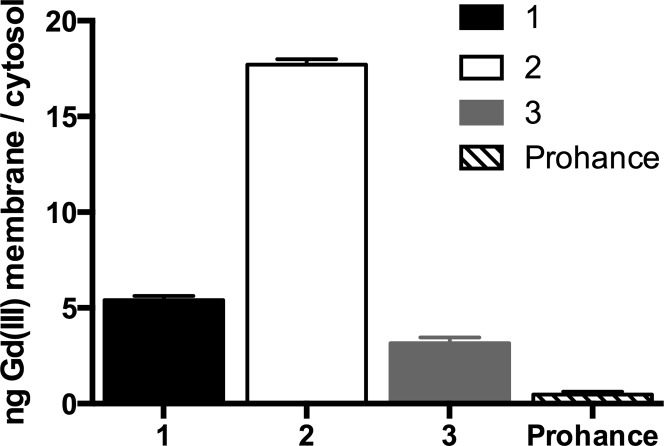
To examine the cellular distribution of lipophilic 1–3 and Prohance, HeLa cells were incubated with varying concentrations of each agent (concentrations were chosen to normalize Gd(III) labeling) and were subjected to a cell fractionation kit. The membrane and internalized (cytosol + endosomes) fractions were collected and analyzed for Gd(III) content by ICP-MS. 2 (possessing two alkyl chains) displayed the highest membrane affinity with 18-fold increased Gd(III) present in the membrane compared to the internalized fraction (Figure 4).
Figure 4.
Localization of contrast agents determined by cell fractionation. The internalized (cytosol + endosomes) and membrane fraction were analyzed by ICP-MS for Gd(III) content. All lipophilic complexes show higher membrane accumulation than Prohance with 2 having the greatest membrane localization. Error bars represent ± standard deviation of the mean of triplicate samples.
1 and 3, with single alkyl chains, contained 5.4- and 3.2-fold more Gd(III) in the membrane, respectively. The only complex internalized into cells was Prohance. Since the lipophilic complexes preferentially label cell membranes, we tested whether this membrane anchoring translated to long-term Gd(III) retention compared to internalized contrast agents.
Cellular Proliferation and Retention of Lipophilic Agents
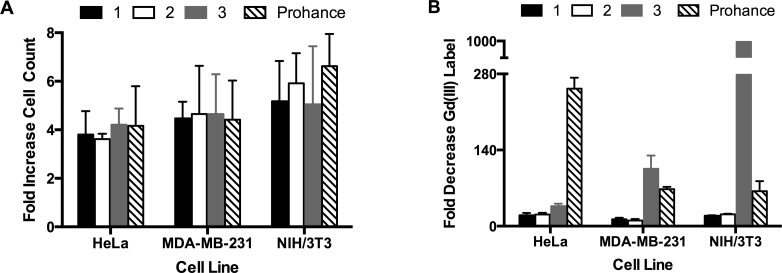
Cellular proliferation and retention of the agents was investigated by incubating HeLa, MDA, MB-213-mcherry, and NIH/3T3 cells with varying concentrations of 1–3 and Prohance (normalizing Gd(III) per cell). Following incubation, labeled cells were replaced in contrast agent free media (time = 0) and allowed to proliferate for 72 h (media was replaced every 24 h). Cell count and Gd(III) content was determined at time = 0 and 72 h. Cells incubated with the lipophilic contrast agents showed similar proliferative ability compared to cells incubated with Prohance (Figure 5A).
Figure 5.
Cellular proliferation and retention of contrast agents 1–3 and Prohance after 72 h of leaching in HeLa, MDA-MB-231-mcherry, and NIH/3T3 cell lines. A: Cellular proliferation was determined by calculating the fold difference in cell count at t = 0 and 72 h. The data show that proliferation is not affected by labeling with lipophilic contrast agents. B: Cellular retention was determined by calculating the fold change in Gd(III) per cell at t = 72 and 0 h. The data show that, while retention is influenced by cell line selection, 1 and 2 have consistently enhanced retention compared to 3 and Prohance.
Cellular retention of the contrast agents was determined by calculating the fold change in cellular Gd(III) content between time = 0 and 72 h. Complexes 1 and 2 showed similar retention in all cell lines with 10–20-fold of the label diluted after 72 h (Figure 5B). These retention values represent a 10-, 6-, and 3.2-fold improvement over the retention of Prohance in HeLa, MDA-MB-231-mcherry, and NIH/3T3 cells, respectively. The cellular retention of 3 was highly cell line dependent with 36-fold of the label diluted in HeLa cells, 105-fold in MDA-MB-231-mcherry cells, and 1000-fold in NIH/3T3 cells. In all cases, these values represent lower cellular retention compared to multimeric 1 and 2 indicating that the increased water solubility of 3 may reduce contrast agent retention.
Surprisingly, the retention of 3 in MDA-MB-231-mcherry and NIH/3T3 cells is lower than that of Prohance suggesting that 3 may not be ideal for long-term cell tracking studies. These results demonstrate the cell line dependence of cellular retention and show that this property must be measured in any new cell line before long-term cell tracking experiments are performed.
Conclusions
We have developed a series of lipophilic MRI contrast agents that efficiently label cell membranes in vitro. Two multimeric agents were synthesized to increase Gd(III) payload per complex (1 and 2). These agents were found to be insoluble in water, which necessitated the use of cholate (a detergent) for solubilizaion to allow biological testing. In order to overcome solubility constraints, a water-soluble lipophilic contrast agent was synthesized using a single Gd(III) chelate (3).
All three lipophilic contrast agents showed increased labeling in HeLa and MDA-MB-231-mcherry cells compared to contrast agents that are internalized by cells (4 and Prohance) without significantly affecting cell viability or proliferation. In studies where contrast agent incubation concentrations were normalized, 1 and 2 effectively delivered the most Gd(III) to cells; however, in studies where Gd(III) incubation concentrations were normalized 2 and 3 were the most effective agents. Additionally, at 7 T cells incubated with 3 show the greatest reduction in T1 and therefore the most significant contrast enhancement at both normalized contrast agent and Gd(III) incubation concentrations. The surprising efficacy of 3 is attributed to higher packing in the cell membrane since it has less steric bulk than 1 and 2. Multimeric 1 and 2 had significantly enhanced cellular retention compared to Prohance in HeLa, MDA-MB-231-mcherry, and NIH/3T3 cells. Complex 3 showed decreased cellular retention compared to Prohance in MDA-MB-231 and NIH/3T3 cells, which will likely minimize its utility as a long-term cell tracking agent. Future work on this design will include modifying the aliphatic chain length and branching to increase complex hydrophobicity which should translate to improved cellular retention without sacrificing the significant contrast enhancement produced at high field strengths.
The high cell labeling and retention of complex 2 may be well suited for in vivo applications such as fate mapping and stem cell tracking that will require highly efficient membrane-anchored contrast agents to combat the decrease in MR image contrast that arises from agent efflux and endosomal entrapment of intracellular contrast agents.
Materials and Methods
Synthetic Methods
Unless noted, materials and solvents were purchased from Sigma-Aldrich Chemical Co. (St. Louis, MO, USA) and used without further purification. All reactions were performed under an inert nitrogen atmosphere. Acetonitrile, triethylamine, and dichloromethane were purified using a Glass Contour solvent system. Deionized water was obtained from a Millipore Q-Guard System equipped with a quantum Ex cartridge (Billerica, MA, USA). Thin layer chromatography (TLC) was performed on EMD 60F 254 silica plates and stained either with iodine or with UV light. Standard grade 60 Å 230–400 mesh silica gel (Sorbent Technologies, Norcross, GA, USA) was used for flash chromatography. 1H and 13C NMR spectra were obtained on a Bruker 500 MHz Avance III NMR spectrometer (Billerica, MA, USA). Electrospray ionization mass spectroscopy (ESI-MS) spectra were taken on a Varian 1200 L single quadrupole mass spectrometer Agilent Technologies, Santa Clara, CA, USA). Matrix assisted laser desorption ionization mass spectroscopy (MALDI-MS) were aquired on a Bruker Autoflex III MALDI. Analytical reverse-phase HPLC-MS was performed on an Agilent 1200 series system (Agilent Technologies, Santa Clara, CA, USA) using a Phenomenex (Torrance, CA, USA) Luna C8 column (4.6 × 50, 5 μm). This system is equipped with an Agilent G1315C DAD detector and an Agilent 6130 quadrupole MS detector (Agilent Technologies, Santa Clara, CA, USA). Preparative runs were performed on a Phenomenex (Torrance, CA, USA) Luna C8 column (21.20 × 150, 5 μm) with a mobile phase of water (A) and HPLC-grade acetonitrile (B).
Azide modified Gd(III)-chelate (4),28 1-azidotetradecane (11),30 and alkyne modified Gd(III)-chelate (12)29 were synthesized according to literature procedures.
(5) 1,3,5-Tribromo-2-(tetradecyloxy)benzene
To a solution of tribromophenol (0.8980 g, 2.721 mmol) in DCM (18 mL) was added 1-tetradecanol (0.5953 g, 2.777 mmol) and PPh3 (1.0781 g, 4.115 mmol). The reaction was placed under a nitrogen atmosphere and cooled to 0 °C. DIAD (0.80 mL, 4.067 mmol) was added dropwise over 2 min. The solution became yellow during the addition and a yellow suspension formed while the reaction was stirred at 0 °C over 15 min. The reaction was removed from the ice-bath and allowed to warm to room temperature. The reaction was stirred for 12 h and concentrated in vacuo. The residue was purified by flash column chromatography on silica gel (hexanes) and the product was isolated as a white solid (1.1611 g, 81%). 1H NMR (500 MHz, CDCl3) δ 7.64 (s, 2H, -CHar–CBr–CHar-), 3.97 (t, J = 6.6 Hz, 2H, -OCH2-), 1.85 (dt, J = 14.9, 6.7 Hz, 2H, -OCHH2-CH2-), 1.51 (p, J = 7.3 Hz, 2H, -OCHH2–CH2–CH2-), 1.40–1.22 (m, 20H, -CH2–(CH2)10–CH3), 0.88 (t, J = 6.9 Hz, 3H, -(CH2)13-CH3). 13C NMR (126 MHz, CDCl3) δ 153.06 (CarH–OCHH2), 134.98 (CarH–CBr–CarH), 119.13 (CarBr–Car–CarBr), 117.11 (CarH–CarBr–CarH-), 73.77 (-OCH2-), 31.96 (-CH2–CH2–CH3), 30.00 (CH2–(CH2)2–CH3), 29.70 ((CH2)7-(CH2)3-CH3), 29.41 (-OCH2–CH2), 25.86 (-OCH2–CH2–CH2-), 22.74 (CH2–CH3), 14.18 (CH2–CH3).
(6) 1,3,5-Tribromo-2-((2-decyltetradecyl)oxy)benzene
To a solution of tribromophenol (1.0239 g, 3.102 mmol) in DCM (18 mL) was added 2-decyltetradecan-1-ol (1.3 mL, 3.085 mmol) and PPh3 (1.2194 g, 4.654 mmol). The reaction was placed under an inert nitrogen atmosphere and cooled to 0 °C. DIAD (0.90 mL, 4.576 mmol) was added dropwise over 2 min. The solution became yellow during the addition and a yellow suspension formed while the reaction was stirred at 0 °C over 15 min. The reaction was removed from the ice-bath and allowed to warm to room temperature. The reaction was stirred for 12 h and concentrated in vacuo. The residue was purified by flash-column chromatography on silica gel (hexanes) and the product was isolated as a clear oil (1.6878 g, 82%). 1H NMR (500 MHz, CDCl3) δ 7.63 (s, 2H, -CHar–Car–CHar-), 3.86 (d, 2H, J = 5.7 Hz, -OCHH2-), 1.83–1.89 (m, 1H, OCH2-CH-), 1.52–1.56 (m, 4H, CH2–CH–CH2-), 1.34–1.46 (m, 6H, CH2–CH2–CH–CH2–(CH2)2-), 1.22–1.45 (m, 30H, CH3–(CH2)6–(CH2)3–CH–(CH2)2–(CH2)9-), 0.89 (t, 6H, J = 6.9 Hz, 2 CH3). 13C NMR (126 MHz, CDCl3) δ 153.20 (-CarOCH2-), 135.16 (-CarH–CBr–CarH-), 119.26 (-CarBr–Car–CarBr-), 117.16 (-CarH–CarBr–CarH-), 76.42 (-OCH2-), 39.14 (-OCH2–CH-), 32.12 (2 CH2–CH2–CH3), 31.16 (2 -CH–CH2-), 30.20 (2 -CH–(CH2)2–CH2-), 29.87 ((CH2)5-(CH2)3-CH3 and ((CH2)3-(CH2)3-CH3), 29.56 (2 CH2-(CH2)2-CH3), 27.10 (2 CH–CH2–CH2-), 22.89 (2 CH2–CH3), 14.32 (2 -CH3).
(7) ((2-(Tetradecyloxy)benzene-1,3,5-triyl)tris(ethyne-2,1-diyl))tris(trimethylsilane)
To a flame-dried flask was added PPh3 (0.1836 g, 0.7007 mmol) and CuI (0.0882 g, 0.4631 mmol). Triethylamine (30 mL) was used to dissolve 5 (1.1611 g, 2.203 mmol) and the resulting solution was added to the reaction flask. Nitrogen gas was bubbled through the reaction for 5 min. Trimethylsilyl acetylene (3.1 mL, 22.08 mmol) was added and nitrogen gas was again bubbled through the reaction for 5 min. PdCl2(PPh3)2 (0.1567 g, 0.2232 mmol) was added to the reaction and left under nitrogen at 70 °C for 18 h. The mixture was concentrated in vacuo and filtered with hexanes. The resulting orange residue was purified by flash-column chromatography on silica gel (50:1 hexanes:ethyl acetate) and the product was isolated as an orange oil (0.8214 g, 64%). 1H NMR (500 MHz, CDCl3) δ 7.26 (s, 2H, -CHar–CBr–CHar-), 4.01 (t, J = 6.5 Hz, 2H, -OCH2-), 1.63–1.52 (m, 2H, -OCHH2-CH2-) 1.33–1.24 (m, 2H, -OCHH2–CH2–CH2-), 1.19–0.98 (m, 20H, -CH2–(CH2)10–CH3), 0.67 (t, J = 6.9 Hz, 3H, -(CH2)13-CH3), 0.02 (s, 27H, -Si(CH3)3). 13C NMR (126 MHz, CDCl3) δ 162.09 (-CarOCH2-), 137.47 (-CarH–Car–CarH-), 133.82 (-C-Si-(CH3)3), 128.63 (-C-Si-(CH3)3), 118.32 (-C-Si-(CH3)3), 117.78 (Car–CarO–Car-), 103.16 (CarH-Car-CarH-), 100.11 (CalkyneC–Si–(CH3)3), 99.69 (CalkyneC–Si–(CH3)3), 94.51 (CalkyneC–Si–(CH3)3), 74.52 (-OCH2-), 32.11 (−CH2–CH2–CH3), 30.58 (CH2–(CH2)2–CH3), 29.86 ((CH2)7-(CH2)3-CH3), 29.55 (-OCH2–CH2-), 26.25 (-OCH2–CH2–CH2-), 22.88 (-CH2–CH3), 14.33 (CH3), 0.06 (3 -Si-(CH3)3). ESI-MS m/z [M + Na]+ calcd. for C35H58OSi3Na 601.4; observed 601.4.
(8) ((2-((2-Decyltetradecyl)oxy)benzene-1,3,5-triyl)tris(ethyne-2,1-diyl))tris(trimethylsilane)
To a flame-dried flask was added PPh3 (0.2091 g, 0.7981 mmol) and CuI (0.1026 g, 0.5388 mmol). Triethylamine (30 mL) was used to dissolve 6 (1.6878 g, 2.530 mmol) and the resulting solution was added to the reaction flask. Nitrogen gas was bubbled through the reaction for 5 min. Trimethylsilyl acetylene (3.5 mL, 26.27 mmol) was added and nitrogen gas was bubbled through the reaction for 5 min. PdCl2(PPh3)2 (0.1803 g, 0.2569 mmol) was added to the reaction and it was left under nitrogen at 70 °C for 18 h. The mixture was concentrated in vacuo and filtered with hexanes. The resulting orange residue was purified by flash-column chromatography on silica gel (35:1 hexanes:ethyl acetate) and the product was isolated as an orange oil (1.6686 g, 92%). 1H NMR (CDCl3, 500 MHz) δ 7.28 (s, 2H, -CHar–Car–CHar-), 4.00 (d, 2H, J = 5.7 Hz, -OCHH2-), 1.31–1.39 (m, 5H, CH2-CH–CH2-), 1.15–1.23 (m, 6H, CH2–CH2–CH–CH2–(CH2)2-)), 1.06 (s, 30H, -(CH2)9-CH3, -(CH2)6-CH3), 0.69 (t, 6H, J = 6.9 Hz, 2 CH3), 0.04 (s, 27H, 3 -Si-(CH3)3). 13C NMR (125 MHz, CdCl3) δ 162.21 (-CarOCH2-), 137.84 (-CarH-Car-CarH-), 117.76 (-C-Si-(CH3)3), 116.19 (-C-Si-(CH3)3), 103.18 (-Car-CarO,Car-), 100.42 (CarH-Car-CarH-), 99.64 (CalkyneC-Si-(CH3)3), 94.30 (-C-Si-(CH3)3), 88.10 64 (-CalkyneC-Si-(CH3)3), 86.08 (-CalkyneC-Si-(CH3)3), 39.37 (−-CH2–CH2-), 32.10 (2 -CH2–CH2–CH3), 31.18 (-CH2–CH–CH2-), 30.28 (2 -CH-(CH2)2CH2-), 29.87 ((CH2)3-(CH2)3-CH-(CH2)3-(CH2)5-), 29.54 (2 -CH2-(CH2)2-CH3), 27.16 (2 -CH-(CH2)2-CH2-), 22.87 (2 -CH2–CH3) 0.00 (3 -Si-(CH3)3). ESI-MS m/z [M + Na]+ calcd. for C45H78OSi3Na 741.5; observed 741.6.
(9) 1,3,5-Triethynyl-2-(tetradecyloxy)benzene
To a solution of 7 (0.8214 g, 1.419 mmol) in DCM:methanol (50 mL DCM, 20 mL methanol) was added KF (1.0214 g, 17.58 mmol) and the mixture was stirred for 24 h at 30 °C. The mixture was concentrated in vacuo, taken up in water, and extracted with diethyl ether (30 mL × 3). The organic layer was dried with MgSO4 and concentrated in vacuo. The mixture was purified by flash-column chromatography on silica gel (19:1 hexanes:ethyl acetate) to give the product as an orange solid (0.4112 g, 80%). 1H NMR (CDCl3, 500 MHz,) δ 7.55 (s, 2H, -CHar–Car–CHar-), 4.24 (t, J = 6.6 Hz, 2H, -OCH2-), 3.27 (s, 2H, 2 CHalkyne), 3.03 (s, 1H, CHalkyne), 1.80 (dt, J = 14.7, 6.7 Hz, 2H, -OCHH2–CH2-), 1.52–1.43 (m, 2H, -OCHH2–CH2–CH2-), 1.40–1.21 (m, 20H, -OCHH2–(CH2)2–(CH2)10-), 0.88 (t, J = 6.9 Hz, 3H, −CH3). 13C NMR (126 MHz, CDCl3) δ 162.59 (-CarOCH2-), 138.12 (-CarH-Car-CarH-), 117.30 (Car-CCHalkyne), 116.95 (Car-CarO-Car-), 82.34 (2 -C-CHalkyne), 81.39 (-C-CHalkyne), 78.60 (2 -C-CHalkyne), 77.62 (-C–CHalkyne), 74.70 (-OCH2-), 31.92 (-CH2–CH2–CH3), 30.20 (-CH2-(CH2)2-CH3), 29.69 (-(CH2)7-(CH2)3-CH3), 29.40 (-OCH2–CH2-), 25.82 (-OCH2–CH2–CH2-), 22.70 (-CH2–CH3), 14.14 (CH3). ESI-MS m/z [M + H]+ calcd. for C26H36O 363.3; observed 363.3.
(10) 2-((2-Decyltetradecyl)oxy)-1,3,5-triethynylbenzene
To a solution of 8 (1.6686 g, 2.323 mmol) in DCM:methanol (50 mL DCM, 20 mL methanol) was added KF (1.8041 g, 31.05 mmol) and the mixture was stirred 24 h at 30 °C. The mixture was concentrated in vacuo, brought up in water, and extracted with diethyl ether (30 mL × 3). The organic layer was dried with MgSO4 and concentrated in vacuo. The mixture was purified by flash-column chromatography on silica gel (19:1 hexanes:ethyl acetate) to give the product as an orange oil (0.8928 g, 77%). 1H NMR (500 MHz, CDCl3) δ 7.55 (s, 2H, -CHar-Car-CHar-), 4.15 (d, J = 5.4 Hz, 2H, -OCHH2-), 3.25 (s, 2H, 2 CHalkyne), 3.03 (s, 1H, CHalkyne), 1.72–1.79 (m, 1H, -OCHH2–CH-), 1.50–1.58 (m, 6H, -CH2–CH2–CH–CH2–(CH2)2-), 1.26–1.40 (m, 34H, -CH–CH2–CH2–(CH2)9, -CH–CH2–(CH2)2–(CH2)6-), 0.88 (t, J = 6.9 Hz, 6H, 2 CH3). 13C NMR (126 MHz, CDCl3) δ 162.95 (-CarOCH2-), 138.39 (-CarH-Car-CarH-), 117.24 (-Car-CCHalkyne), 116.86 (Car-CarO-Car-), 82.51 (2 -C-CHalkyne), 81.58 (-C-CHalkyne), 78.92 (2 -C-CHalkyne), 77.70 (-C–CHalkyne), 77.26 (-OCH2-), 39.25 (-OCH2–CH-), 32.09 (2 CH2–CH2–CH3), 31.20 (2 -CH-CH2-), 30.19 (2 -CH-(CH2)2-CH2-), 29.86 (-(CH2)5-(CH2)3-CH3, -(CH2)3-(CH2)3-CH3), 29.53 (2 -CH2–(CH2)2–CH3), 27.09 (2 -CH–CH2–CH2-), 22.86 (2 -CH2–CH3), 14.30 (2 CH3). ESI-MS m/z [M + H]+ calcd. for C36H55O 503.4, observed 503.4.
(1) 5-(2,4,6-Tris(1-(2-hydroxy-3-(1H-1,2,3-triazol-1-yl)propyl)-4,7,10-tris(carboxymethyl)-1,4,7,10-tetraazacyclododecylgadolinium(III))phenoxy) tetradecyl
To a solution of 9 (30.20 mg, 0.0637 mmol) in 1:1 DCM:MeOH (4 mL each) was added 4 (110.45 mg, 0.1841 mmol), CuI (3.15 mg, 0.1654 mmol), and TBTA (3.90 mg, 0.00735 mmol). The mixture was heated to 40 °C until the reaction was shown to be complete by MALDI-TOF-MS (typically 3–5 days). The mixture was concentrated in vacuo and diluted with ice water. The resulting solution was centrifuged and decanted. The solid was washed with MeCN to afford the desired product as a white powder (69.1 mg, 50%). Purity was confirmed with analytical HPLC-MS using a C8 column eluting with a gradient of 10–70% acetonitrile in water over 30 min, tr = 20.5 min. MALDI-TOF-MS m/z [M + H]+ calcd. for C77H119Gd3N21O22 2161.646; observed 2161.595. Anal. Calcd (%) for C77H130Gd3N21Na6O28: C, 38.41; H, 5.44; N, 12.22. Found: C, 38.42; H, 6.12; N, 11.60.
(2) 5-(2,4,6-Tris(1-(2-hydroxy-3-(1H-1,2,3-triazol-1-yl)propyl)-4,7,10-tris(carboxymethyl)-1,4,7,10- tetraazacyclododecylgadolinium(III))phenoxy) 2-decyltetradecyl
To a solution of 10 (13.69 mg, 0.0378 mmol) in 1:1 DCM:MeOH (4 mL each) was added 4 (75.52 mg, 0.1259 mmol), CuI (1.63 mg, 0.0086 mmol), and TBTA (2.34 mg, 0.0044 mmol). The mixture was heated to 40 °C until the reaction was shown to be complete by MALDI-TOF-MS (typically 3–5 days). The mixture was concentrated in vacuo and diluted with ice water. The resulting solution was centrifuged and decanted. The solid was washed with MeCN to afford the desired product as a white powder (42.4 mg, 51%). Purity was confirmed with analytical HPLC-MS using a C8 column eluting with a gradient of 10–70% acetonitrile in water over 30 min, tr = 31.8 min. MALDI-TOF-MS m/z [M + H]+ calcd. for C87H139Gd3N21O22 2302.912, observed 2303.322. Anal. Calcd (%) for C87H150Cl2Gd3N21Na2O28: C, 41.35; H, 5.98; N, 11.64. Found: C, 41.54; H, 6.64; N, 11.17.
(3) Gd(III)-1,4,7-tris(carboxymethyl)-2,2′,2″-(10-(2-oxo-2-(((1-tetradecyl-1H-1,2,3-triazol-4-yl)methyl)amino)ethyl)-1,4,7,10-tetraazacyclododecane
To a solution of 11 (40.8 mg, 0.1707 mmol) in 2:1 tBuOH:H2O (10 mL: 5 mL) was added 12 (109.7 mg, 0.1844 mmol), CuSO4 (4.90 mg, 0.0309 mmol) and sodium ascorbate (40.1 mg, 0.2024 mmol). The mixture was heated at 60 °C for 2 days. The crude mixture was purified using reverse phase semipreparative HPLC with a C8 column eluting with 35–100% acetonitrile over 8 min, tr = 4.4 min. The desired product was collected as a white powder (43.4 mg, 26%). ESI HRMS m/z [M + H]+ calcd. for 836.3669, observed 836.3684. Anal. Calcd. (%) for C33H61Cl2GdN8Na2O9: C, 41.35; H, 5.98; N, 11.64. Found: C, 41.54; H, 6.64; N, 11.17.
Relaxivity (r1)
Solutions of 1 and 2 were prepared in 500 μL of 4 mM cholate solution for T1 acquisition. Solutions of 3 were prepared in both 4 mM cholate and Millipore H2O. T1 (spin–lattice relaxation time) was determined at 60 MHz (1.41 T) and 37 °C using an inversion recovery pulse sequence on a Bruker mq60 minispec NMR spectrometer with 4 averages, 15 s repetition time, and 10 data points (Bruker Canada; Milton, Ontario, Canada). The Gd(III) concentration of each solution was determined using inductively coupled plasma-mass spectrometer (ICP-MS). The inverse of the longitudinal relaxation time (1/T1, s–1) was plotted against Gd(III) concentration (mM) and fitted to a straight line with R2 > 0.99. The slope of the fitted line was recorded as the relaxivity, r1.
Dynamic Light Scattering (DLS)
Samples for DLS were prepared at 1.2 mM Gd(III) concentration and filtered by 0.2 μm filters. Data was acquired on a Malvern Instruments Zetasizer Nano Series Nano-ZS equipped with Dispersion Technology Software v 5.03 (Worcestershire, United Kingdom). Measurements were performed in triplicate at room temperature in SARSTEDT clear polystyrene 10 × 10 × 45 mm3 cuvettes. Data analysis was performed on Zetasizer Software v 7.02 (Worcestershire, United Kingdom).
General Cell Culture Methods
Dulbecco’s modified phosphate buffered saline (DPBS), media, and dissociation reagents were purchased from Life Technologies (Carlsbad, CA). CorningBrand cell culture consumables (flasks, plates, etc.) and sera were purchased from VWR Scientific (Radnor, PA). HeLa cells (ATCC CCL-2) and NIH/3T3 cells (ATCC CRL-1658) were purchased from the American Type Culture Collection (Manassas, VA). MDA-MB-231-mcherry cells were a gift of Northwestern’s Developmental Therapeutics Core. Both HeLa and MDA-MB-231-mcherry cells were cultured in phenol red free minimum essential media (MEM) supplemented with 10% fetal bovine serum (FBS). NIH/3T3 cells were cultured in Phenol Red free Dulbecco’s modified eagle medium (DMEM) supplemented with 10% calf bovine serum. Prior to all experiments, cells were plated and allowed to incubate for 24 h before dosing. Cells were harvested with 0.25% TrypLE for 10 min at 37 °C in a 5.0% CO2 incubator. All doses were filtered with 0.2 μm sterile filters prior to administration. Cells were grown in a humidified incubator operating at 37 °C and 5.0% CO2 unless otherwise specified.
Cell Counting
Cell counting was accomplished using a Guava EasyCyte Mini Personal Cell Analyzer (EMD Millipore, Billerica, MA). After cell harvesting, an aliquot (50 μL) of the cell suspensions was mixed with Guava ViaCount reagent (150 μL) and allowed to stain at room temperature for 5 min. Stained samples were vortexed for 10 s and then cells were counted using a Guava EasyCyte Mini Personal Cell Analyzer (PCA) using the ViaCount software module. For each sample, 1000 events were acquired with dilution factors that were determined based upon optimum machine performance (∼20–70 cells/μL). Instrument reproducibility was assessed daily using GuavaCheck Beads and following the manufacturer’s suggested protocol using the Daily Check software module.
Cellular Labeling Studies
Cell labeling studies were performed with either HeLa or MDA-MB-231-mcherry cells. Specifically 20,000–25,000 cells were plated in each well of a 24-well plate. For concentration-dependent labeling studies, complexes 1–4 and Prohance were dissolved in 0.4 mM cholate and media at concentrations of 120, 60, 30, and 15 μM of Gd(III) and incubated with cells for 24 h (180 μL dose). For time-dependent labeling studies, cells were incubated with 50 μM of Gd(III) for 1, 2, 4, 8, and 24 h. Cells were rinsed twice with 500 μL 0.4 mM cholate PBS and trypsinized following contrast agent incubation and pelleted at 1000g for 5 min at 4 °C. The media was aspirated off and the cell pellet was resuspended in 200 μL of media. 50 μL of the cell suspension was used for cell counting and 130 μL was used for Gd(III) content analysis via ICP-MS.
Cell Leaching Studies
Leaching studies were performed with HeLa, MDA-MB-231-mcherry, and NIH/3T3 cells. Specifically, 50,000 cells were plated in each well of a 12-well plate and incubated for 24 h. Cells were incubated with complexes 1–3 and Prohance in 0.4 mM cholate in media (600 μL dose) for 24 h at various concentrations to equalize cell labeling. Cells were washed with 0.5 mL 0.4 mM cholate DPBS and trypsinized. The resulting solution was centrifuged at 1000g for 5 min at 4 °C. The media was aspirated and cell pellets were suspended in 500 μL of media. A small aliquot (50 μL) was used for cell counting and 100 μL was used for analysis by ICP-MS. The remainder was replated in 6 well plates. Every 24 h, the media was collected, centrifuged, and 250 μL was used for analysis by ICP-MS. The cells were washed with 1 mL 0.4 mM cholate PBS and fresh media was added to the cells. After the 72 h time point, cells were trypsinized and centrifuged. The media was aspirated and the cell pellet was resuspended in 200 μL media. A 20 μL aliquot was used for cell counting and the remainder analyzed by ICP-MS.
Cell Fractionation
The BioVision FractionPREP Cell Fractionation system (Milpitas, CA) was used to fractionate HeLa cells labeled with complexes 1–3 and Prohance (dissolved in 0.4 mM cholate in media) for 24 h at various incubation concentrations chosen to equalize cell labeling. The manufacturer’s protocol was followed to isolate cytosol and membrane fractions. Each fraction was analyzed by ICP-MS and the ratio between the two was used to determine localization.
Cytotoxicity
The CellTiter 96 AQueous Non-Radioactive Cell Proliferation Assay (Promega, Madison, WI) was used to measure cell viability. HeLa cells were plated in 96-well plates (5000 cells per well for 24 h incubations and 1000 cells per well for 72 h incubations). Complexes 1–4 and Prohance were dissolved in 0.4 mM cholate and media at various concentrations and incubated with cells (50 μL doses) for 24 or 72 h. After incubation, the assay was performed according to the manufacturer’s suggested protocol. Absorbance at 490 nm was measured using a Biotek Synergy4 microplate reader (Winooski, VT).
ICP-MS Sample Preparation and Instrument Parameters
For relaxivity and cell studies Gd(III) content was measured via ICP-MS. Specifically, samples were prepared by adding ACS reagent grade nitric acid (70%) to solutions of contrast agent or cell suspensions (1:1 v/v sample:nitric acid) in 15 mL conical tubes. Samples were incubated at 70 °C for at least 4.0 h to allow for complete sample digestion. Following sample digestion, multi-element internal standard (containing Bi, Ho, In, Li, Sc, Tb, and Y, Inorganic Ventures, Christiansburg, VA) and filtered deionized H2O (18.2 MΩ·cm) were added, producing a final ICP-MS sample of 3% (v/v) nitric acid and 5 ng/mL internal standard.
ICP-MS was performed on a computer-controlled (Plasmalab software) Thermo X series II ICP-MS (Thermo Fisher Scientific, Waltham, MA, USA) operating in standard mode equipped with an ESI SC-2 autosampler (Omaha, NE, USA). Each sample was acquired using 1 survey run (10 sweeps) and 3 main (peak jumping) runs (100 sweeps). The isotopes selected for analysis were 154,157,158Gd with 115In and 165Ho isotopes selected as internal standards for data interpolation. Instrument performance is optimized daily through an autotune followed by verification via a performance report (passing manufacturer specifications). Instrument calibration was accomplished by preparing individual-element Gd(III) standards (Inorganic Ventures, Christiansburg, VA, USA) using concentrations of 0.78125, 1.5625, 3.125, 6.25, 12.50, 25.00, 50.00, 100.0, and 200.0 ng/mL containing 3.0% nitric acid (v/v) and 5.0 ng/mL of multi-element internal standard.
Cell Pellet MR Imaging
MR imaging and T1/T2 measurements were performed on a Bruker Pharmscan 7 T imaging spectrometer fitted with shielded gradient coils at 25 °C. For cell pellet images, ∼5 × 10⁵ HeLa cells were incubated in 25 cm2 T-flasks with complexes 1–4 and Prohance for 24 h, rinsed with DPBS (2 × 1 mL/flask), and harvested with 500 μL of trypsin. After addition of 500 μL of fresh complete media, cells were transferred to 1.5 mL microcentrifuge tubes and centrifuged at 1000 × g at 4.0 °C for 5 min. The supernatant was removed; the cell pellets were resuspended in 1 mL of complete media, added to 53/4″ flame-sealed Pasteur pipets, and centrifuged at 100 × g at 4.0 °C for 5 min. The bottom sections of the flame-sealed pipets were then scored with a glass scribe, broken into small capillaries, and imaged using a RF RES 300 1H 089/023 quadrature transmit receive 23 mm volume coil (Bruker BioSpin, Billerica, MA, USA). Solution phantoms were prepared, imaged, and analyzed as previously described using serially diluted solutions.
Spin–lattice relaxation times (T1) were measured using a rapid-acquisition rapid-echo (RARE-VTR) T1-map pulse sequence, with static TE (11 ms) and variable TR (150, 250, 500, 750, 1000, 2000, 4000, 6000, 8000, and 10000 ms) values. Imaging parameters were as follows: field of view (FOV) = 25 × 25 mm2, matrix size (MTX) = 256 × 256, number of axial slices = 4, slice thickness (SI) = 1.0 mm, and averages (NEX) = 3 (total scan time = 2 h 36 min). T1 analysis was carried out using the image sequence analysis tool in Paravision 5.0 pl3 software (Bruker, Billerica, MA, USA) with monoexponential curve-fitting of image intensities of selected regions of interest (ROIs) for each axial slice.
Spin–spin relaxation times (T2) were measured using a multislice multiecho (MSME) T2-map pulse sequence, with static TR (5000 ms) and 32 fitted echoes in 11 ms intervals (11, 22, ···, 352 ms). Imaging parameters were as follows: field of view (FOV) = 25 × 25 mm2, matrix size (MTX) = 256 × 256, number of axial slices = 4, slice thickness (SI) = 1.0 mm, and averages (NEX) = 3 (total scan time = 48 min). T2 analysis was carried out using the image sequence analysis tool in Paravision 5.0 pl3 software (Bruker, Billerica, MA, USA) with monoexponential curve-fitting of image intensities of selected regions of interest (ROIs) for each axial slice.
Acknowledgments
This work was supported by the National Institutes of Health (NIH grants R01EB005866 and P01HL108795) and by a National Science Foundation Graduate Research Fellowship (C.C.). A portion of this work was completed at the Northwestern University Integrated Molecular Structure Education and Research Center. Imaging was performed at the Northwestern University Center for Advanced Molecular Imaging generously supported by NCI CCSG P30 CA060553 awarded to the Robert H Lurie Comprehensive Cancer Center. MRI was performed on the 7 T Bruker Pharmscan system purchased with the support of NCRR 1S10RR025624-01. Metal analysis was performed at the Northwestern University Quantitative Bioelemental Imaging Center generously supported by NASA Ames Research Center NNA06CB93G. Plate-based assays were performed at the Northwestern High Throughput Analysis Lab. Semipreparative HPLC was done by ChemCore at the Center for Molecular Innovation and Drug Discovery which is generously supported by the Chicago Biomedical Consortium with support from The Searle Funds at The Chicago Community Trust.
Supporting Information Available
Compound characterization, DLS fitting, 7 T relaxivity, toxicity profiles, IC50 values, time-dependent labeling, nonspecific binding, and cell pellet T2 analysis. This material is available free of charge via the Internet at http://pubs.acs.org.
The authors declare no competing financial interest.
Funding Statement
National Institutes of Health, United States
Supplementary Material
References
- Zhang Y. Q.; Dodd S. J.; Hendrich K. S.; Williams M.; Ho C. (2000) Kidney Int. 58, 1300. [DOI] [PubMed] [Google Scholar]
- Modo M.; Cash D.; Mellodew K.; Williams S. C.; Fraser S. E.; Meade T. J.; Price J.; Hodges H. (2002) NeuroImage 17, 803. [PubMed] [Google Scholar]
- Modo M.; Mellodew K.; Cash D.; Fraser S. E.; Meade T. J.; Price J.; Williams S. C. (2004) NeuroImage 21, 311. [DOI] [PubMed] [Google Scholar]
- Modo M.; Beech J. S.; Meade T. J.; Williams S. C.; Price J. (2009) NeuroImage 47(Suppl 2), T133. [DOI] [PMC free article] [PubMed] [Google Scholar]
- Anderson S. A.; Glod J.; Arbab A. S.; Noel M.; Ashari P.; Fine H. A.; Frank J. A. (2005) Blood 105, 420. [DOI] [PubMed] [Google Scholar]
- Modo M.; Hoehn M.; Bulte J. W. (2005) Mol. Imaging 4, 143. [DOI] [PubMed] [Google Scholar]
- Caravan P.; Ellison J. J.; McMurry T. J.; Lauffer R. B. (1999) Chem. Rev. 99, 2293. [DOI] [PubMed] [Google Scholar]
- Merbach A. E. T., Ed. The Chemistry of Contrast Agents in Medical Magnetic Resonance Imaging; John Wiley & Sons, Ltd.: New York, 2001. [Google Scholar]
- Endres P. J.; MacRenaris K. W.; Vogt S.; Meade T. J. (2008) Bioconjugate Chem. 19, 2049. [DOI] [PMC free article] [PubMed] [Google Scholar]
- Adler E. D.; Bystrup A.; Briley-Saebo K. C.; Mani V.; Young W.; Giovanonne S.; Altman P.; Kattman S. J.; Frank J. A.; Weinmann H. J.; Keller G. M.; Fayad Z. A. (2009) JACC: Cardiovasc. Imaging 2, 1114. [DOI] [PMC free article] [PubMed] [Google Scholar]
- Nolte I. S.; Gungor S.; Erber R.; Plaxina E.; Scharf J.; Misselwitz B.; Gerigk L.; Przybilla H.; Groden C.; Brockmann M. A. (2008) Magn. Reson. Med. 59, 1014. [DOI] [PubMed] [Google Scholar]
- Bhorade R.; Weissleder R.; Nakakoshi T.; Moore A.; Tung C. H. (2000) Bioconjugate Chem. 11, 301. [DOI] [PubMed] [Google Scholar]
- Wunderbaldinger P.; Josephson L.; Weissleder R. (2002) Bioconjugate Chem. 13, 264. [DOI] [PubMed] [Google Scholar]
- Allen M. J.; MacRenaris K. W.; Venkatasubramanian P. N.; Meade T. J. (2004) Chem. Biol. 11, 301. [DOI] [PubMed] [Google Scholar]
- Endres P. J.; Macrenaris K. W.; Vogt S.; Allen M. J.; Meade T. J. (2006) Mol. Imaging 5, 485. [PubMed] [Google Scholar]
- Song Y.; Xu X. Y.; MacRenaris K. W.; Zhang X. Q.; Mirkin C. A.; Meade T. J. (2009) Angew. Chem., Int. Ed. 48, 9143. [DOI] [PMC free article] [PubMed] [Google Scholar]
- Vuu K.; Xie J.; McDonald M. A.; Bernardo M.; Hunter F.; Zhang Y.; Li K.; Bednarski M.; Guccione S. (2005) Bioconjugate Chem. 16, 995. [DOI] [PubMed] [Google Scholar]
- Tseng C. L.; Shih I. L.; Stobinski L.; Lin F. H. (2010) Biomaterials 31, 5427. [DOI] [PubMed] [Google Scholar]
- Terreno E.; Geninatti Crich S.; Belfiore S.; Biancone L.; Cabella C.; Esposito G.; Manazza A. D.; Aime S. (2006) Magn. Reson. Med. 55, 491. [DOI] [PubMed] [Google Scholar]
- Di Gregorio E.; Gianolio E.; Stefania R.; Barutello G.; Digilio G.; Aime S. (2013) Anal. Chem. 85, 5627. [DOI] [PubMed] [Google Scholar]
- Zheng Q.; Dai H.; Merritt M. E.; Malloy C.; Pan C. Y.; Li W. H. (2005) J. Am. Chem. Soc. 127, 16178. [DOI] [PubMed] [Google Scholar]
- Gianolio E.; Giovenzana G. B.; Longo D.; Longo I.; Menegotto I.; Aime S. (2007) Chemistry 13, 5785. [DOI] [PubMed] [Google Scholar]
- Andre J. P.; Toth E.; Fischer H.; Seelig A.; Macke H. R.; Merbach A. E. (1999) Chem.—Eur. J. 5, 2977. [Google Scholar]
- Nicolle G. M.; Toth E.; Eisenwiener K. P.; Macke H. R.; Merbach A. E. (2002) J. Biol. Inorg. Chem. 7, 757. [DOI] [PubMed] [Google Scholar]
- Hovland R.; Glogard C.; Aasen A. J.; Klaveness J. (2003) Org. Biomol Chem. 1, 644. [DOI] [PubMed] [Google Scholar]
- Torres S.; Martins J. A.; Andre J. P.; Geraldes C. F. G. C.; Merbach A. E.; Toth E. (2006) Chem.—Eur. J. 12, 940. [DOI] [PubMed] [Google Scholar]
- Vaccaro M.; Accardo A.; Tesauro D.; Mangiapia G.; Lof D.; Schillen K.; Soderman O.; Morelli G.; Paduano L. (2006) Langmuir 22, 6635. [DOI] [PubMed] [Google Scholar]
- Mastarone D. J.; Harrison V. S.; Eckermann A. L.; Parigi G.; Luchinat C.; Meade T. J. (2011) J. Am. Chem. Soc. 133, 5329. [DOI] [PMC free article] [PubMed] [Google Scholar]
- Song Y.; Kohlmeir E. K.; Meade T. J. (2008) J. Am. Chem. Soc. 130, 6662. [DOI] [PMC free article] [PubMed] [Google Scholar]
- Pajk S.; Garvas M.; Strancar J.; Pecar S. (2011) Org. Biomol Chem. 9, 4150. [DOI] [PubMed] [Google Scholar]
Associated Data
This section collects any data citations, data availability statements, or supplementary materials included in this article.


