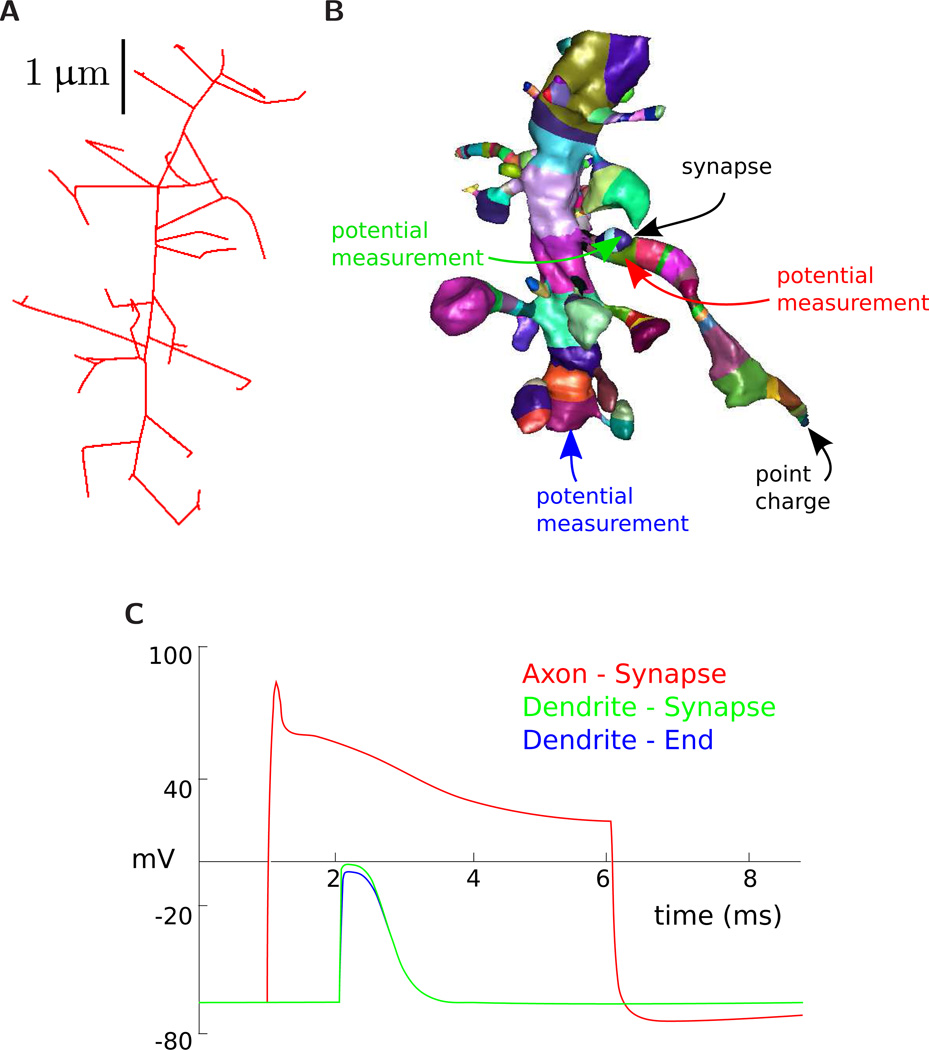
Figure 8.
Multi-compartment model generation. Our surface segmentation first skeletonizes the mesh (A), which induces a segmentation (B). Each segment is in a different color in the figure. After correction, the segmentation can be used to produce surface area/volume statistics of different regions as well as labeling different regions for ion diffusion studies. This graphic shows a simple cable model simulation. The compartmentalized versions of the axon and dendrite are input to NEURON. A synapse with a threshold and delay is added between the dendrite and axon and a point charge is placed at the end of the axon. Three potential measurements are made over time. Arrow colors correspond the potential measurements reported in the NEURON simulation graph in figure (C).

