

Abstract
Purpose
A practical, non-invasive method is needed to measure the extracellular pH (pHe) within in vivo tumors to longitudinally monitor tumor acidosis. We have optimized a biomedical imaging method, termed acidoCEST MRI, to provide non-invasive assessments of tumor pHe in pre-clinical models of mammary carcinoma.
Methods
A CEST-FISP MRI method was optimized to detect the chemical exchange saturation transfer (CEST) of two amide protons of a clinically approved CT contrast agent, iopromide. The ratio of the two CEST effects was used to measure pH. Routes of administration of iopromide were evaluated to ensure sufficient delivery of the agent to the tumor. The optimized acidoCEST MRI method was then used to evaluate the change in tumor pHe following alkalinizing bicarbonate treatment.
Results
The acidoCEST MRI protocol measured pH between 6.2 and 7.2 pH units. Greater delivery of iopromide was shown to improve the precision of the measurement of tumor pHe, but the agent did not influence the tumor pHe. AcidoCEST MRI was used to longitudinally monitor the effect of bicarbonate treatment on the pHe of tumors and bladders.
Conclusions
This study demonstrates that an optimized acidoCEST MRI method is a practical, non-invasive method for assessing changes in tumor acidosis.
Keywords: CEST MRI, tumor PH, iopromide, CEST-FISP, bicarbonate treatment
Introduction
Tumor acidosis changes extrinsic cellular interactions that lead to tumor invasion and metastasis (1,2). Extracellular acidity can be toxic to surrounding host tissue and can promote invasion (3–5). Tumor acidosis also promotes metastasis by selecting cells that exhibit metastatic phenotypes (6–8). Thus, measuring the extracellular pH (pHe) in solid tumors has potential to characterize tumor aggressiveness.
Many chemotherapies, such as doxorubicin (Adriamycin®, Pfizer Inc., New York, NY), are weak-base drugs that exhibit lower therapeutic efficacy against acidic tumors (9–12). Other potential chemotherapies, such as esomeprazole (Nexium™, AstraZeneca plc, London UK), are weak-acid chemotherapies that may exhibit higher therapeutic efficacy against acidic tumors (13,14). Measuring tumor pHe has potential to predict therapeutic efficacy of a weak-base drug or weak-acid drug before the therapeutic treatment is initiated for each patient, which can lead to personalized medicine.
Treatments that alkalinize the tumor microenvironment, such as sodium bicarbonate, may affect invasion and metastasis, and may also potentiate chemotherapeutic efficacies of weak-base drugs (15). However, alkalinizing treatments remains controversial because the duration of alkalinization to affect outcome is unknown, and the detriments to normal tissues such as kidney and liver are also unknown (16,17). Accurately monitoring pHe in tumors and normal tissues may greatly aid in evaluating the utility of alkalinizing treatments for cancer care.
Several non-invasive methods have been developed to monitor tumor pHe in vivo. Optical imaging can measure tumor pHe, but can only evaluate surface-accessible tumors and cannot measure the entire tumor volume (18,19). Positron emission tomography (20,21), electron paramagnetic resonance spectroscopy (22), and magnetic resonance spectroscopy (23,24) can measure tumor pHe, but these methods are inaccurate, insensitive, or difficult to implement especially for clinical diagnoses. Magnetic resonance imaging (MRI) with relaxivity-based contrast agents can also be used to measure pH (25). However, the concentration of the relaxivity-based MRI contrast agent must be known to accurately measure tumor pHe, which is technically challenging (26). Therefore, an imperative remains for a clinically relevant, non-invasive imaging method that can measure tumor pHe.
MRI contrast agents that are detected via Chemical Exchange Saturation Transfer (CEST) have been used to measure pH (27). To detect a CEST agent, radio frequency saturation is applied at a specific MR frequency of an exchangeable proton on the agent, which reduces the detectable magnetization from this proton. Rapid chemical exchange of this saturated proton with a proton on a near-by water molecule causes the reduced detectable magnetization to be transferred to the water signal. A standard MRI acquisition sequence can then be employed to measure the amplitude of the water signal throughout the image (28). A CEST spectrum is obtained by iterating the saturation frequency and recording the normalized water signal amplitude (29). Because the average chemical exchange rates of some labile protons are pH-dependent, and because CEST effects from two labile protons can be selectively detected, a ratio of two CEST effects from the same agent can be used to measure pH in a manner that is independent of concentration, endogenous T1 relaxation time, and incomplete saturation (30,31). As an example, iopamidol (Isovue™, Bracco Imaging S.p.A.) is a clinically approved CT contrast agent that has been used to measure pHe within in vivo kidney tissue (32).
We have investigated the use of in vivo CEST MRI for measuring tumor acidosis, which we term “acidoCEST MRI”. We have previously developed in vivo CEST-FISP MRI acquisition protocols that rapidly detect in vivo CEST effects, which is critical for tracking exogenous contrast agents within in vivo tissues (33). We have developed Lorentzian line shape fitting methods that improve in vivo CEST measurements (34). We sought to optimize our past technological developments to create the acidoCEST MRI protocol. We investigated the use of iopromide (Ultravist™, Bayer Healthcare, Inc.), which is similar to iopamidol. We have especially focused on the optimization of delivery of iopromide to tumor tissue, to create a method that can non-invasively measure tumor pHe. To investigate the practical utility of acidoCEST MRI, we investigated whether this method could identify acidic tumors relative to pH-neutral tumors, and monitor the effect of bicarbonate alkalinization treatment.
Methods
Optimizing acidoCEST MRI with iopromide
Chemical samples were prepared using clinical-grade iopromide at 788 mM concentration (300 mg iodine /mL Ultravist™, Bayer Healthcare, Inc.). The iopromide was diluted with distilled water to concentrations ranging from 12.5 mM to 400 mM, and the pH was adjusted to values between 6.30 and 7.30 using 5 M hydrochloric acid. The addition of < 0.2 mL of hydrochloric acid to 50 mL of each solution had a negligible effect on the solution’s concentration. The pH values of the final solutions were measured with a calibrated pH electrode (Mettler Toledo, Inc.). Chemical solutions were placed in 300 μL centrifuge tubes, the tubes were placed in a customized cradle, and the cradle was inserted into the MRI scanner. The samples were maintained at 37.0 ± 0.2°C using a heated air and an automatic temperature feedback system (SA Instruments, Inc., Stony Brook, NY)
All MRI studies were performed with a CEST-FISP MRI protocol using a 7T Biospec MRI scanner with a 72 mm-diameter quadrature transceiver coil (Bruker Biospin, Inc.) (33). The FISP acquisition used the following parameters: 3.218 msec TR; 1.609 msec TE; 60° excitation angle; 2 mm slice thickness; 250 × 250 μm in-plane resolution; 3.2 × 3.2 cm field of view; linear encoding order; unbalanced “FID” mode; 418.54 msec scan time. The CEST saturation period consisted of a series of Gaussian shaped radio frequency pulses with an interpulse delay of 10 μsec and no additional spoiling or fat saturation pulses.
To optimize the CEST saturation period, the saturation time was varied from 0.5 to 8.0 sec while the saturation power was set to 2 μT, the bandwidth was set to 90 Hz, the flip angle was set to 540°, and a series of 54 MR frequencies were saturated to acquire a CEST spectrum in 0.3 ppm increments from +10 to −2.9 ppm, and in 1 ppm increments from −3 to −10 ppm, and at +100 ppm and −100 ppm to measure MR signal without saturation effects close to water. The saturation power was varied between 0.5 to 4.6 μT while the saturation time was set to 5.0 sec, the bandwidth was set to 90 Hz, the flip angle was set to 540°, and the same series of 54 MR frequencies were saturated. Bandwidths of 30 and 60 Hz were also tested while using a saturation time of 5.0 sec, a saturation power of 2 μT, and a flip angle of 540°. For tests with a 30 Hz bandwidth, frequencies were saturated between −10 and −3 ppm in 1 ppm increments, and between −3 and 9 ppm in 0.1 ppm increments, and at +100 ppm and −100 ppm. For tests with a 60 Hz bandwidth, frequencies were saturated between −10 and −3 ppm in 1 ppm increments, and between −3 and 10 ppm in 0.2 ppm increments, and at +100 ppm and −100 ppm.
The signal amplitudes of each series of CEST-FISP images were measured using ImageJ to create a CEST spectrum (35). Each CEST spectrum was smoothed with a cubic spline function using Matlab R2012B (Mathworks, Inc) (36). A sum of three Lorentzian line shapes was fit to each smoothed CEST spectrum using customized routines written for Matlab R2012B (Mathworks, Inc., Natick, MA) (28). A log10 ratio of CEST effects from the two amide protons was compared with the pH of each sample to create a linear calibration of CEST vs. pH (30,31,34). The correlation of CEST vs. concentration was fit to a linear function based on a two-pool model that represents the chemical exchange between one amide group and water (37)
The mouse model of mammary carcinoma for imaging studies
All in vivo studies were conducted according to approved procedures of the Institutional Animal Care and Use Committee of the University of Arizona. A model of MDA-MB-231 mammary carcinoma was prepared by injecting one million tumor cells in 0.5 mL of 50% Matrigel into the right lower flank of a 6-week-old female SCID mouse. Imaging studies were conducted when the subcutaneous tumor reached a size greater than 4 mm in diameter. When needed, a 27 g catheter was inserted in the tail vein or the abdominal cavity to facilitate the i.v. or i.p. injection of contrast agents. At the conclusion of the imaging scan, the mouse was removed from the scanner and cradle, and allowed to recover. To test the ability of acidoCEST MRI to measure a change in pHe within tumors or bladders, acidoCEST MRI was performed one day before and one day after adding 200 mM of bicarbonate to their drinking water.
For the “direct” injection procedure, 50 μL of 972 mM (370 mg iodine / mL) clinical-grade iopromide was directly injected into the center of the subcutaneous tumor using a 32 g needle. For the “subcutaneous” injection procedure, 0.5, 1.0, or 1.5 μL of 788 mM iopromide, or 1.5 mL of iopromide adjusted to pH 6.3, 6.9, or 7.2, was injected subcutaneously adjacent to the tumor using a 32 g needle, and the injection fluid was allowed to soak into the tumor tissue. For the “IV” injection procedure, the same i.v. injection of iopromide was intravenously injected within 60 seconds through the tail vein catheter. For the “IV-infusion” injection procedure, 200 μL of 788 mM iopromide was followed by slow infusion of the agent at 150 μL/hr during imaging. For the “IP” injection procedure, 1500 μL of 972 mM iopromide was injected intraperitoneally (IP).
In vivo micro-Computed Tomography (micro-CT) protocol
Thirteen chemical solutions of iopromide at 0, 0.005, 0.05, 0.5, 2.4, 5, 10, 12, 30, 60, 120, 240, and 300 mM concentrations were initially imaged using micro-CT to establish a linear calibration of signal vs. concentration. To prepare for in vivo imaging studies, a mouse was anesthetized with 1.5–2.5% isoflurane delivered in 1 L/min oxygen gas ventilation, and secured to a customized cradle in the micro-CT scanner. Chemical solutions with 2.4 and 12 mM concentrations of iopromide were placed near the mouse as a concentration reference.
Micro-CT studies of chemical solutions and the in vivo mouse model were performed using a Siemens Inveon micro-CT scanner and Inveon Acquisition Workplace software (Siemens Medical Solutions USA, Inc., Knoxville, TN). All scans were acquired with the following parameters: 80 kVp, 395 msec exposure time, 500 μA current, 220 rotation steps with 601 projections, ~8.5 minute scan time, 0.5 mm aluminum filter, four-fold bin factor, and low magnification yielding an overall reconstructed isotropic voxel size of 105 microns. Scans were reconstructed with filtered back-projection and no down-sampling using integrated high-speed COBRA reconstruction software (Exxim Computing Corporation, Pleasanton, CA). A scalar linear attenuation coefficient in Hounsfield Units (HU) was applied to each dataset to facilitate inter-scan comparisons.
In vivo acidoCEST MRI protocol
To prepare for imaging studies, a mouse was anesthetized with 1.5–2.5% isoflurane delivered in 1 L/min oxygen gas ventilation, the mouse was secured to a customized cradle, probes for monitoring rectal temperature and respiration were connected to the mouse, the core body temperature was regulated at 37.0 ± 0.2°C using an automated feedback loop between the temperature probe and an air heater (SA Instruments, Inc., Stony Brook, NY), and the cradle was inserted into the MRI scanner. At the conclusion of the imaging scan, the mouse was removed from the scanner and cradle, and allowed to recover.
A CEST-FISP MRI protocol employed the same FISP acquisition period used for studies with chemical solutions. The saturation period had a 5.0 s saturation time, a 2 μT saturation power, a 90 Hz bandwidth, and a 540° flip angle. A series of 54 MR frequencies were saturated to acquire a CEST spectrum in 0.3 ppm increments from +10 to −2.9 ppm, and in 1 ppm increments from −3 to −10 ppm, and at +100 ppm and −100 ppm to measure MR signal without saturation effects close to water. This procedure was initiated within 30 seconds after IV injection using the “IV-infusion” protocol or 2 minutes after subcutaneous injection using the “subcutaneous” protocol. The total time to acquire a single MR CEST spectroscopic image was 4:51 minutes. MR CEST spectroscopic imaging was repeated for a total of six times, for a total acquisition time of 29:06 minutes. The MR signals from a region of interest that represented the tumor were used to construct a CEST spectrum, which was then analyzed using the same protocol used to analyze chemical samples described above.
Results
Optimizing acidoCEST MRI with iopromide
Iopromide, a clinically approved CT contrast agent, has two amide protons that have MR frequencies at 4.2 and 5.6 ppm (Fig. 1a). A CEST spectrum showed that the CEST effect from each amide could be selectively detected (Fig. 1b). To measure each CEST effect, a sum of three Lorentzian line shapes was fitted to the smoothed CEST spectrum. The low residuals near 4.2 and 5.6 ppm attest that these fittings could accurately measure each CEST effect (Fig. 1c). Although the hydroxyl groups of iopromide generate a CEST effect at 0.8 ppm, this effect was difficult to distinguish from the direct saturation of water centered at 0 ppm, and therefore only a single Loretzian line shape was fit to the CEST effect of the hydroxyl groups and the direct water saturation, resulting in higher fitting residuals near 0 ppm.
Figure 1. CEST of iopromide.

(a) The chemical structure of iopromide. (b) A CEST spectrum of 200 mM iopromide at pH 6.69 and 37.0°C with saturation applied at 2 μT for 5 sec. (c) Lorentzian line shapes fitted to the CEST spectrum show CEST effects at 4.2 ppm and 5.6 ppm. Squares represent the residuals of the fitting process.
The concentration dependence of each CEST effect measured at pH 6.44 (Fig. 2a) fit to a linear algorithm based on a two-pool model that represented one amide group and water (Fig. 2b) (37). The excellent fittings to these models, with R2 correlations greater than 0.967, indicated that each CEST effect was independent of the other CEST effect. Furthermore, this result showed the ratio of the two CEST effects was independent of concentration, with an average ratio of 1.24 ± 3.7%.
Figure 2. Evaluation of the concentration dependence of the CEST effects of iopromide.

(a) The CEST effects at 5.6 ppm (squares) and 4.2 ppm (circles) measured at pH 6.44 were dependent on concentration, but the ratio (triangles) was independent of concentration. Solid lines represent the CEST-concentration relationship based on the linear analysis shown in panel b. The dashed line represents the average of the ratios, 1.24. (b) CEST at 5.6 ppm (squares) and 4.2 ppm (circles) from samples with different concentrations were fit using a Hanes-Woolf CEST concentration plot that is based on a two-pool model. The excellent linear fitting demostrated that each CEST effect was idenpdendent of the other CEST effect. CEST was measured using a 5 second saturation period with 2 μT saturation power, followed by a CEST-FISP acquisition protocol.
We optimized the saturation time for acidoCEST MRI with iopromide (Fig. 3a). The CEST effects from each amide proton did not reach steady state with 8 seconds of saturation. However, a log10 ratio of the CEST attained a constant value after 1.5 seconds of saturation. This result demonstrated that incomplete saturation of both CEST effects does not affect the pH measurement with acidoCEST MRI. This obviated a concern for B1 inhomogeneity during in vivo studies, and allowed for a shorter saturation time. We set the saturation time to 5 seconds for subsequent studies to improve sensitivity for measuring each CEST effect.
Figure 3. Evaluation of saturation conditions.

Although each CEST effect of iopromide at pH 6.74 showed an increase with (a) increasing saturation time and (b) increasing saturation power, a log10 ratio did not change with saturation times ≥ 2 sec and ≥ 1.8 μT. A CEST-FISP acquisition protocol was used for this study.
We also optimized the saturation power for acidoCEST MRI with iopromide (Fig. 3b). The CEST effects from each amide proton did not reach a maximum with the range of 0.5 to 5 μT saturation powers. A maximum CEST effect should have been observed within 5 μT for protons exchanging slower than 1500 Hz, and our previous studies have shown that the amide protons of iopromide have chemical exchange rates of approximately 100 and 1200 Hz (38,39). This result indicates that the saturation power affecting the sample was less than the saturation power generated by the MRI scanner, which was attributed to B1 homogeneity. However, a log10 ratio of the CEST attained a constant value after 1.8 μT saturation power, once again indicating that B1 inhomogeneity that causes incomplete saturation of both CEST effects does not affect the pH measurement with acidoCEST MRI. We set the saturation power to 2 μT for subsequent studies to minimize the specific absorption rate during in vivo studies.
We also optimized the bandwidth of the saturation pulse for acidoCEST MRI using samples at 200 mM concentration. Although the amide protons of iopromide have large chemical shifts relative to other diamagnetic CEST agents, these chemical shifts are still close to each other and to the MR frequency of water. The saturation bandwidth should be minimized to improve the specificity of measuring CEST from each amide proton. Yet the sensitivity of detecting CEST improves with increasing bandwidth. Therefore, an optimal bandwidth is needed to achieve balance between sensitivity and specificity. Our tests of combinations of saturation bandwidth and power showed that a 90 Hz bandwidth at 2 μT power could calibrate a ratio of CEST with greatest range of pH (Table 1). The optimized saturation conditions were used to calibrate a log10 ratio of iopromide’s CEST effects with pH within a range from 6.3 to 7.2 units (Fig. 4). This calibration showed excellent linearity with a R2 value of 0.95 and a precision of 0.07 pH units.
Table 1.
Measurable pH Rangea
| Saturation Power | Bandwidth | ||
|---|---|---|---|
| 30 Hz | 60 Hz | 90 Hz | |
| 1 μT | pH 6.0–7.1 | pH 6.0–7.0 | pH 6.0–6.8 |
| 2 μT | pH 6.0–7.1 | pH 6.0–7.0 | pH 6.0–7.2 |
| 4 μT | pH 6.3–7.0 | pH 6.3–7.0 | pH 6.3–6.8 |
The measurable pH range was defined as the range that could generate two CEST effects from the contrast agent that are 2√2 times the standard deviation of the noise of the CEST MR image, which have a 95% probability of being real (39). Samples were tested at a concentration of 200 mM.
Figure 4. The effect of pH on CEST.

(a) The CEST effects of iopromide are sensitive to pH. CEST spectra were acquired with 200 mM iopromide at 37°C with saturation applied at 2 uT for 5 sec. The CEST spectra of fitted Lorentzian line shapes are vertically offset to aid the viewing. (b) A log10 ratio of the two CEST effects is linearly correlated with pH from pH 6.3 to pH 7.2.
Evaluation of routes of injection
Micro-CT was used to test the delivery of iopromide to the tumor and normal tissues following “direct”, “subcutaneous”, “IV”, “IV-infusion”, and “IP” injection protocols (Fig. 5 and Table 2). As expected, direct injection into the tumor provided the greatest delivery of agent, but this method caused minor bleeding at the needle entrance site, so that direct injection failed to meet our criterion of being a non-invasive method. The IP injection showed no detectable uptake of agent in the tumor, and therefore was inadequate for acidoCEST MRI studies. The subcutaneous, IV, and IV-infusion injections delivered 5.12, 4.08, and 3.69 mM of agent to the tumor. The minor differences in these concentrations were assumed to be due to biological variability, so that the subcutaneous, IV, and IV-infusion injections were considered to deliver comparable concentrations of agent to the tumor. Furthermore, the concentration of agent in the tumor was relatively stable during the micro-CT scan session, which showed a change in concentration of only 6.69% per 4:51 minutes which was the acquisition time of a single CEST spectrum. Therefore, the IV-infusion protocol and subcutaneous injection protocol were used for subsequent acidoCEST MRI studies because this route of injection was non-invasive and provided a stable accumulation of agent in the tumor. The IV-infusion protocol was used instead of the IV protocol to potentially improve the stability of the concentration of agent in the tumor.
Figure 5. A comparison of routes of administration using micro-CT.
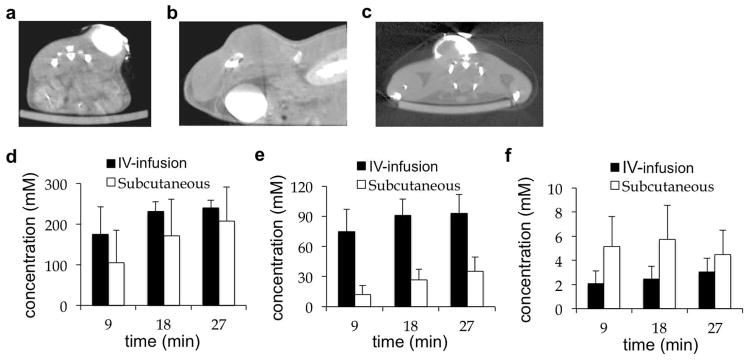
(a) An axial image of the tumor 9 min after direct injection. (b) A sagittal image of bladder, kidney and tumor 27 min after IV-infusion injection. (c) An axial image of the tumor 9 min after subcutaneous injection. (d) The concentration in the bladder, (e) kidney, and (f) tumor showed that IV-infusion and subcutaneous injections caused renal clearance of the agent and steady uptake in the tumor.
Table 2.
Maximum uptake of iopromide following injectiona
| Tissue | direct injection (50 μL) | subcutaneous injection (1.5 mL) | IV injection (200 μL) | IV-infusion 200 μL bolus (150 μL/hr) |
|---|---|---|---|---|
| tumor | 349 mM | 5.12 mM | 4.08 mM | 3.69 mM |
| bladder | 95 mM | 208 mM | 320 mM | 240 mM |
| kidney | 2 mM | 52 mM | 79 mM | 93 mM |
IP injection: limited uptake in bladder and kidney, and no uptake in tumor and muscle
The optimized acidoCEST MRI protocol with iopromide was used to measure in vivo tumor pHe of a mouse model of mammary carcinoma. The IV-infusion and subcutaneous injections were tested using the same five mice on successive days (Fig. 6a,b). The CEST spectra of iopromide in the tumor tissue following both routes of injection had more noise than CEST spectra of chemical solutions. CEST measurements that are 2√2 times the standard deviation of the noise of the CEST MR image have a 95% probability of being real (40). All CEST measurements were greater than this threshold. Also, the fitting residuals were low near the CEST effects of the amide protons of iopromide, which provided confidence that the CEST effects were accurately determined. The CEST spectrum contained features in the negative ppm range that were attributed to magnetization transfer effects from fat, because fat suppression was not included in our protocol. Yet the Lorentzian line shape fitting method that analyzes features in the positive ppm range was not affected by these poorly-fit features in the negative ppm range.
Figure 6. A comparison of routes of administration using acidoCEST MRI.
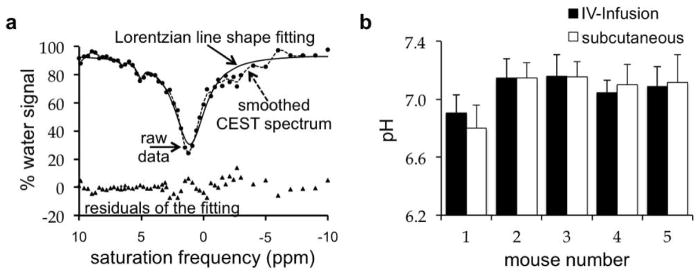
(a) Lorentzian line shape fitting to a smoothed CEST spectrum after IV-infusion injection. (b) The difference in extracellular tumor pH determined after IV-infusion and subcutaneous injection had a standard deviation of 0.028 pH units. The average standard deviation of the IV-infusion and subcutaneous injection was 0.137 and 0.138 pH units, respectively, indicating that protocols with the IV-injection and subcutaneous injections produced the same pH value.
The IV-infusion and subcutaneous injections produced comparable measurements of tumor pHe. Six CEST spectra were acquired after subcutaneous or IV-infusion injection of the agent to a mouse. The average and standard deviation of the six pHe measurements from each CEST spectrum was used to determine the tumor pHe (Fig. 6c). The average standard deviation of the tumor pHe measurements after IV-infusion and subcutaneous injection was 0.137 pH units and 0.138 pH units, respectively. For comparison, the average standard deviation of the difference between the pHe measurements with IV-infusion vs. subcutaneous injection was only 0.028 pH units. Therefore the “inter-injection” variance was less than the “intra-injection” variances, indicating that both routes of injection produced the same results. This result indicated that subsequent tests of the precision of acidoCEST MRI measurements using a subcutaneous injection should also be valid for IV-infusion injection.
Subcutaneous injections with 0.5, 1.0, and 1.5 mL volumes of the agent were performed on successive days using the same eight mice (Fig. 7a). The standard deviation of the pHe measurements made from six CEST spectra was determined for each acidoCEST MRI scan session of each mouse (Fig. 7b). The average standard deviation of tumor pHe measurements decreased from 0.287 to 0.214 to 0.141 pH units with 0.5 mL, 1.0 mL, and 1.5 mL injections, indicating improved precision with greater delivery of agent, as expected. In addition, the average standard deviation of the difference between tumor pHe values determined with each volume was 0.081 pH units. This “inter-volume” standard deviation was less than each “intra-volume” standard deviation, indicating that the volume of injection did not dilute the tissue and subsequently affect the pH determination, which validated that the acidoCEST MRI protocol was noninvasive.
Figure 7. Evaluations of injection conditions on acidoCEST MRI results.

(a) The volume of the subcutaneous injection had an average inter-injection standard deviation of 0.081 pH units. (b) Greater injection volumes produced a lower intra-injection standard deviation, indicating improved precision with greater delivery of agent. (c) Subcutaneous injections of solutions with different pH had an average inter-injection standard deviation of 0.055 pH units, (d) and an average intra-injection standard deviation of 0.142 pH units, indicating that the pH of the injection did not influence the accuracy or precision of the pH measurement.
Subcutaneous injections with solutions adjusted to pH 6.3, 6.9, and 7.2 were performed on successive days with the same six mice (Fig. 7c). The average standard deviation of the 18 tumor pHe measurements was 0.142 pH units (Fig. 7d), while the average standard deviation of the difference between tumor pHe values determined with solutions at each pH was only 0.055 pH units. The “inter-pH” standard deviation was less than the “intra-pH” standard deviation, which further indicated that the pH of the injection did not influence the tumor pHe measurement, and further validated that the acidoCEST MRI protocol was non-invasive.
Monitoring the effects of bicarbonate treatment on tumor pHe
To investigate the practical utility of acidoCEST MRI, we investigated whether this method could identify acidic tumors and monitor the effect of bicarbonate alkalinization treatment. The average pHe of the tumor was measured in a mouse model of MDA-MB-231 mammary carcinoma (Fig. 8a, 8c). Tumor pHe was measured with a precision of 0.095 pH units. Three tumors were classified as very acidic (pH 6.5), one tumor was classified as moderately acidic (pH 6.9), and four tumors were classified as pH-neutral (pH > 7.0). Two of the four pH-neutral tumors showed evidence for necrosis (mouse #7 and #8 of Fig. 8c). One day after treating the mouse model with bicarbonate ad libitum, the pHe of all tumors increased to pH > 7.1. These results demonstrated that acidoCEST MRI can track changes in tumor pHe.
Figure 8. The effect of bicarbonate treatment on tissue pHe.

(a) The MR image shows the location of the tumor and bladder. (b) The extracellular pH in the bladder increased an average of 0.53 pH units 24 hours after providing 200 mM bicarbonate in drinking water. C) The initial tumor pHe ranged from 6.5 to 7.2. The tumor pHe increased to ≥ 7.1 pH units after bicarbonate treatment. Error bars represent the standard deviation of 4–12 measurements within 30 minutes. ** p < 0.01, * p < 0.02.
The average pH of the bladder was also measured in two mice on two successive weeks, for a total of four measurements (Fig. 8b). The bladder pH was measured with a precision of 0.119 pH units. Before treatment with bicarbonate, the bladder pH ranged between 6.3 and 6.6 units. Bicarbonate treatment raised the pH of all bladders to > 6.8 pH units. For each mouse, the increase in bladder pH was statistically significant (p<0.02).
Discussion
We have established an optimized protocol for acidoCEST MRI. However, this optimization included an empirical calibration that was specific to a series of Gaussian-shaped pulses at 7T magnetic field strength. Saturation with other conditions and at other magnetic field strengths may require a different empirical calibration. This optimization included consideration for the route of injection. Subcutaneous injection could be helpful for evaluating MRI contrast agents because it can be comparable to IV-infusion injection. These experiments also established that an IV-infusion injection delivered a sufficient and stable amount of agent to tumor tissue for acidoCEST MRI studies. This optimization included the use of Lorentzian line shape fitting to measure CEST effects, and a statistical noise threshold to ensure the statistically significant detection of CEST from both amide protons, which can be easily translated to other CEST MRI studies with other saturation periods and magnetic field strengths.
These results confirm that iopromide can be used as a contrast agent for dual-modality micro-CT and acidoCEST MRI studies. In particular, micro-CT studies with iopromide cross-validated the delivery of agent to the tumor using IV-infusion and subcutaneous injections. Although cross-validation is critical for engineering new imaging methods, dual-modality imaging has more potential impact when each modality can provide complementary information rather than the same information (41). For example, micro-CT studies with iopromide have been used to identify solid tumors with high resolution. Iopromide contains three iodine atoms, and therefore radiolabeling iopromide with 123I or 124I may be feasible, which would provide the opportunity to identify solid tumors with high sensitivity SPECT or PET imaging modalities, respectively. Our study establishes that acidoCEST MRI with iopromide provides complementary information by measuring the average tumor pHe, once the tumor has been identified, which may improve assessments of solid tumors with dual-modality CT-MRI, SPECT-MRI, or PET-MRI.
Based on our statistical criteria, acidoCEST can only reliably measure a maximum pH of 7.2, and therefore our measurements may have underestimated the average pHe of tumors that were classified as pH-neutral. This underestimation is expected to be minor, because pHe in tumors and normal tissues is rarely expected to exceed pH 7.4 (6). Yet improvements to acidoCEST MRI are warranted that produce pixel-wise parametric maps of pHe within the tumor, to identify intratumoral regions that are acidic and pH-neutral. Pixel-wise pH maps may also provide for investigations of the acidoCEST MRI protocol, such as the influence of B0 inhomogeneities on CEST spectra. Furthermore, our acidoCEST MRI protocol images a single two-dimensional slice. Incorporating multi-slice CEST MRI techniques into an acidoCEST MRI protocol may further improve the evaluation of spatial heterogeneity of tumor pHe (42). In addition, we have not validated the accuracy of tumor pHe measurements using acidoCEST MRI because other methods that attempt to measure tumor pHe are difficult to implement, have their own measurement limitations, and their accuracies have also not been validated. Therefore, future studies are warranted to validate the accuracy of acidoCEST MRI measurements of in vivo pHe, when other ‘gold standard’ methods become available.
Our tumor pHe measurements with acidoCEST MRI demonstrated that the MDA-MB-231 subcutaneous tumor model used in this study had a range of extracellular acidities. This variability within the same mouse model indicates that genotype may not predict an acidic phenotype. Therefore, measurements of tumor pHe may be needed for each mouse or patient to establish the status of tumor acidosis for studies that investigate or depend on acidosis. However, our proof-of-principle study only used one tumor model, and similar tests with other subcutaneous and orthotopic tumor models are warranted to investigate this variability of acidosis in cancer biology.
Our tumor pHe measurements also showed that bicarbonate treatment alkalinized the acidic tumors, but did not change tumors that were classified as pH-neutral. For comparison, bicarbonate treatment alkalinized the bladders in all cases. This evidence indicates that bicarbonate should not be used as an anti-cancer treatment without prior knowledge of the acidic state of the tumor. Otherwise, treating patients with pH-neutral tumors may not affect the pHe of the tumor, and yet the patient risks alkalosis of normal organs such as the bladder (43). Clinical translation of acidoCEST MRI may provide an important diagnostic tool for patients who are considering the use of alkalinizing therapies.
AcidoCEST MRI has great potential for clinical translation and may provide an important diagnostic tool for patients who are considering the use of alkalinizing therapies. Iopromide is a clinically approved contrast agent. Our IV-infusion protocol delivers 3.3–4.6 grams of iodone per kilogram of mouse body weight (gI/Kg) to a mouse, based on a mouse body weight of 18–25 grams. Because pharmacokinetics scale between species when normalized to body surface area, the dose used in our study equates to Human Equivalent Dose of 0.27–0.37 gI/Kg. (44,45). This dose is 4- to 5.5-fold lower than the 1.5 gI/Kg maximum recommended total dose of iopromide for humans, which facilitates clinical translation of acidoCEST MRI. In addition, acidoCEST MRI uses a common FISP acquisition protocol that is also clinically approved. AcidoCEST MRI also uses a long, high-power saturation period, which is not currently approved for routine clinical use. However, long saturation periods with higher saturation powers have been successfully used for clinical imaging studies of solid tumors and other organs, including the brain (46,47). Based on the compelling evidence of our study that tumor pHe measurements may benefit treatment decisions for patients, clinical translation of acidoCEST MRI should be pursued.
Acknowledgments
This work was supported by the Phoenix Friends of the Arizona Cancer Center, the Community Foundation of Southern Arizona, and NIH grant 1R01CA167183. L.Q.C. was supported by the Anne Rita Monahan Foundation.
References
- 1.Warburg O. On metabolism of tumours. Constable; London, UK: 1930. [Google Scholar]
- 2.Gillies RJ, Gatenby RA. Hypoxia and adaptive landscapes in the evolution of carcinogenesis. Cancer Met Rev. 2007;26:311–317. doi: 10.1007/s10555-007-9065-z. [DOI] [PubMed] [Google Scholar]
- 3.Raghunand N, Gatenby RA, Gillies RJ. Microenvironmental and cellular consequences of altered blood flow in tumours. Brit J Radiol. 2003;76:S11–S22. doi: 10.1259/bjr/12913493. [DOI] [PubMed] [Google Scholar]
- 4.Gatenby RA, Gawlinski ET, Gmitro AF, Kaylor B, Gillies RJ. Acid-mediated tumor invasion: a multidisciplinary study. Cancer Res. 2006;66:5216–5223. doi: 10.1158/0008-5472.CAN-05-4193. [DOI] [PubMed] [Google Scholar]
- 5.Estrella V, Chen T, Lloyd M, Wojtkowiak, Cornnell HH, Ibrahim-Hashim A, Bailey K, Balagurunathan Y, Rothberg JM, Sloane BF, Johnson J, Gatenby RA, Gillies RJ. Acidity generated by the tumor microenvironment drives local invasion. Cancer Res. 2013;73:1524–1535. doi: 10.1158/0008-5472.CAN-12-2796. [DOI] [PMC free article] [PubMed] [Google Scholar]
- 6.Gatenby RA, Gillies RJ. Why do cancers have high aerobic glycolysis? Nat Rev Cancer. 2004;4:891–899. doi: 10.1038/nrc1478. [DOI] [PubMed] [Google Scholar]
- 7.Cairns R, Papandreou I, Denko N. Overcoming physiologic barriers to cancer treatment by molecularly targeting the tumor microenvironment. Mol Cancer Res. 2006;4:61–70. doi: 10.1158/1541-7786.MCR-06-0002. [DOI] [PubMed] [Google Scholar]
- 8.Gatenby RA, Gillies RJ. A microenvironmental model of carcinogenesis. Nat Rev Cancer. 2008;8:56–61. doi: 10.1038/nrc2255. [DOI] [PubMed] [Google Scholar]
- 9.Arcamone F, Franceschi G, Penco S, Selvia A. Adriamycin 14-hydroxydaunomycin: a novel antitumor antibiotic. Tet Lett. 1969;13:1007–1016. doi: 10.1016/s0040-4039(01)97723-8. [DOI] [PubMed] [Google Scholar]
- 10.Raghunand N, Gillies RJ. pH and drug resistance in tumors. Drug Resist Updates. 2002;3:39–47. doi: 10.1054/drup.2000.0119. [DOI] [PubMed] [Google Scholar]
- 11.Mahoney BP, Raghunand N, Baggett B, Gillies RJ. Tumor acidity, ion trapping and chemotherapeutics. I. Acid pH affects the distribution of chemotherapeutic agents in vitro. Biochem Pharmacol. 2003;66:1207–1218. doi: 10.1016/s0006-2952(03)00467-2. [DOI] [PubMed] [Google Scholar]
- 12.Raghunand N, Mahoney BP, Gillies RJ. Tumor acidity, ion trapping and chemotherapeutics. II. pH-dependent partition coefficients predict importance of ion trapping on pharmacokinetics of weakly basic chemotherapeutic agents. Biochem Pharmacol. 2003;66:1219–1229. doi: 10.1016/s0006-2952(03)00468-4. [DOI] [PubMed] [Google Scholar]
- 13.Fais S, De Milito A, You H, Qin W. Targeting vacuolar H+-ATPases as a new strategy against cancer. Cancer Res. 2007;67:10627–10630. doi: 10.1158/0008-5472.CAN-07-1805. [DOI] [PubMed] [Google Scholar]
- 14.De Milito A, Canese R, Marino ML, Borghi M, Iero M, et al. pH-dependent antitumor activity of proton pump inhibitors against human melanoma is mediated by inhibition of tumor acidity. Int J Cancer. 2010;127:207–219. doi: 10.1002/ijc.25009. [DOI] [PubMed] [Google Scholar]
- 15.Robey IF, Baggett BK, Kirkpatrick ND, Roe DJ, Dosescu J, et al. Bicarbonate increases tumor pH and inhibits spontaneous metastases. Cancer Res. 2009;69:2260–2268. doi: 10.1158/0008-5472.CAN-07-5575. [DOI] [PMC free article] [PubMed] [Google Scholar]
- 16.Martin NK, Gaffney EA, Gatenby RA, Gillies RJ, Robey IF, Maini PK. A mathematical model of tumour and blood pHe regulation: The HCO3-/CO2 buffering system. Math Biosci. 2011;230:1–11. doi: 10.1016/j.mbs.2010.12.002. [DOI] [PMC free article] [PubMed] [Google Scholar]
- 17.Silva AS, Yunes JA, Gillies RJ, Gatenby RA. The potential role of systemic buffers in reducing intratumoral extracellular pH and acid-mediated invasion. Cancer Res. 2009;69:2677–2684. doi: 10.1158/0008-5472.CAN-08-2394. [DOI] [PMC free article] [PubMed] [Google Scholar]
- 18.Mordon S, Devoisselle JM, Maunoury V. In vivo pH measurement and imaging of tumor tissue using a pH-sensitive fluorescent probe (5,6-carboxyfluorescein): instrumental and experimental studies. Photochem Photobiol. 1994;60:274–279. doi: 10.1111/j.1751-1097.1994.tb05104.x. [DOI] [PubMed] [Google Scholar]
- 19.Martin GR, Jain RK. Noninvasive measurement of interstitial pH profiles in normal and neoplastic tissue using fluorescence ratio imaging microscopy. Cancer Res. 1994;54:5670–5674. [PubMed] [Google Scholar]
- 20.Kearfott KJ, Junck L, Rottenberg DA. C-11 dimethyloxazolidinedione (DMO): biodistribution, radiation absorbed dose, and potential for PET measurement of regional brain pH: concise communication. J Nuc Med. 1983;24:805–811. [PubMed] [Google Scholar]
- 21.Vavere AL, Biddlecombe GB, Spees WM, Garbow JR, Wijesinghe D, Andreev OA, Engelman DM, Reshetnyak YK, Lewis JS. A novel technology for the imaging of acidic prostate tumors by positron emission tomography. Cancer Res. 2009;69:4510–4516. doi: 10.1158/0008-5472.CAN-08-3781. [DOI] [PMC free article] [PubMed] [Google Scholar]
- 22.Khramtsov VV, Grigor’ev IA, Foster MA, Lurie DJ, Nicholson I. Biological applications of spin pH probes. Cell Mol Biol. 2000;46:1361–1374. [PubMed] [Google Scholar]
- 23.Gillies RJ, Morse DL. In vivo magnetic resonance spectroscopy in cancer. Annual Rev Biomed Eng. 2005;7:287–326. doi: 10.1146/annurev.bioeng.7.060804.100411. [DOI] [PubMed] [Google Scholar]
- 24.Gallagher FA, Kettunen MI, Day SE, Hu DE, Ardenkjaer-Larsen JH, et al. Magnetic resonance imaging of pH in vivo using hyperpolarized 13C-labelled bicarbonate. Nature. 2008;453:940–943. doi: 10.1038/nature07017. [DOI] [PubMed] [Google Scholar]
- 25.Yoo B, Pagel MD. An overview of responsive MRI contrast agents for molecular imaging. Front Biosci. 2008;13:1733–1752. doi: 10.2741/2796. [DOI] [PubMed] [Google Scholar]
- 26.Martinez GV, Zhang X, García-Martín ML, Morse DL, Woods M, Sherry AD, Gillies RJ. Imaging the extracellular pH of tumors by MRI after injection of a single cocktail of T1 and T2 contrast agents. NMR Biomed. 2011;24:1380–1391. doi: 10.1002/nbm.1701. [DOI] [PMC free article] [PubMed] [Google Scholar]
- 27.Ward KM, Balaban RS. Determination of pH using water protons and chemical exchange dependent saturation transfer (CEST) Magn Reson Med. 2000;44:799–802. doi: 10.1002/1522-2594(200011)44:5<799::aid-mrm18>3.0.co;2-s. [DOI] [PubMed] [Google Scholar]
- 28.Liu G, Ali MM, Yoo B, Griswold MA, Tkach JA, Pagel MD. PARACEST MRI with improved temporal resolution. Magn Reson Med. 2009;61:399–408. doi: 10.1002/mrm.21863. [DOI] [PMC free article] [PubMed] [Google Scholar]
- 29.Grad J, Bryant RG. Nuclear magnetic cross-relaxation spectroscopy. J Magn Reson. 1990;90:1–8. doi: 10.1002/mrm.1910170216. [DOI] [PubMed] [Google Scholar]
- 30.Liu G, Li Y, Sheth VR, Pagel MD. Imaging in vivo extracellular pH with a single PARACEST MRI contrast agent. Molec Imag. 2012;11:47–57. [PMC free article] [PubMed] [Google Scholar]
- 31.Sheth VR, Li Y, Chen LQ, Howison CM, Flask CA, Pagel MD. Measuring in vivo tumor pHe with CEST-FISP MRI. Magn Reson Med. 2012;67:760–768. doi: 10.1002/mrm.23038. [DOI] [PMC free article] [PubMed] [Google Scholar]
- 32.Longo DL, Dastrù W, Digilio G, Keupp J, Langereis S, et al. Iopamidol as a responsive MRI-chemical exchange saturation transfer contrast agent for pH mapping of kidneys: In vivo studies in mice at 7 T. Magn Reson Med. 2010;65:202–211. doi: 10.1002/mrm.22608. [DOI] [PubMed] [Google Scholar]
- 33.Shah T, Lu L, Dell KM, Pagel MD, Griswold MA, Flask CA. CEST FISP: A novel technique for rapid chemical exchange saturation transfer MRI at 7 T. Magn Reson Med. 2011;65:432–437. doi: 10.1002/mrm.22637. [DOI] [PMC free article] [PubMed] [Google Scholar]
- 34.Sheth VR, Liu G, Li Y, Pagel MD. Improved pH measurements with a single PARACEST MRI contrast agent. Contrast Media Mol Imaging. 2012;7:26–34. doi: 10.1002/cmmi.460. [DOI] [PMC free article] [PubMed] [Google Scholar]
- 35.Abramoff MD, Magalhaes PJ, Ram SJ. Image Processing with ImageJ. Biophoton Int. 2004;11:36–42. [Google Scholar]
- 36.Stancanello J, Terreno E, Castelli DD, Cabella C, Uggeri F, Aime S. Development and validation of a smoothing-splines-based correction method for improving the analysis of CEST-MR images. Contrast Media Mol Imaging. 2008;3:136–149. doi: 10.1002/cmmi.240. [DOI] [PubMed] [Google Scholar]
- 37.Ali MM, Liu G, Shah T, Flask CA, Pagel MD. Using Two Chemical Exchange Saturation Transfer Magnetic Resonance Imaging Contrast Agents for Molecular Imaging Studies. Acc Chem Res. 2009;42:915–924. doi: 10.1021/ar8002738. [DOI] [PMC free article] [PubMed] [Google Scholar]
- 38.Woessner DE, Zhang S, Merritt ME, Sherry AD. Numerical solution of the Bloch equations provides insights into the optimum design of PARACEST agents for MRI. Magn Reson Med. 2005;53:790–799. doi: 10.1002/mrm.20408. [DOI] [PubMed] [Google Scholar]
- 39.Randtke EA, Chen LQ, Corrales RA, Pagel MD. The Hanes-Woolf Linear QUEST method provides the most accurate determination of fast chemical exchange rates for CEST MRI contrast agents. Magn Reson Med. 2013 doi: 10.1002/mrm.24792. in press. [DOI] [PMC free article] [PubMed] [Google Scholar]
- 40.Haacke EM, Brown RW, Thompson MR, Venkatesan R. Magnetic resonance imaging: physical principles and sequence design. Wiley-Liss; New York, NY: 1999. [Google Scholar]
- 41.Pagel MD. The hope and hype of multimodality imaging contrast agents. Nanomed. 2011;6:945–948. doi: 10.2217/nnm.11.63. [DOI] [PubMed] [Google Scholar]
- 42.Dixon WT, Hancu I, Ratnakar SJ, Sherry AD, Lenkinski RE, Alsop DC. A multislice gradient echo pulse sequence for CEST imaging. Magn Reson Med. 2010;63:253–256. doi: 10.1002/mrm.22193. [DOI] [PMC free article] [PubMed] [Google Scholar]
- 43.Martin NK, Robey IF, Gaffney EA, Gillies RJ, Gatenby RA, Maini PK. Predicting the safety and efficacy of buffer therapy to raise tumour pHe: an integrative modelling study. Br J Cancer. 2012;106(7):1280–7. doi: 10.1038/bjc.2012.58. [DOI] [PMC free article] [PubMed] [Google Scholar]
- 44.Guidance for Industry: Estimating the Maximum Safe Starting Dose in Initial Clinical Trials for Therapeutics in Adult Healthy Volunteers. U.S. Department of Health and Human Services Food and Drug Administration, Center for Drug Evaluation and Research (CDER); published July 2005. [Google Scholar]
- 45.Liu XD, Chen I. Prediction of drug clearance in humans from laboratory animals based on body surface area. Euro J Drug Metab Pharmacokinetics. 2001;26:249–256. doi: 10.1007/BF03226379. [DOI] [PubMed] [Google Scholar]
- 46.Sun PZ, Benner T, Kumar A, Sorensen AG. Investigation of optimizing and translating pH-sensitive pulsed-chemical exchange saturation transfer (CEST) imaging to a 3T clinical scanner. Magn Reson Med. 2008;60:834–841. doi: 10.1002/mrm.21714. [DOI] [PMC free article] [PubMed] [Google Scholar]
- 47.Zhou J, Blakeley JO, Hua J, Kim M, Laterra J, Pomper MG, van Zijl PC. Practical data acquisition method for human brain tumor amide proton transfer (APT) imaging. Magn Reson Med. 2008;60:842–849. doi: 10.1002/mrm.21712. [DOI] [PMC free article] [PubMed] [Google Scholar]