Abstract
Cadmium-incorporated Li2FeSiO4/C composites have been successfully synthesized by a solid-state reaction assisted with refluxing. The effect and mechanism of Cd-modification on the electrochemical performance of Li2FeSiO4/C were investigated in detail by X-ray powder diffraction, X-ray photoelectron spectroscopy, scanning electron microscopy, Raman spectra, transmission electron microscopy, positron annihilation lifetime spectroscopy and Doppler broadening spectrum, and electrochemical measurements. The results show that Cd not only exists in an amorphous state of CdO on the surface of LFS particles, but also enters into the crystal lattice of LFS. Positron annihilation lifetime spectroscopy and Doppler broadening spectrum analyses verify that Cd-incorporation increases the defect concentration and the electronic conductivity of LFS, thus improve the Li+-ion diffusion process. Furthermore, our electrochemical measurements verify that an appropriate amount of Cd-incorporation can achieve a satisfied electrochemical performance for LFS/C cathode material.
Polyoxyanion compounds (i.e., LiFePO4 and Li3V2(PO4)3) have become important alternative cathode materials due to their structural stability and safety1,2,3,4,5,6. Recently, a new class of polyoxyanion cathodes based on the orthosilicates, Li2MSiO4 (M = Mn, Fe, and Co) have been paid significant attention. Among of these orthosilicates, Li2FeSiO4 (LFS), with iron and silicon being among the most abundant and lowest cost elements, attracts the most interest7,8. In addition, compared with LiFePO4 and Li3V2(PO4)3, LFS has higher theoretical capacity (166/332 mAh g−1 for one/two Li+ intercalation/deintercalation, respectively)9,10,11. However, its low electronic conductivity and slow lithium ion diffusion makes the insertion/extraction of both two lithium ions into/from the lattice difficult10,11. Much effort has been made to improve the electrochemical performance of LFS, such as incorporating conductive carbon10,12,13,14,15,16,17, reducing particle size18,19,20,21, and doping metal ion22,23,24,25,26,27,28,29. The positive effect of Cd-incorporation on the electrochemical performance of some cathode materials (i.e., LiFePO4 and LiCoO2) has been confirmed in previous works30,31, however, there is no report about Cd-modification for LFS so far. Furthermore, it is still controversial whether metal ion is doped into the crystal structure or exists in the form of metallic oxide32,33,34,35,36. As is known to all, X-ray photoelectron spectroscopy (XPS) is an important surface analysis technique. Besides, the information of component elements in the interior of samples can be also obtained through argon ion sputtering. In our previous work6,37, we have verified SiO2-coated on the surface but Fe-doped into the lattice of Li3V2(PO4)3 by using XPS analysis combined with Ar-ion sputtering. If doping, defects (i.e., cavities, cavity, and pores etc.) in solid materials can easily form. Positron annihilation technique (PAT) is an effective method to analyze the defects induced by doping38,39.
In the present work, we prepared a series of Cd-modified Li2FeSiO4/C composites via a solid-state reaction assisted with refluxing. The physicochemical properties and electrochemical performance were studied by using X-ray diffraction (XRD), scanning electron microscopy (SEM), transmission electron microscopy (TEM), Raman spectroscopy, and electrochemical measurements. The nature of Cd-incorporation in Li2FeSiO4 was investigated by XPS and PAT.
Results and Discussion
Characterization of the obtained LFS samples
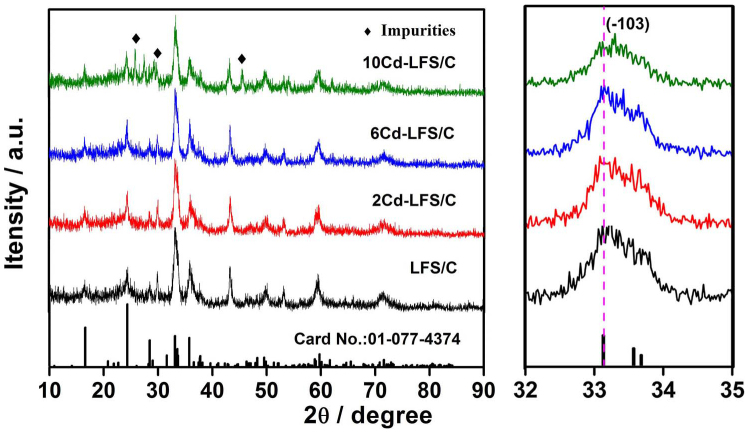
Figure 1 shows the XRD patterns of LFS/C and Cd-modified LFS/C samples. As seen in Fig. 1, although there are some weak peaks for impurities (i.e., Li2SiO3, Fe2O3, etc.), all the XRD patterns of Cd-modified LFS/C composites are similar to that of pristine LFS/C, and can be well indexed to monoclinic structure of LFS with a space group of P21. To study the effect of Cd-doping on the lattice structure of LFS, we pay attention to the XRD patterns between 32° and 35° (the right panel of Fig. 1). No observable peak shift happens, which should be attributed to low content of Cd in the final products. Actually, estimated by atomic absorption spectrophotometry (AAS, AA240FS, Agilent Technologies), only 0.003, 0.02 and 0.22 wt% Cd can be detected after thermal treatment in 2Cd-LFS/C, 6Cd-LFS/C and 10Cd-LFS/C, respectively. A full Rietveld refinement was carried out on LFS/C and 6Cd-LFS/C samples, and the refined lattice parameters and atomic coordination are listed in Tables 1 and 2. The best refinement model was chosen from a P21 space group. Because the reliability factor of sig is less than 2, and Rw is less than 15% (For LFS/C, the reliable factors are Rw = 9.27%, sig = 1.29; and for 6Cd-LFS/C, the reliable factors are Rw = 13.52%, sig = 1.38), the Rietveld refinement results are reliable in the following analysis of crystal structure. As shown in Table 1, the unit cell volume decreases after Cd-incorporation, but the cell volume change with the Cd-incorporation cannot be fully explained by the atom size difference by lack of some information about the exist condition of Cd (i.e., coating, doping, or coating-doping co-modification). So, we employed XPS and PAT measurements for further analysis, as discussed later.
Figure 1. XRD patterns of the as-prepared samples.
Table 1. Lattice parameters of LFS/C and 6Cd-LFS/C.
| Sample | a (Å) | b (Å) | c (Å) | V (Å3) |
|---|---|---|---|---|
| LFS/C | 8.3230 | 4.9884 | 8.2150 | 341.0741 |
| 6Cd-LFS/C | 8.2201 | 4.9803 | 8.2227 | 336.6255 |
Table 2. Atomic fractional coordinates of LFS/C and 6Cd-LFS/C.
| x | y | z | ||||
|---|---|---|---|---|---|---|
| Atom | LFS/C | 6Cd-LFS/C | LFS/C | 6Cd-LFS/C | LFS/C | 6Cd-LFS/C |
| Li1 | 0.6828 | 0.6691 | 0.7911 | 0.7100 | 0.6575 | 0.6666 |
| Li2 | 0.5821 | 0.5907 | 0.3963 | 0.4037 | 0.1059 | 0.1096 |
| Fe1 | 0.2883 | 0.2850 | 0.8193 | 0.8227 | 0.5441 | 0.5453 |
| Si1 | 0.0106 | 0.0025 | 0.8132 | 0.8207 | 0.7745 | 0.7721 |
| O1 | 0.8513 | 0.8499 | 0.7953 | 0.7605 | 0.8356 | 0.8294 |
| O2 | 0.3757 | 0.3811 | 0.1654 | 0.1479 | 0.8983 | 0.9135 |
| O3 | 0.7341 | 0.7376 | 0.7480 | 0.7450 | 0.4402 | 0.4392 |
| O4 | 1.0164 | 0.9969 | 0.7133 | 0.7017 | 0.1979 | 0.1960 |
Furthermore, it is worth mentioning that no diffraction peaks from carbon and any Cd-containing composite are detected, demonstrating that the carbon yielded from pyrolysis of sucrose is amorphous, and the content of Cd is too low to be detected or Cd exists in the form of amorphous. The measured residual carbon contents in LFS/C, 2Cd-LFS/C, 6Cd-LFS/C and 10Cd-LFS/C are 10.3, 10.2, 9.3 and 8.7 wt.%, respectively.
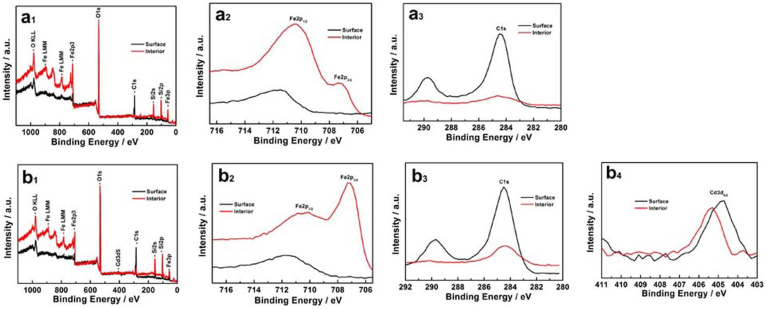
XPS spectra are used to investigate the oxidation state of component elements in samples; and with argon ion sputtering, it can also be used to detect the distribution of component elements at the surface or in the interior of samples6,37. Fig. 2 is the XPS spectra of LFS/C and 6Cd-LFS/C. Herein, the scale of binding energy (BE) in the obtained XPS spectra (Fig. 2) is referenced by setting the BE of C1s to 284.5 eV. As shown in Fig. 2a2 and 2b2, Fe2p main peaks of the two samples are weaker at the surface but stronger in the interior, which indicates that there are some chemicals (i.e., carbon and CdO) coated at the surface of both samples. For 6Cd-LFS/C, the binding energies at ~711 eV of Fe2p1/2 and ~707 eV of Fe2p3/2 are very close to those for LFS/C, which demonstrates that the oxidation state of Fe in both samples is +2, and Cd incorporation does not change the valence state of Fe element in LFS. From Figs. 2a3 and 2b3, it is clearly seen that the intensity of C1s main peaks at the surface is much higher than that in the interior, indicating that carbon only is coated on the surface of LFS particles. With Ar-ion sputtering, the obtained XPS spectra mainly reflect the relative information in the interior of samples. Consequently, we can determine whether Cd is doped into the lattice of LFS or coated on the surface of LFS particles. For instance, the Cd3d5/2 main peaks (Fig. 2b4) appear not only at the surface but also in the interior of the 6Cd-LFS/C sample. Hence, it is reasonable to assume, in addition to existing in the form of CdO on the surface, Cd is doped into the crystal lattice of LFS caused by molecular diffusion during the sintering process. The existence of CdO on the surface can effectively decrease charge-transfer resistance and increase electronic conductivity30, and another part of Cd doped into the crystal lattice of LFS may cause changes of defects in LFS structure, which will be discussed in the following PALS and DBS analysis. Moreover, the binding energy of Cd3d5/2 main peaks around 405 eV represents the oxidation state of Cd is +2, which is in good agreement with the valence of Cd in the CdO composite.
Figure 2. XPS spectra of (a) LFS/C, and (b) 6Cd-LFS/C.
Positron annihilation technique (PAT) is a powerful tool to study defects in solids, which can provide useful information about the size, type, and relative density of various defects and/or vacancies38,39,40,41,42. To investigate the effect of Cd-incorporation on the LFS lattice structure, Positron annihilation lifetime spectroscopy (PALS) and Doppler broadening spectrum (DBS) measurements were further performed for both LFS/C and Cd-LFS/C. As shown in Table 3, three lifetime components t1, t2 and t3, with relative intensities I1, I2 and I3, are observed for the two samples. The longest component t3 should be attributed to the annihilation of orthopositronium atoms formed in the large voids in the material or caused by surface effect of the material40,41, and the relative intensity I3 is the weakest (<4%), so it will not be discussed in the present work. The shortest component t1 should be attributed to the free annihilation of positrons in defect-free crystal and those trapped by small defects40. However, the small defects are not major positron traps and their correlation with material properties is not conclusive42. The component t2 results from the trapping state annihilation in imperfect crystal (especially large defects), which relative intensity I2 quantifies the abundance of defects40,41. From Table 3, we can clearly see that, for the two samples, the intensity distribution of I1 and I2 is close to 50%, which demonstrates that the positron annihilation mechanism is not single, i.e., the annihilation occurs not only in the interior of the grains, but also in the defect position (such as vacancies, pores and cavities, etc.). For both samples, t2 is much longer than t1, indicative of the existence of large defects. Noting that, after Cd-incorporation, the ratio of I2 to I1 increases from 0.82 to 1.26, which reflect that the defect capture is the main annihilation mechanism. Additionally, compared with LFS/C, the positrons annihilation lifetime t1 for 6Cd-LFS/C becomes shorter. We can reasonably infer that Cd2+ enters into the lattice of LFS. A possibility is that, due to the Cd-incorporation into the stoichiometric Li2FeSiO4 lattice, some Fe-containing impurity phases would be formed to keep the charge balance. Another possibility is that, there's a chance for Fe2+ to occur at grain boundaries in Li2FeSiO4 crystal lattice, thus forming interstitial cation; or Cd2+ occurs at grain boundaries; or Cd2+ occupies at Fe-site. Considering the stability of SiO4 tetrahedra, it is difficult to form an oxygen vacancy; instead, vacancies in the Li crystallographic sites would be formed to keep the charge balance. Li vacancies may contribute to intrinsic ionic conductivity, thereby leading to an improved electrochemical performance43. Meanwhile, Li vacancies may also interpret the decrease of the unit cell volume. As we known, the decrease in t2 mainly results from the decrease in defect size. For 6Cd-LFS/C, the t2 decrease should attribute to the decreased defect volume, which is induced by the substitution of Cd2+ (radius: 0.097 nm) for Fe2+ (radius: 0.074 nm); the enhancement in I2 is related to the increased defect concentration, which is more conducive for Li+ ions diffusion. It is generally known that the probability of positron annihilation in solid materials is in proportion to electron density, but is inversely proportional to positron annihilation lifetime. That is to say, the shorter the positron annihilation lifetime, the higher the electron density is40. Higher electron density means higher electronic conductivity. As shown in Table 3, compared with LFS/C, 6Cd-LFS/C exhibits shorter t1 and t2, thus, 6Cd-LFS/C has higher electronic conductivity, which agrees well with the test results of electronic conductivity (i.e., 5.3 × 10⁻⁴ S cm−1 for 6Cd-LFS/C, but 2.8 × 10⁻⁴ S cm−1 for LFS/C). DBS is sensitive to lattice defects, so DBS measurements were performed at the same time. The S parameters and the W parameters calculated from DBS of the samples are listed in Table 4. The S parameter comes from positron annihilations with valence electrons and conduction electron in the low-momentum region, the W parameter reflects the positron annihilations with core electrons in the high-momentum region. Thus, the S parameter conveys the information of the positron annihilated with defects, and the W parameter represents characteristic signals of the elements. As shown in Table 4, it can be clearly seen that after Cd-incorporation, the S parameter is decreased. Considering the intensity distribution of I1 and I2 is close to 50%, the positron annihilations may happen at the surface defects, so the decreased S parameter can attribute to the CdO-coating. Meanwhile, the decreased S parameter leads to an increased W parameter.
Table 3. Positron annihilation lifetime and relative intensity of LFS/C and 6Cd-LFS/C.
| Sample | t1 (ps) | I1 (%) | t2 (ps) | I2 (%) | t3 (ps) | I3 (%) |
|---|---|---|---|---|---|---|
| LFS/C | 213.2 ± 2.9 | 53.21 | 413.3 ± 4.2 | 43.26 | 2203 ± 1.7 | 3.53 |
| 6Cd-LFS/C | 196.1 ± 4.8 | 43.70 | 373.7 ± 5.0 | 55.00 | 2276 ± 5.7 | 1.28 |
Table 4. S parameters and W parameters of LFS/C and 6Cd-LFS/C.
| Sample | S | W |
|---|---|---|
| LFS/C | 0.496243 | 0.0174059 |
| 6Cd-LFS/C | 0.490362 | 0.0181682 |
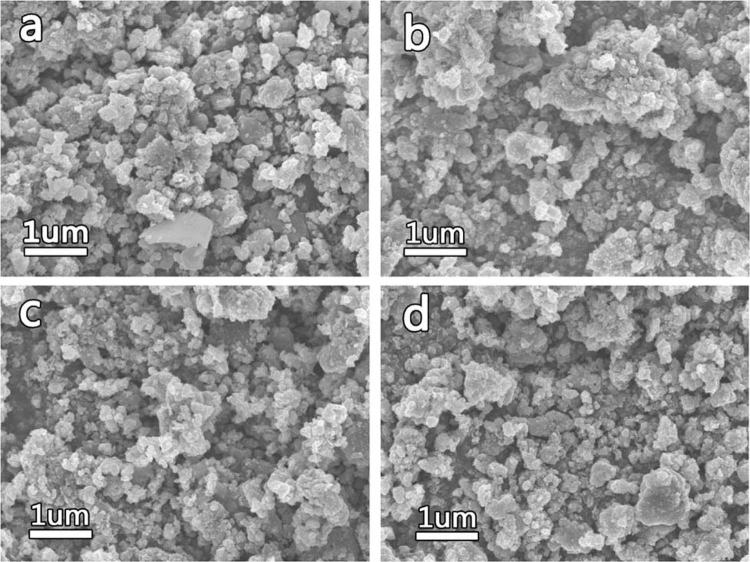
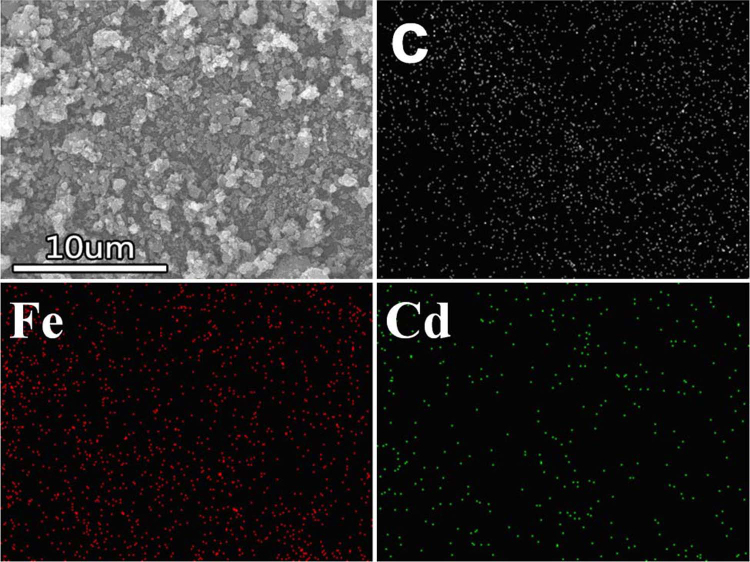
Figure 3 shows the SEM images of LFS/C and three Cd-modified LFS/C samples. All the samples are composed of agglomerated particles with a small size of 100 ~ 200 nm. There is no significant difference in morphology between the four samples. To investigate the distribution of key elements (C, Fe, and Cd) in 6Cd-LFS/C particles, the elemental mapping of species was explored by EDX. As displayed in Fig. 4, all the three elements (C, Fe, and Cd) show homogeneous distribution, which demonstrates that these elements are uniformly distributed in the 6Cd-LFS/C sample.
Figure 3. SEM images of (a) LFS/C, (b) 2Cd-LFS/C, (c) 6Cd-LFS/C, and (d) 10Cd-LFS/C.
Figure 4. The EDX mapping of the 6Cd-LFS/C sample.
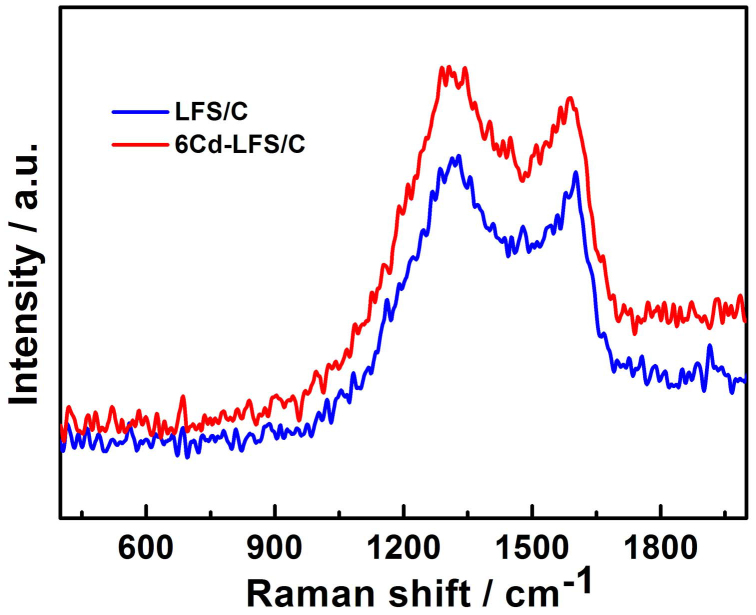
Raman spectra were used to check the carbon coating of LFS/C and 6Cd-LFS/C samples. As shown in Fig. 5, both samples have two intense broad bands (~1310 and 1590 cm−1), which can be assigned to the disordered (D) and graphene (G) bands of carbon, respectively. There is no significant difference on the position of D and G bands between both samples. The lower intensity ratio of D to G band, the higher the electronic conductivity of the residual carbon is3. From Table 5, it is found that the intensity ratio of D to G band changes slightly, which demonstrates that the enhanced electronic conductivity of 6Cd-LFS/C sample is ascribed not to carbon coating, but to Cd incorporation. Moreover, as seen in Fig. 5, the small intensity ratios of SiO4 (~550 and 900 cm−1, assigned to internal bending and stretching vibrations of the SiO4-tetrahedra, respectively44,45.) and carbon bands for the two composites indicate a uniform carbon coating on the surface of LFS particles, which agrees well with the results of the elemental mapping shown in Fig. 4.
Figure 5. Raman spectra of LFS/C and 6Cd-LFS/C.
Table 5. ID/IG obtained from Raman spectra of LFS/C and 6Cd-LFS/C.
| Sample | LFS/C | 6Cd-LFS/C |
|---|---|---|
| ID/IG | 2.30 | 2.34 |
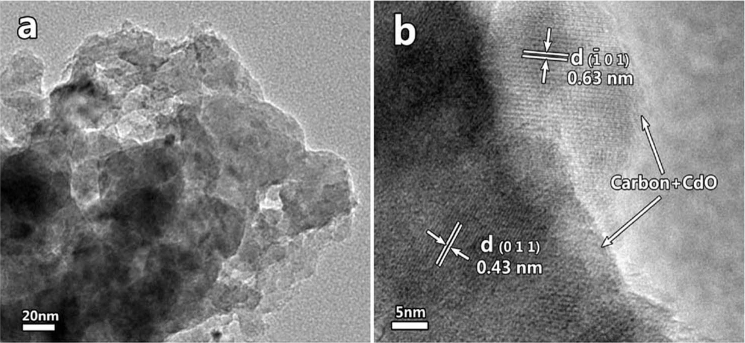
The morphology and structure of 6Cd-LFS/C powder were further confirmed by TEM and HRTEM (Fig. 6). Combined with the results of XRD, XPS and PALS, it is reasonable to believe that 6Cd-LFS/C particles are wrapped and/or connected with a mixed layer combined by amorphous carbon and CdO. The thickness of the layer is about 2 ~ 5 nm (Fig. 6b). The clear crystal planes with a d-spacing of 0.43 nm corresponding to the (011) planes and a d-spacing of 0.63 nm to the (-101) planes for 6Cd-LFS/C) in Fig. 6b demonstrate that 6Cd-LFS/C with high crystallinity is obtained after sintering at 650°C for 10 h.
Figure 6. TEM images of the 6Cd-LFS/C sample.
Electrochemical properties of LFS
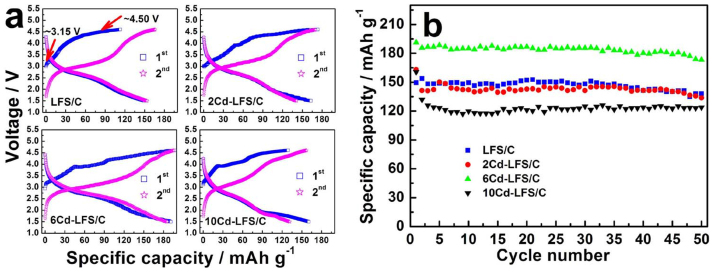
The first two charge/discharge curves of LFS/C, 2Cd-LFS/C, 6Cd-LFS/C and 10Cd-LFS/C samples are shown in Fig. 7. Both charge and discharge processes are conducted with a current rate of 0.1 C in a voltage range of 1.5 ~ 4.6 V at room temperature. As shown in Fig. 7a, two potential plateaus, located at ~3.15 V and ~4.50 V, can be observed in the initial charge curves for the four samples, which is in good agreement with previous reports11,13,14,46,47. The first potential plateau at ~3.15 V is very narrow, corresponding to the Fe2+/Fe3+ redox couple48. However, except for 6Cd-LFS/C electrode, the other three electrodes exhibit less obvious potential plateau at ~3.15 V13,47, which is due to the polarization. Subsequently, the potential plateau at ~3.15 V shifts to a lower but broad potential plateau in the second charge process, indicative of a structural rearrangement48,49. The second voltage plateau at ~4.50 V, disappeared in the second charge process, is indicative of the Fe3+/Fe4+ redox couple proved by D. Lv et al.45 From Fig. 7a, it can be also clearly seen that, for 6Cd-LFS/C, the voltage difference in plateaus between charge and discharge process is the smallest, indicative of the lowest polarization. In both cases, the capacity decreases within the first few cycles and then becomes stable in the subsequent cycles, which is due to the gradual penetration of electrolyte into the electrode and the structural stability of LFS when cycled between 1.5 V and 4.6 V, respectively. From Fig. 7, it can be obviously seen that 6Cd-LFS/C exhibits the highest initial charge/discharge specific capacity of 197.5/191.3 mAh g−1 with an excellent coulombic efficiency of 96.9%, and its average specific capacity for 40 cycles remains 185.1 mAh g−1, corresponding to more than one Li+ intercalation/deintercalation; while 10Cd-LFS/C delivers the lowest average capacity of 122.9 mAh g−1, and 2Cd-LFS/C shows a little lower average capacity of 143.6 mAh g−1 than the pristine LFS/C (148.6 mAh g−1). The results demonstrate that only an appropriate amount of Cd-incorporation into LFS/C cathode material can obtain better electrochemical performance.
Figure 7. (a) The first two charge/discharge curves, and (b) Cycling performance of the as-prepared samples at 0.1 C.
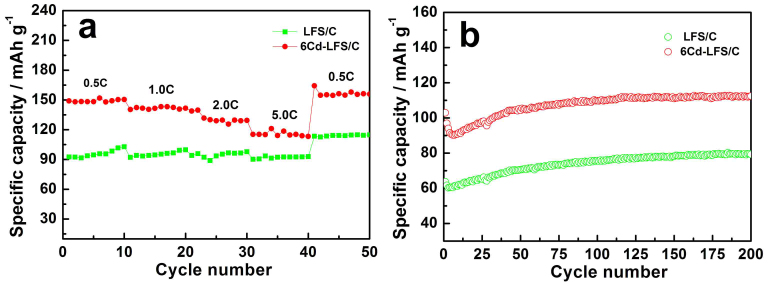
Figure 8a shows the rate capability for LFS/C and 6Cd-LFS/C. The data were obtained by testing in a mode that the cell was charged at a low current density of 0.1 C (1 C = 166 mA g−1) to 4.6 V and discharged at different rates (0.5 C, 1 C, 2 C, 5 C and 0.5 C) to 1.5 V, and the cell ran for 10 cycles at each current density. In all cases, 6Cd-LFS/C delivers higher capacity than other LFS/C samples. In addition, to compare the cycling performance of 6Cd-doped LFS/C and LFS/C, the two electrodes were also charged/discharged at 3 C in the voltage range of 1.5 ~ 4.6 V (Fig. 8b). For both samples, the capacity decreases within the initial several cycles, then increases and tends towards stability in the following cycles. Both the decrease and the increase in capacity during the early cycles result from the gradual penetration of electrolyte into the electrode, and the stability of capacity in the subsequent cycles represents the structural stability of LFS when cycled between1.5 V and 4.6 V. After 200 cycling, 6Cd-LFS/C still delivers a discharge capacity about 112.4 mAh g−1, which is much higher than LFS/C (79.3 mAh g−1). Obviously, Cd-modification with an optimal incorporating amount of 6 wt.% has remarkable influence not only on the capacity at any C-rate, but also on the cycling stability of LFS/C.
Figure 8. (a) Comparison of discharge capacity between LFS/C and 6Cd-LFS/C at different C-rate, and (b) Cycling performance of LFS/C and 6Cd-LFS/C at 3 C.
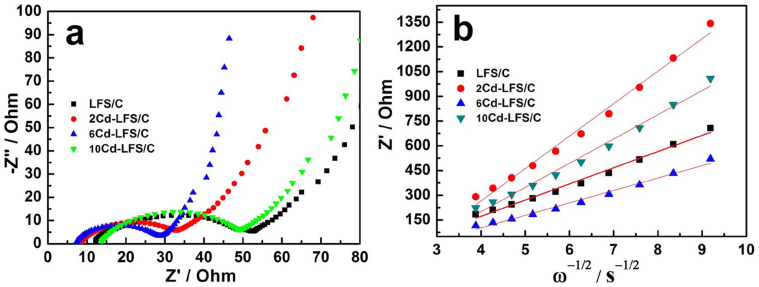
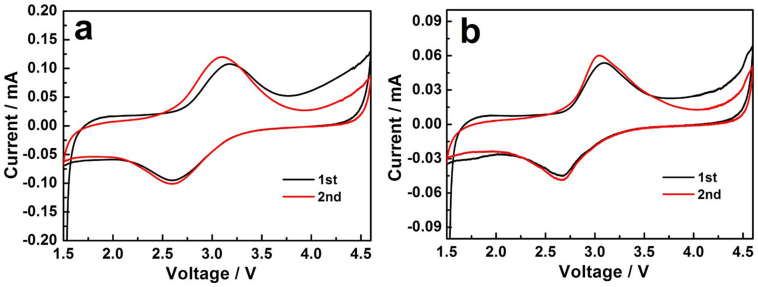
To investigate the effect of Cd on electrochemical performance of LFS and the corresponding dynamic behavior, the electrochemical impedance spectra (EIS) and cyclic voltammetry (CV) of the pristine and Cd-modified LFS/C samples are shown in Figs. 9 and 10, respectively. As can be seen in Fig. 9, all the EIS profiles exhibit a small intercept in the high frequency region, a depressed semicircle in the medium frequency region, and a straight sloping line in the low frequency region. The small intercept corresponds to the resistance of the electrolyte, the depressed semicircle is related to the charge transfer resistance and the double-layer capacitance between the electrolyte and cathode, and the inclined line is associated with lithium ion diffusion in the cathode active particles. In general, the double-layer capacitance between the electrolyte and cathode is small, so the diameter of the semicircle is approximately equal to the charge transfer resistance. The lower the charge-transfer resistance, the faster the kinetics of the cell reactions is. It is clear that 6Cd-LFS/C shows the lowest charge-transfer resistance, indicative of a faster kinetics in electrochemical reactions. Additionally, Li+ ion diffusion in the cathode materials can be calculated from the relationship between Z′ and the reciprocal square root of the lower angular frequencies (ω−1/2)10,50,51. The Li+ ion diffusion coefficient for the four samples are listed in Table 6. It can be seen that the lithium ion diffusion coefficient for 6Cd-LFS/C is higher than those of other samples, but the Li+ ion diffusion coefficient for 2Cd-LFS/C and 10Cd-LFS/C is lower than that for pristine LFS/C. This result is coordinated with the charge-transfer resistance, which indicates that the lithium ion mobility of LFS/C can be effectively improved by a suitable Cd incorporation (6 wt.%). CV curves are shown in Fig. 10. Obviously, the 6Cd-LFS/C electrode displays a same shape of CV curve as the pristine LFS/C electrode, demonstrating that the electrochemical behavior of LFS does not change after Cd-incorporation. Two anodic peaks around 3.09 ~ 3.18 V and ~4.50 V during the first charging process correspond to the successive two steps of oxidation of Fe2+ → Fe3+ → Fe4+ 11. For both samples, during the second charging process, the anodic peak corresponding to the oxidation of Fe2+ → Fe3+ shifts to 3.04 ~ 3.10 V, which is related to the structural rearrangement48,49. The anodic peak shifts agree well with the results in Fig. 7a. As listed in Table 7, the voltage difference between anodic and cathodic peaks for 6Cd-LFS/C (0.415 V) is smaller than that for LFS/C (0.580 V), indicative of enhanced electrode reaction reversibility. This can explain why 6Cd-LFS/C exhibits better electrochemical performance.
Figure 9. (a) EIS profiles, and (b) the relationship between Z′ and ω−1/2 in the low-frequency range of the as-prepared samples.
Figure 10. CV curves of LFS/C and 6Cd-LFS/C electrodes.
Table 6. Lithium ion diffusion coefficient (DLi) for the as-prepared samples.
| Sample | LFS/C | 2Cd-LFS/C | 6Cd-LFS/C | 10Cd-LFS/C |
|---|---|---|---|---|
| DLi (cm2 s−1) | 1.5 × 10⁻¹² | 3.9 × 10⁻¹³ | 2.6 × 10⁻¹² | 6.9 × 10⁻¹³ |
Table 7. Voltage difference between anodic and cathodic peaks for the first cycle.
| Sample | Ua (V) | Uc (V) | Ua-Uc (V) |
|---|---|---|---|
| LFS/C | 3.175 | 2.595 | 0.580 |
| 6Cd-LFS/C | 3.093 | 2.678 | 0.415 |
In summary, Cd-modified Li2FeSiO4/C composites were successfully synthesized via a solid-state reaction assisted with refluxing. Though a trace of impurities are observed in the XRD patterns of the Cd-modified Li2FeSiO4/C composites, it does not change the monoclinic structure of LFS and the valence state of Fe element in LFS. XPS results reveal that Cd not only exists in the form of amorphous CdO on the surface of LFS particles, but also enters into the crystal lattice of LFS. PALS and DBS analyses demonstrate that the defect capture is the main annihilation mechanism in Cd-modified LFS/C material, and interstitial cation or Li vacancies are formed. Cd-incorporation can increase the defect concentration and the electronic conductivity of LFS, thus improve the Li+-ion diffusion process. Electrochemical measurements verify that the as-obtained 6Cd-LFS/C exhibits the highest initial discharge specific capacity of 191.3 mAh g−1 with an excellent coulombic efficiency of 96.9%, and its average specific capacity for 40 cycles remains 185.1 mAh g−1. After 200 cycling at 3C, the 6Cd-LFS/C electrode still delivers a desirable capacity about 112.4 mAh g−1. The enhanced electrochemical performance can be attributed to the increased defect concentration, the improved electronic conductivity, the decreased charge transfer resistance, and the improved Li+-ion diffusion coefficient.
Methods
Synthesis and characterization of samples
Pristine and Cd-modified Li2FeSiO4/C composites were synthesized via a solid-state reaction assisted with refluxing as described elsewhere52. To prepare pristine Li2FeSiO4/C, lithium acetate, ferrous oxalate and tetraethyl orthosilicate in stoichiometric molar ratio of 2:1:1 were successively dissolved in ethanol. The above solution was stirred sufficiently, and then transferred to the reflux system. The above mixture was maintained at 80°C for 24 h. After evaporating (ethanol) and vacuum drying, the obtained dry gel was mixed with a certain amount of sucrose in acetone by ball-milling. The resulting precursor was dried at 50°C, and then calcined at 350°C for 5 h, followed by being sintered at 650°C for 10 h in nitrogen atmosphere to obtain the pristine Li2FeSiO4/C powder. Cd-modified Li2FeSiO4/C samples were synthesized according the following procedure: LFS/C powder was firstly dispersed in a progressive amount of ethanol solution with the concentration of cadmium acetate being ca. 2, 6 and 10 wt.% of LFS/C powder, respectively, by ultrasonic method for 2 h. Then, the mixture was magnetically stirred till dry. Subsequently, the precursor was calcined at 600°C for 5 h in nitrogen atmosphere, and then the Cd-modified Li2FeSiO4/C composites were obtained. The pristine Li2FeSiO4/C and the Cd-modified Li2FeSiO4/C samples with 2, 6, and 10 wt.% cadmium acetate are denoted LFS/C, 2Cd-LFS/C, 6Cd-LFS/C, and 10Cd-LFS/C, respectively.
Carbon coating in the four LFS/C samples was characterized by Raman spectrometry (VERTEX 70, Bruker), and carbon content was determined by a carbon sulfur analyzer (CS600, LECO, US). Both pristine and Cd-modified LFS/C powders were pressed into disk-shaped pellets with diameter of 8 mm and thickness of about 1.0 mm, and the electronic conductivity was measured by a standard four-probe method with RTS resistivity measurement system (RTS-8, China).
XRD patterns were obtained using X-ray powder diffraction (Rigaku Ultima IV) with Cu-kα radiation (λ = 1.5406 Å). Rietveld refinement was performed on the XRD data by using the software Maud to obtain the crystal structure parameters53,54,55.The morphology was obtained with a field-scanning electron microscope (FSEM, JSM-7500F, JEOL) and a transmission electron microscope (TEM, JEM-2100, JEOL). The oxidation state of Fe and Cd in LFS/C and 6Cd-LFS/C samples was studied by XPS (PHI Quantera, U-P). In order to investigate the distribution of key elements (Fe, C, and Cd) not only at the surface but also in the interior of the samples, argon ion sputtering was also used in XPS analysis. Additionally, positron annihilation lifetime spectroscopy (PALS) and Doppler broadening spectrum (DBS) measurements were performed by using the high resolution positron annihilation lifetime spectrometer at Institute of High Energy Physics, Chinese Academy of Sciences, Beijing, China. Positron annihilation lifetime spectroscopy was carried out by using an ORTEC fast-slow coincidence system with a BaF2 as the detector with a time resolution of 198 ps. The sample powder was pressed into a disk (diameter: 8 mm, thickness: ~1.0 mm). 22Na was chosen as the positron source and sandwiched between two identical sample disks. The total coincidence events were accumulated to over 2.0 × 10⁶ for each spectrum. A fitting software LT9.0 was used to analyze the obtained spectra. Doppler broadening spectrum (DBS) was also performed by using a single high-purity Ge detector which energy resolution was 1.3 keV. The total energy region of the peak ranged from 499.15 to 522.85 keV. The energy region of the S parameter ranged from 510.20 to 511.80 keV, while the W parameter ranged from 514.3 to 518.7 and from 503.3 to 507.7 keV.
Assembly of cells and electrochemical measurements
The working electrodes were prepared by mixing active materials (LFS/C, 2Cd-LFS/C, 6Cd-LFS/C, and 10Cd-LFS/C, respectively) with PVDF and acetylene black in a weight ratio of 75:15:10 in N-methyl pyrrolidinone solvent. The mixed slurry was coated onto an aluminum foil (20 μm in thickness) using an automatic film-coating equipment. The resulting film was dried under an infrared light to vaporize volatile solvent, punched into disks (14 mm), and then pressed under a pressure of 6 MPa. After drying at 120°C for 12 h in vacuum, the disk was transferred into an argon-filled glove box (Super 1220/750, Mikrouna). The mass loading of the active materials on the electrode was about 1.8 mg cm−2. 2025 coin cells were assembled using Celgard 2400 as the separator and lithium foil as counter and reference electrodes. A solution of 1 mol L−1 LiPF6 in EC/DMC (LB-301, China) was employed as electrolyte. Galvanostatic charge/discharge measurements were performed between 1.5 V and 4.6 V at room temperature on a cell testing system (LAND CT2001A, China). EIS and CV measurements were performed on an electrochemical working station (CHI614C, China). EIS spectra were obtained over a frequency range from 0.01 Hz to 100 kHz, and CVs were tested at a scanning rate of 0.1 mV s−1 within a voltage range of 1.5–4.6 V.
Author Contributions
L.L.Z. directed the research. L.L.Z., S.D. and M.L. performed the experiments and characterizations. L.L.Z. and S.D. wrote the manuscript and prepared the Figures. L.L.Z., X.L.Y. and Y.H.H. contributed to the mechanism analysis. G.L. performed the X-ray photoelectron spectroscopy measurement. X.Z.C. and J.Y. contributed to the positron annihilation lifetime spectroscopy and Doppler broadening spectrum analysis. L.L.Z. and S.B.N. contributed to TEM analysis. All the authors contributed toward the technical discussions of results and reviewed the paper.
Acknowledgments
This work was supported by the National Science Foundation of China (51302153, 51302152, 51272128); the Key Project of Hubei Provincial Department of Education (D20131303); the Opening Project of CAS Key Laboratory of Materials for Energy Conversion (CKEM131404); the Pew Foundation of Master Dissertation of China Three Gorges University (2013PY024); and the Faculty Research Grant (FRG) from Sam Houston State University. Moreover, the authors are grateful to Dr. Jianlin Li at Three Gorges University for his kind support to our research.
References
- Padhi A. K., Nanjundaswamy K. S. & Goodenough J. B. Phospho-olivines as positive-electrode materials for rechargeable lithium batteries. J. Electrochem. Soc. 144, 1188–1194 (1997). [Google Scholar]
- Sun C., Rajasekhara S., Dong Y. & Goodenough J. B. Hydrothermal synthesis and electrochemical properties of Li3V2(PO4)3/C-based composites for lithium-ion batteries. ACS Appl. Mater. Interfaces 3, 3772–3776 (2011). [DOI] [PubMed] [Google Scholar]
- Zhang L. L. et al. Evolution of electrochemical performance in Li3V2(PO4)3/C composites caused by cation incorporation. Electrochim. Acta 108, 182–190 (2013). [Google Scholar]
- Saïdi M. Y., Barker J., Huang H., Swoyer J. L. & Adamson G. Electrochemical properties of lithium vanadium phosphate as a cathode material for lithium-ion batteries. Electrochem. Solid State Lett. 5–7, A149–151 (2002). [Google Scholar]
- Huang H., Yin S. C., Kerr T., Taylor N. & Nazar L. F. Nanostructured composites: a high capacity, fast rate Li3V2(PO4)3/carbon cathode for rechargeable lithium batteries. Adv. Mater. 14, 1525–1528 (2002). [Google Scholar]
- Zhang L. L. et al. Significantly improved electrochemical performance in Li3V2(PO4)3/C promoted by SiO2 coating for lithium ion batteries. J. Phys. Chem. C 116, 12401–12408 (2012). [Google Scholar]
- Islam M. S. et al. Silicate cathodes for lithium batteries: alternatives to phosphates? J. Mater. Chem. 21, 9811–9818 (2011). [Google Scholar]
- Nytén A., Abouimrane A., Armand M., Gustafsson T. & Thomas J. O. Electrochemical performance of Li2FeSiO4 as a new Li-battery cathode material. Electrochem. Commun. 7, 156–160 (2005). [Google Scholar]
- Zhou F., Cococcioni M., Kang K. & Ceder G. The Li intercalation potential of LiMPO4 and LiMSiO4 olivines with M = Fe, Mn, Co, Ni. Electrochem. Commun. 6, 1144–1148 (2004). [Google Scholar]
- Peng G. et al. Enhanced electrochemical performance of multi-walled carbon nanotubes modified Li2FeSiO4/C cathode material for lithium-ion batteries. J. Alloys Comp. 570, 1–6 (2013). [Google Scholar]
- Chen Z. et al. Hierarchical porous Li2FeSiO4/C composite with 2 Li storage capacity and long cycle stability for advanced Li-ion batteries. J. Mater. Chem. A 1, 4988–4992 (2013). [Google Scholar]
- Nytén A. et al. Surface characterization and stability phenomena in Li2FeSiO4 studied by PES/XPS. J. Mater. Chem. 16, 3483–3488 (2006). [Google Scholar]
- Yang J. et al. Synthesis and electrochemical performance of Li2FeSiO4/C/carbon nanosphere composite cathode materials for lithium ion batteries. J. Alloys Comp. 572, 158–162 (2013). [Google Scholar]
- Wu X., Jiang X., Huo Q. & Zhang Y. Facile synthesis of Li2FeSiO4/C composites with triblock copolymer P123 and their application as cathode materials for lithium ion batteries. Electrochim. Acta 80, 50–55 (2012). [Google Scholar]
- Dippel C. et al. Aging of Li2FeSiO4 cathode material in fluorine containing organic electrolytes for lithium-ion batteries. Electrochim. Acta 85, 66–71 (2012). [Google Scholar]
- Huang X. et al. Synthesis and electrochemical performance of Li2FeSiO4/carbon/carbon nano-tubes for lithium ion battery. Electrochim. Acta 55, 7362–7366 (2010). [Google Scholar]
- Gong Z. L., Li Y. X., He G. N., Li J. & Yang Y. Nanostructured Li2FeSiO4 electrode material synthesized through hydrothermal-assisted sol-gel process. Electrochem. Solid-State Lett. 11, A60–A63 (2008). [Google Scholar]
- Bai J. Y. et al. Nanostructured 0.8Li2FeSiO4/0.4Li2SiO3/C composite cathode material with enhanced electrochemical performance for lithium-ion batteries. J. Mater. Chem. 22, 12128–12132 (2012). [Google Scholar]
- Shao B. & Taniguchi I. Synthesis of Li2FeSiO4/C nanocomposite cathodes for lithium batteries by a novel synthesis route and their electrochemical properties. J. Power Sources 199, 278–286 (2012). [Google Scholar]
- Zhou H., Einarsrud M. A. & Vullum-Bruer F. High capacity nanostructured Li2FexSiO4/C with Fe hyperstoichiometry for Li-ion batteries. J. Power Sources 235, 234–242 (2013). [Google Scholar]
- Wu X., Wang X. & Zhang Y. Nanowormlike Li2FeSiO4-C composites as lithium-ion battery cathodes with superior high-rate capability. ACS Appl. Mater. Interfaces 5, 2510–2516 (2013). [DOI] [PubMed] [Google Scholar]
- Chen R. et al. Structural evolution of Li2Fe1−yMnySiO4 (y = 0, 0.2, 0.5, 1) cathode materials for Li-ion batteries upon electrochemical cycling. J. Phys. Chem. C 117, 884–893 (2013). [Google Scholar]
- Zhang S., Deng C., Fu B. L., Yang S. Y. & Ma L. Doping effects of magnesium on the electrochemical performance of Li2FeSiO4 for lithium ion batteries. J. Electroanal. Chem. 644, 150–154 (2010). [Google Scholar]
- Deng C., Zhang S., Yang S. Y., Fu B. L. & Ma L. Synthesis and characterization of Li2Fe0.97M0.03SiO4 (M = Zn2+, Cu2+, Ni2+) cathode materials for lithium ion batteries. J. Power Sources 196, 386–392 (2011). [Google Scholar]
- Li L. M. et al. Effects of roasting temperature and modification on properties of Li2FeSiO4/C cathode. J. Power Sources 189, 45–50 (2009). [Google Scholar]
- Gong Z. L., Li Y. X. & Yang Y. Synthesis and Characterization of Li2MnxFe1−xSiO4 as a Cathode Material for Lithium-Ion Batteries. Electrochem. Solid-State Lett. 9, A542–A544 (2006). [Google Scholar]
- Zhang S., Deng C., Fu B. L., Yang S. Y. & Ma L. Effects of Cr doping on the electrochemical properties of Li2FeSiO4 cathode material for lithium-ion batteries. Electrochim. Acta 55, 8482–8489 (2010). [Google Scholar]
- Hao H., Wang J., Liu J., Huang T. & Yu A. Synthesis, characterization and electrochemical performance of Li2FeSiO4/C cathode materials doped by vanadium at Fe/Si sites for lithium ion batteries. J. Power Sources 210, 397–401 (2012). [Google Scholar]
- Guo H. et al. Optimum synthesis of Li2Fe1−xMnxSiO4/C cathode for lithium ion batteries. Electrochim. Acta 55, 8036–8042 (2010). [Google Scholar]
- Yang X. L. et al. Enhanced Electrochemical Performance of LiFePO4 Cathode Material Promoted by CdO and Carbon Co-Coating. J. Electrochem. Soc. 159, A2096–A2099 (2012). [Google Scholar]
- Valanarasu S., Chandramohan R., Thirumalai J. & Vijayan T. A. Improved electrochemical investigation of combustion synthesized Cd-doped LiCoO2 powders. J. Sci. Res. 2, 443–452 (2010). [Google Scholar]
- Dong Y. Z., Zhao Y. M. & Duan H. The effect of doping Mg2+ on the structure and electrochemical properties of Li3V2(PO4)3 cathode materials for lithium-ion batteries. J. Electroanal. Chem. 660, 14–21 (2011). [Google Scholar]
- Zhai J., Zhao M., Wang D. & Qiao Y. Effect of MgO nanolayer coated on Li3V2(PO4)3/C cathode material for lithium-ion battery. J. Alloys Comp. 502, 401–406 (2010). [Google Scholar]
- Zhang L. L. et al. Improved electrochemical performance in Li3V2(PO4)3 promoted by Nb-incorporation. J. Electrochem. Soc. 158, A924–A929 (2011). [Google Scholar]
- Delacourt C., Wurm C., Laffont L., Leriche J. B. & Masquelier C. Electrochemical and electrical properties of Nb- and/or C-containing LiFePO4 composites. Solid State Ionics 177, 333–341 (2006). [Google Scholar]
- Xia Y. et al. Synthesis and electrochemical properties of Nb-doped Li3V2(PO4)3/C cathode materials for lithium-ion batteries. Mater. Sci. Eng. B 176, 633–639 (2011). [Google Scholar]
- Zhang L. L. et al. Insight into Fe incorporation in Li3V2(PO4)3/C cathode material. J. Electrochem. Soc. 159, A1573–A1578 (2012). [Google Scholar]
- Wang X. et al. Fe-doped InN layers grown by molecular beam epitaxy. Appl. Phys. Lett. 101, 171905 (2012). [Google Scholar]
- Chakraborty K. et al. Structural transition in rare earth doped zirconium oxide: A positron annihilation study. Mater. Res. Bull. 47, 3660–3664 (2012). [Google Scholar]
- Yan J. et al. Understanding the effect of surface/bulk defects on the photocatalytic activity of TiO2: anatase versus rutile. Phys. Chem. Chem. Phys. 15, 10978–10988 (2013). [DOI] [PubMed] [Google Scholar]
- He S. et al. A surface defect-promoted Ni nanocatalyst with simultaneously enhanced activity and stability. Chem. Mater. 25, 1040–1046 (2013). [Google Scholar]
- Dutta S. et al. Annealing effect on nano-ZnO powder studied from positron lifetime and optical absorption spectroscopy. Appl. Phys. Lett. 100, 114328 (2006). [Google Scholar]
- Huang X. et al. Synthesis and characterization of nano-Li1.95FeSiO4/C composite as cathode material for lithium-ion batteries. Electrochim. Acta 60, 239–243 (2012). [Google Scholar]
- Kolesov B. A. & Geiger C. A. A Raman spectroscopic study of Fe-Mg olivines. Phys. Chem. Miner. 31, 142–154 (2004). [Google Scholar]
- Devaraju M. K., Tomai T. & Honma I. Supercritical hydrothermal synthesis of rod like Li2FeSiO4 particles for cathode application in lithium ion batteries. Electrochim. Acta 109, 75–81 (2013). [Google Scholar]
- Lv D. et al. A novel Li2FeSiO4/C composite: synthesis, characterization and high storage capacity. J. Mater. Chem. 21, 9506–9512 (2011). [Google Scholar]
- Zhu H., Wu X., Zan L. & Zhang Y. Superior electrochemical capability of Li2FeSiO4/C/G composite as cathode material for Li-ion batteries. Electrochim. Acta 117, 34–40 (2014). [Google Scholar]
- Nytén A., Kamali S., Häggström L., Gustafsson T. & Thomas J. O. The lithium extraction/insertion mechanism in Li2FeSiO4. J. Mater. Chem. 16, 2266–2272 (2006). [Google Scholar]
- Zhang P. et al. Insights into electrochemical performance of Li2FeSiO4 from first-principles calculations. Electrochim. Acta 111, 172–178 (2013). [Google Scholar]
- Liu H. et al. Doping effects of zinc on LiFePO4 cathode material for lithium ion batteries. Electrochem. Commun. 8, 1553–1557 (2006). [Google Scholar]
- Cao Q. et al. A novel carbon-coated LiCoO2 as cathode material for lithium ion battery. Electrochem. Commun. 9, 1228–1232 (2007). [Google Scholar]
- Zhang L. L. et al. Reduced graphene oxide modified Li2FeSiO4/C composite with enhanced electrochemical performance as cathode material for lithium ion batteries. ACS Appl. Mater. Interfaces 5, 12304–12309 (2013). [DOI] [PubMed] [Google Scholar]
- Ma J., Li B., Du H., Xu C. & Kang F. The effect of vanadium on physicochemical and electrochemical performances of LiFePO4 cathode for lithium battery. J. Electrochem. Soc. 158, A26–A32 (2011). [Google Scholar]
- Qiao Y. Q. et al. Self-assembled synthesis of hierarchical waferlike porous Li-V-O composites as cathode materials for lithium ion batteries. J. Phys. Chem. C 115, 25508–25518 (2011). [Google Scholar]
- Qiu B. et al. Effects of Na+ contents on electrochemical properties of Li1.2Ni0.13Co0.13Mn0.54O2 cathode materials. J. Power Sources 240, 530–535 (2013). [Google Scholar]


