

Abstract
Focused ultrasound (FUS) has been shown promise in treating the brain locally and noninvasively. Transcranial passive cavitation detection (PCD) provides methodology of monitoring the treatment in real time, while the skull effects remain a major challenge for its translation to the clinic. In this study, we investigated the sensitivity, reliability, and limitations of PCD through primate (macaque and human) skulls in vitro. The results were further correlated with the in vivo macaque studies including the transcranial PCD calibration and real-time monitoring of BBB opening, with magnetic resonance imaging assessing the opening and safety. The stable cavitation doses using harmonics (SCDh) and ultraharmonics (SCDu), the inertial cavitation dose (ICD), and the cavitation signal-to-noise ratio (SNR) were quantified based on the PCD signals. Results showed that through the macaque skull the pressure threshold for detecting the SCDh remained the same as without the skull in place, while it increased for the SCDu and ICD; through the human skull, it increased for all cavitation doses. The transcranial PCD was found reliable both in vitro and in vivo when the transcranial cavitation SNR exceeded the 1-dB detection limit through the in vitro macaque (attenuation: 4.92 dB/mm) and human (attenuation: 7.33 dB/mm) skull. In addition, using long pulses enabled reliable PCD monitoring and facilitate BBB opening at low pressures. The in vivo results showed that the SCDh became detectable at pressures as low as 100 kPa; the ICD, at 250 kPa while it could occur at lower pressures; the SCDu, at 700 kPa and was less reliable at lower pressures. Real-time monitoring of PCD was further implemented during BBB opening, with successful and safe opening achieved at 250–600 kPa in both the thalamus and the putamen. In conclusion, this study shows that transcranial PCD in macaques in vitro and in vivo as well as humans in vitro is reliable by improving the cavitation SNR beyond the 1-dB detection limit.
Keywords: Focused ultrasound, brain therapy, acoustic cavitation detection, primate skull, blood-brain barrier opening
1. Introduction
Focused ultrasound (FUS) is a non-ionizing technique that can non-thermally (mechanically) or thermally treat the brain locally and noninvasively. Non-thermal applications such as blood-brain barrier (BBB) opening for drug delivery [1–3], sonothrombolysis for stroke [4, 5], and thermal applications such as ablation for tumors [6] or functional disorders [7] have been proven effective preclinically or clinically. Monitoring of the treatment is critical in providing the information for safety and efficacy assessment, but the methods to achieve real-time monitoring are limited due to the fast-paced treatment in micro- to milli-second scales. Since acoustic cavitation plays an essential role in inducing the desired bioeffects in both thermally based [8, 9] and non-thermally based [10, 11] treatments, passive cavitation detection (PCD) could achieve monitoring of the FUS brain treatment in real time. Both applications require sensitive and reliable transcranial PCD, and for thermal treatment temperature rise needs to be simultaneously monitored. In this study, we focused on mechanically-based treatment monitoring of BBB opening.
Acoustic signals in PCD present signatures of the bubble’s nonlinear oscillation such as stable cavitation and inertial cavitation. Stable cavitation denotes the nonlinear volumetric and/or surface oscillation of the bubble, resulting in emissions of harmonics, subharmonics, and ultraharmonics. Inertial cavitation, characterized by broadband emissions, refers to violent bubble oscillation leading to bubble collapse [12]. These acoustic signatures represent the intensity of cavitation and thus are related to the cavitation-based FUS treatment outcome. As shown in previous studies using ultrasound contrast agents, the acoustic signal intensity acquired by PCD has been correlated with the outcome of sonothrombolysis [10, 13] and BBB opening [11, 14, 15].
To implement PCD monitoring in large animals such as non-human primates and most importantly, in humans, the primate skull effects in detection need to be considered. The skull effects–including attenuation, reflection, scattering, absorption, and mode conversion [16]–affect the reliability of the transcranial PCD and impose detection limits. The limits could be associated with the skull thickness [17], skull density [18], the frequency of the acoustic wave [17, 18], the nonlinearity of transcranial ultrasound transmission [19], and the incident angle of the acoustic wave to the skull [20].
So far studies reported on primate skulls have investigated on the acoustic properties of the skull [16–18], longitudinal and shear mode transmission [20], transcranial focusing quality [21–23], and skull heating [16], but to our knowledge none have systemically investigated their effects to the transcranial PCD sensitivity and reliability. In order to answer those questions, the objective in this study was thus to investigate the performance of transcranial PCD in large animals, i.e., primates (macaque and human), as it pertains to its sensitivity, reliability and detection limit. This study provides critical information for single-element PCD [1, 24, 25] and passive acoustic mapping [26–28] in both preclinical and clinical applications.
2. Methods
Both in vitro macaque and human skull experiments as well as in vivo skull effects and real-time monitoring in BBB opening of macaques were performed in this study. Three types of cavitation doses and the cavitation SNR were quantified and used to address the characteristics of cavitation, skull attenuation, and detection limit. The stable cavitation dose (SCD) representing the overall extent of stable cavitation is defined as the cumulative harmonic or ultraharmonic emission. The inertial cavitation dose (ICD) represents the overall extent of inertial cavitation, and is defined as the cumulative broadband acoustic emission [13]. The cavitation SNR is defined as the ratio of the post- to pre-microbubble administration cavitation doses. The quantification of cavitation dose and SNR in this study is based on the detected signals, emitted by acoustic cavitation.
A. Experimental System
A single-element FUS transducer (H-107, Sonic Concepts, WA, USA) operated at 0.5 MHz with a −6-dB focal width by length equals to 5.85 mm by 34 mm and a geometric focal depth of 62.6 mm was used for sonication. A spherically focused, flatband hydrophone made of polyvinylidene fluoride (PVDF) (Y-107, Sonic Concepts, WA, USA; sensitivity: 10 kHz to 15 MHz; mean absolute characterization in 1.25 MHz to 5 MHz: 32.5 dB (20*log10(Volts/MPa))) was coaxially and confocally aligned with the transducer and served as the passive cavitation detector. A PC work station (model T7600, Dell) with a customized program in MATLAB® (Mathworks, MA, USA) was developed to automatically control the sonication through a function generator (model 33220A, Agilent Technologies, CA, USA) followed by a 50-dB amplifier (A075, ENI, NY, USA). The PCD signal acquisition was performed at a 14-bit analog-to-digital converter (Gage Applied Technologies, QC, Canada) (sampling rate: 100 MHz and 50 MHz in vitro and in vivo, respectively). A 20-dB amplification was applied throughout the macaque experiments, while 10 dB was applied for the human skull due to large reflection. The electronic noise level and variance of the system within the range of 1.25–5.00 MHz was 1.20 μV and 0.66 μV, respectively. All PCD signals acquired in vivo including the frequency spectra and cavitation doses were monitored in real time.
B. In Vitro Experiments
The desiccated macaque skull was purchased from Skulls Unlimited (Macaca mulatta, OK, USA) and sectioned to keep the cranial part (including the frontal bone, the parietal bones, and the occipital bone) (Fig. 1). Its average thickness in the ultrasound beam path was 3.09 mm using a caliper at five points of the skull lined in a cross below the transducer, and was degassed for 24 h prior to the experiment. The desiccated human skull was purchased from The Bone Room (CA, USA), and sectioned to keep the frontal and the parietal bones (Fig. 1) with an averaged thickness of 4.65 mm using the same measuring method described above. It was degassed for 48 h prior to the experiment. The pressures at the focus of the FUS transducer with and without the skulls were calibrated using a bullet hydrophone [29].
Fig. 1.
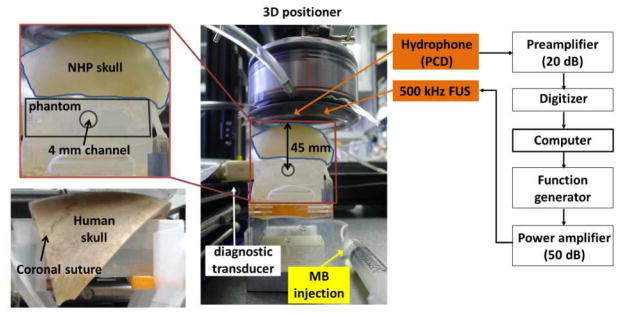
In vitro experimental setup. The cranial part of the macaque skull (including frontal bone, parietal bones, and occipital bone) was 3.09-mm thick in average of the beam-path region, and the human skull (including the frontal and the parietal bones) was 4.65-mm thick.
The experimental setup is shown in Figure 1 and the number of sonications is summarized in Table 1. In-house, lipid-shell, monodisperse microbubbles [30] (median diameter: 4–5 μm) were diluted to 2×10⁵ bubbles/mL and injected to the 4-mm-in-diameter channel in the acrylamide phantom before and after placing the skull on the phantom. The channel was roughly 45 mm and 25 mm below the macaque and human skulls, respectively. The PCD with the hydrophone and the diagnostic B-mode imaging system (Terason, MA, USA) were separately used to monitor the sonication (peak negative pressure (PNP): 50–450 kPa, pulse length: 100 cycles (0.2 ms) and 5000 cycles (10 ms), pulse repetition frequency (PRF): 10 Hz, duration: 2 s) in order not to interfere the PCD. B-mode images of bubble disruption were acquired to ensure the FUS focusing at the channel, which was performed through a linear array transducer (10L5, Terason, MA, USA; center frequency: 5.1 MHz) placed transversely to the FUS beam. Before each sonication, the new microbubbles were injected and the old, if any, microbubbles were flushed out. During the experiments for PCD only, i.e., without B-mode imaging, the microbubbles were constantly replenished with a flow rate of 0.25 mL/s in order to mimic the replenishment of the microbubbles in the brain.
Table 1.
Number of in vitro sonications at each pressure.
| Without microbubbles | With microbubbles | |||
|---|---|---|---|---|
| Skull effect (100 cycles) | Macaque | No skull | 41 | 49 |
| Skull | 33 | 46 | ||
| Human | No skull | 60 | 60 | |
| Skull | 70 | 81 | ||
| Pulse length effect (5000 cycles) | No skull | 20 | 20 | |
The in vitro experimental setup was designed to mimic the in vivo conditions in terms of targeting through the skull. Specifically, FUS was applied through the parietal bone next to the sagittal suture, which corresponding to the position for targeting the thalamus, putamen, and caudate nucleus in the present and previous studies [1, 31]. The 4-mm channel was chosen to accommodate the area of bubble disruption at the highest pressure (450 kPa). The low microbubble concentration was chosen in order to minimize the bubble-bubble interaction (the mean distance between bubbles is 58.5 mm) while still capable of being captured for B-mode visualization. The sonication parameters (pulse length, PRF, duration) were chosen based on our previous mouse skull study [32], in which no changes in the detection threshold were found. Sonication using 5000-cycle pulses without the skull in place was also performed in accordance to the in vivo BBB opening experiment.
C. In Vivo Experiments
All procedures were approved by the Institutional Animal Care and Use Committee at Columbia University and the New York State Psychiatric Institute. Four male rhesus macaques (Macaca mulatta) weighing between 6–11 kg were used in this study. The animal handling procedure was described previously [1, 31]. The pressure decrease due to transcranial FUS transmission was compensated based on the in vitro calibration result [29].
Two separate sets of experiments, i.e., one set for the in vivo skull effect and the other for BBB opening in non-human primates were performed, and the number of sonications is summarized in Table 2. The same type of in-house microbubbles was intravenously injected, and the total number of microbubbles administered was calculated based on the animal’s weight. For the purpose of BBB opening, a bolus of microbubbles (2.5×10⁸ bubbles/kg) was injected and the sonication (PNP: 250–600 kPa, pulse length: 10 ms, PRF: 2 Hz, duration: 2 min) was started at the beginning of injection. In order to study the in vivo skull effect, a bolus of microbubbles (1.25×10⁸ bubbles/kg) was injected immediately after the BBB opening sonication. 10 s after injection when the microbubbles perfused the brain, a consecutive sonication at ramp-up pressures was started (PNP: 50–700 kPa, pulse length: 100 cycles (0.2 ms) or 5000 cycles (10 ms), PRF: 2 Hz, duration: 10 s). The targeted regions were the thalamus and putamen using the targeting technique developed previously [25]. There were two reasons in performing the PCD calibration right after BBB opening. First, it required fewer microbubbles for the second injection as the remaining bubbles from the first injection were still circulating. Second, it allowed us to use PCD to monitor the microbubbles perfusing the brain during sonication for BBB opening, which ensured that the experiments were performed accurately.
Table 2.
Number of in vivo sonications at each pressure.
| Pulse length | Without microbubbles | With microbubbles | |
|---|---|---|---|
| Skull effect | 100 cycles | 8* | 8* |
| 5000 cycles | 14** | 14** | |
| BBB opening | 5000 cycles | 40 | 40 |
: 6 for 700 kPa.
: 12 for 700 kPa.
Magnetic resonance imaging (MRI; 3T, Philips Medical Systems, MA, USA) was performed 0.5 h after the sonication to confirm BBB opening and assess safety. 3D Spoiled Gradient-Echo T1-weighted sequence (TR/TE=20/1.4 ms; flip angle=30°; NEX=2; spatial resolution: 500×500 μm2, slice thickness: 1 mm with no interslice gap) before and 40 min after intravenously injecting the contrast agent gadodiamide (Omniscan®, GE Healthcare, NJ, USA; dosage: 0.2 mL/kg), was used to visualize the opening. 3D T2-weighted sequence (TR/TE=3000/80 ms; flip angle=90°; NEX=3; spatial resolution: 400×400 μm2, slice thickness: 2 mm with no interslice gap) was performed for detecting edema. Susceptibility-weighted imaging (SWI, TR/TE=19/27 ms; flip angle=15°; NEX=1; spatial resolution: 400×400 μm2, slice thickness: 1 mm with no interslice gap) was performed for detecting hemorrhage.
Analysis for the opening volume across the experiments included image realignment, enhancement evaluation, and volume calculation using T1-weighted images. First, the pre-contrast and post-contrast images were aligned to the individual stereotactically aligned T1-weighted images acquired prior to the experiment using FSL’s FLIRT [33] in order to ensure the alignment of the pre- to post-contrast images [25]. Second, the enhancement was calculated by taking the ratio of the post- to pre-contrast images, normalizing by linearly scaling the unsonicated region on the contralateral side (a circle of 6.25 mm in diameter in the horizontal slice) and the anterior cerebral artery (a circle of 1.75 mm in diameter in the horizontal slice) to 0 and 1, respectively. Third, after removing the enhancement from the vessels by subtracting that of the control without any sonication, the opening region was thresholded by three times the standard deviation of the unsonicated region. Finally, the opening volume was calculated in the defined region of interest (10 mm × 10 mm × 32.5 mm).
D. Quantification of Cavitation Dose and Cavitation SNR
The PCD signals, frequency spectra, and spectrograms (8-cycle Chebyshev window, 98% overlap, 4096-point Fast Fourier Transform) were used to monitor the cavitation using MATLAB®. In order to quantify the cavitation level–time derivative of the cavitation dose, the harmonic, ultraharmonic, and the broadband signals in the spectra for each pulse were separately filtered. The stable cavitation level based on harmonics only (dSCDh) was the root-mean squared amplitude of the harmonic signals in a single pulse, with the harmonic signals defined as the maxima in the 20-kHz (−6-dB width) range around the harmonic frequency (n*f, f: excitation frequency, n=1,2,3,…) in the frequency spectrum. The stable cavitation level based on ultraharmonics only (dSCDu) was the root-mean squared amplitude of the ultraharmonic signals in a single pulse, with the ultraharmonic signals defined as the maxima in 20 kHz around the ultraharmonic frequency (m/2*f, f: excitation frequency, m=3,5,7,…) in the frequency spectrum. The inertial cavitation level (dICD) was the root-mean squared amplitude of the frequency spectrum after excluding the harmonics (360 kHz around the harmonic frequency) and ultraharmonics (100 kHz around the ultraharmonic frequency).
The cavitation dose for each sonication was the cumulative sum of the cavitation level in 1.25–5.00 MHz for every pulse; the cavitation SNR, the ratio of post- to pre-microbubble administration cavitation doses.
where t is the time for each pulse; T, the sonication duration; CD, the cavitation dose (SCDh, SCDu, and ICD for harmonics, ultraharmonics, and broadband emissions, respectively); dCDt, the cavitation level for the pulse at time t (dSCDh, dSCDu, and dICD for harmonics, ultraharmonics, and broadband emissions, respectively); the root-mean squared amplitude of the harmonic/ultraharmonic/broadband signals in the frequency spectrum for the pulse at time t; CDpost, the post-microbubble administration cavitation dose; CDpre, the pre-microbubble administration cavitation dose.
The frequency range used to quantify the cavitation level was 1.25–5.00 MHz in order to cover the strong harmonics, ultraharmonics, and broadband emission, while suppressing the linear and nonlinear scattering from the tissue and the skull. Moreover, the acoustic measurement in this frequency range applies to different systems or the excitation frequencies of FUS in comparison to that in a narrow frequency range. The quantification of the SCDh and the SCDu was based on the acoustic emissions generated by stable cavitation including harmonics and ultraharmonics, while the ICD was based on the broadband emission (after filtering for the harmonics and ultraharmonics) emitted from inertial cavitation. The harmonics and ultraharmonics were quantified separately due to the large difference of the spectral amplitudes. In addition, their physical mechanisms are assumed to be different: the harmonics is the result of volumetric oscillation, while the ultraharmonics and subharmonics may relate to the nonspherical bubble oscillation [12, 34]. For ICD quantification, the width of the spectral window for the broadband signals was chosen in order to minimize both the electronic noise and the increase due to the harmonic peaks (i.e., the window width is large enough to minimize the electronic noise by averaging and not to cover the broadening part of harmonic peaks).
The SCD based on subharmonics (SCDs) was excluded in the present study due to the intrinsic low-frequency noise. In addition, since the excitation frequency used in this study was low, the subharmonics were overlapping with the linear scattering whose amplitude increased even more with the scattering of the skull.
E. Statistical Analysis
In the in vitro study, an unpaired two-tailed Student’s t-test was used to determine if the experimental result (post-microbubble administration) was significantly higher (p < 0.05) than the control (pre-microbubble administration) for each pressure. In the in vivo skull effect study, paired two-tailed Student’s t-test was used to determine if the experimental result (post-microbubble administration) was significantly higher (p < 0.05) than the control (pre-microbubble administration) for each pressure in each animal.
3. Results
A. In Vitro Experiments
Figure 2 shows the PCD spectrograms before and after placing the skull. Before placing the skull, the amplitude of harmonics, ultraharmonics as well as the broadband signals increased significantly with pressure after microbubble administration (Fig. 2b) when compared to the control (Fig. 2a), in which the second harmonic became significant at and above 150 kPa. The broadband signals increased mostly within the range of 3–5 MHz according to the results at 150 kPa and 200 kPa in Fig. 2b. In the case of the macaque skull (Fig. 2c), the high frequency components were attenuated, while the signals remained detectable at the lowest pressure (50 kPa). In the case of the human skull (Fig. 2d), the frequency components below 3 MHz were detected only at or above 150 kPa. The cavitation emissions occurred at 0.05–0.10 ms (the echo arrival time to the focus (62.9 mm)) after microbubble administration (Fig. 2b–d).
Fig. 2.
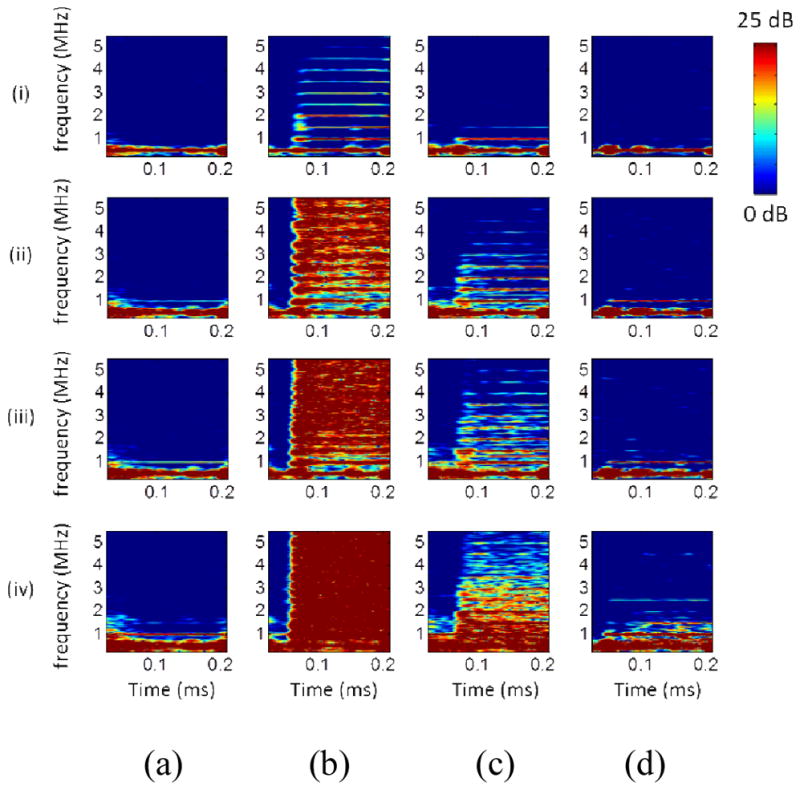
In vitro cavitation monitoring: spectrograms. (a) Sonicating water without the skull in place. (b) Sonicating microbubbles without the skull in place. (c) Sonicating microbubbles with the macaque skull in place. (d) Sonicating microbubbles with the human skull in place. (i), (ii), (iii), and (iv) represents 50 kPa, 150 kPa, 200 kPa, and 450 kPa, respectively. The colorbar shows the intensity of the spectra, with a dynamic range of 25 dB and 15 dB for the macaque and human skull experiments, respectively, based on the preamplification (macaque: 20 dB, human: 10 dB).
B-mode cine-loops were also used to monitor the cavitation separately. Figure 3 shows the images of the microbubbles in the channel phantom after sonication. The microbubbles were found to dissolve or fragment at or above 200 kPa as evidenced by the loss of echogenicity in the focal region in all experimental conditions, i.e., cases without (Fig. 3a), with the macaque (Fig. 3b) and the human (Fig. 3c) skull, and using longer pulses without the skull (5000 cycles in Fig. 3d). The mean diameter of the hypoechogenic area at 200 kPa and 450 kPa was 1.3 mm and 4 mm, respectively.
Fig. 3.
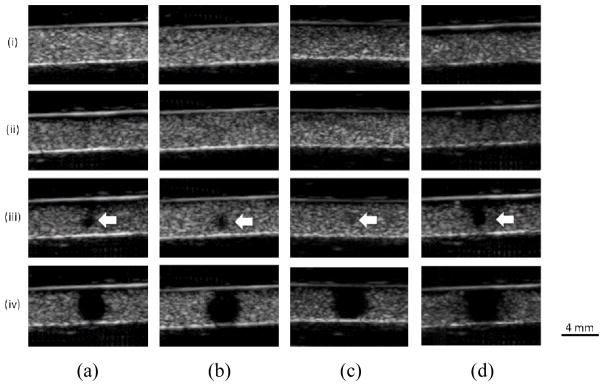
In vitro cavitation monitoring: B-mode images in transverse plane after the sonication. (a) Without the skull in place using 100 cycles. (b) With the macaque skull in place using 100 cycles. (c) With the human skull in place using 100 cycles. (d) Without the skull in place using 5000 cycles. (i), (ii), (iii), and (iv) represents 50 kPa, 150 kPa, 200 kPa, and 450 kPa, respectively. The arrows indicate the spot losing echogenicity at the pressure threshold (200 kPa). The images showed good focal alignment to the channel and the bubbles lost the property of contrast enhancement at or above 200 kPa. The shape to the hypoechogenitic area was roughly a circle with an averaged diameter of 1.3 mm at 200 kPa and 4 mm at 450 kPa.
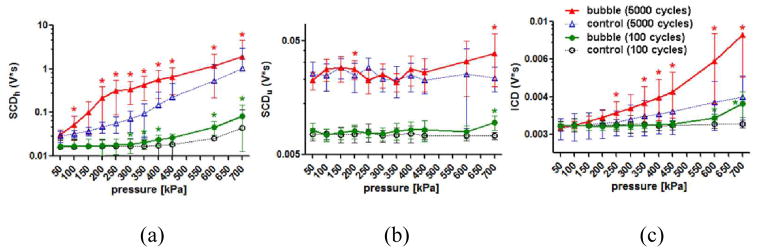
Figure 4 shows cavitation doses with and without the skull in place using 100-cycle pulses. In the macaque skull experiments (Fig. 4a–c), the SCDh, the SCDu, and the ICD without placing the skull were significantly higher (p < 0.05) than the control at and above 50 kPa, which also increased monotonically with pressure. After placing the macaque skull, the SCDh was detectable (p < 0.05) at all pressures, whereas the detection pressure threshold for both the SCDu and the ICD increased to 150 kPa. In the human skull experiments (Fig. 4d–f), the SCDh was detectable at and above 100 kPa after placing the skull. For the SCDu, the detection pressure threshold increased to 250 kPa. For the ICD, it became 350 kPa. The SCDh at or above 400 kPa was undetected since the control signal with the human skull was strong. While the detection pressure threshold slightly changed after placing the macaque and the human skull, the sensitivity of cavitation doses to pressure changes remained the same.
Fig. 4.

In vitro cavitation doses. (a) SCDh, (b) SCDu, and (c) ICD for the macaque skull experiments using 100-cycle pulses. (d) SCDh, (e) SCDu, and (f) ICD for the human skull experiments using 100-cycle pulses. (g) SCDh, (h) SCDu, and (i) ICD without the skull in place using 100- and 5000-cycle pulses. The error bar shows the standard deviation. *: p<0.05. Green *: comparison made in the cases without the skull in place. Red *: comparison made in the cases with the skull in place. All of the comparisons in (g)–(i) showed statistical significance. All of the cavitation doses became detectable at 50 kPa, while this detectable pressure threshold may change after placing the skull. The nonlinear effect of the skull was seen after placing the human skull at high pressures as the SCDh increased significantly. Applying long pulses (5000 cycles) was effective in generating high cavitation doses at low pressures when compared with applying short pulses (100 cycles).
The pulse length effect on the cavitation dose was also studied. Figures 4g–i show the cavitation doses with 100-cycles and 5000-cycle pulse lengths. The SCDh using 100-cycle pulses increased monotonically with pressure increase, whereas the SCDh with 5000-cycle pulses reached a maximum at 300 kPa and started to decrease at pressures above 300 kPa. Similar to the SCDh, the SCDu using 100-cycle pulses increased monotonically with pressure, while the SCDu using 5000-cycle pulses reached a plateau at 250 kPa and started to decrease at higher pressures. The ICD using 100-cycle and 5000-cycle pulses both increased monotonically with pressure increase, and the latter increased at a faster rate. All of the cavitation doses of 5000-cycle pulses were higher than that of 100-cycle pulses.
Figure 5 shows the cavitation SNR, which was used to study the sensitivity of PCD using the pulse length, the detection limit, and skull attenuation. Before placing the skull, the cavitation SNR for the SCDh, SCDu, and ICD using 100-cycle pulses (Fig. 5a) ranged within 28.6–49.1 dB, 2.1–38.9 dB, and 3.1–37.0 dB, respectively. Followed by the SCDu and the ICD, the cavitation SNR for the SCDh was the highest. The cavitation SNR for the SCDh, SCDu, and ICD using 5000-cycle pulses (Fig. 5b) ranged within 24.8–54.6 dB, 2.2–54.8 dB, and 2.9–41.9 dB, respectively. Both the cavitation SNR for the SCDh, SCDu reached a plateau at 250 kPa, while it increased monotonically for the ICD.
Fig. 5.
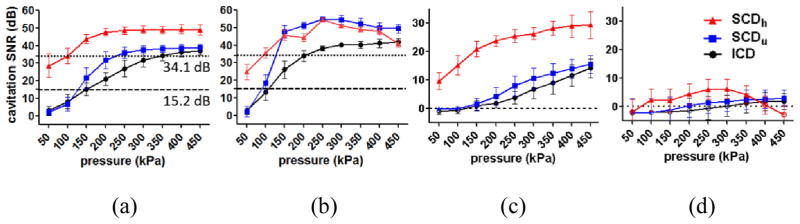
In vitro cavitation SNR (a) without the skull in place using 100-cycle pulses, (b) without the skull in place using 5000-cycle pulses, (c) with the macaque skull in place using 100 cycles, and (d) with the human skull in place using 100 cycles. The error bar shows the standard deviation. The dash lines in (a) represent the SNR threshold for surpassing the skull attenuation (macaque: 15.2 dB, human: 34.1 dB). For SNR higher than 1 dB, the detected cavitation doses were significantly higher than that of control. This 1 dB was deemed as the detection threshold with and without the skull.
Figures 5c–d show the cavitation SNR using 100-cycle pulses through the skull. The cavitation SNR through the macaque skull (Fig. 5c) ranged within 9.7–29.4 dB, 1.6–15.6 dB, and 1.1–14.1 dB, respectively, corresponding to the statistically significant SCDh, SCDu, and ICD through the macaque skull compared to the control (Fig. 4a–c). The cavitation SNR through the human skull (Fig. 5d) ranged within 2.4–6.2 dB, 1.4–3.0 dB, and 1.2–1.9 dB, respectively, corresponding to the statistically significant SCDh, SCDu, and ICD through the human skull compared to the control (Fig. 4d–f). For the cavitation SNR with the skull lower than 1 dB, the corresponding cavitation doses failed to reach statistical significance (p < 0.05) compared to the control. This 1 dB was deemed as the detection limit (or SNR limit), meaning that the PCD was reliable when the cavitation SNR exceeded 1 dB.
As described above, by correlating the cavitation SNR with the skull (Fig. 5c–d) to the cavitation doses with the skull (Fig. 4a–f), it was found that when the cavitation SNR exceeded 1 dB–defined as the detection limit for PCD–the transcranially acquired cavitation doses were statistically significant compared to the control. In order to assess the skull attenuation, the cavitation SNR without the skull (Fig. 5a) was then compared against the cases with the skull surpassing the 1-dB SNR limit (Fig 5c–d). It was found that the SNR without the skull should be higher than 15.2 dB and 34.1 dB (Fig. 5a) in order to be detected through the macaque (Fig. 5c) and the human skull (Fig. 5d), respectively. In other words, for cavitation SNR higher than 15.2 dB and 34.1 dB without the macaque and human skull, respectively (Fig. 5a), the cavitation SNR through the skull (Fig 5c–d) would be higher than 1 dB and the corresponding cavitation doses with the skull would be significantly higher than those of the control (p < 0.05). The skull attenuation was then calculated by dividing by the measured skull thickness: 4.92 dB/mm and 7.33 dB/mm for the macaque and human, respectively.
B. In Vivo Experiments
In vivo skull effects at different pressures and different pulse lengths were studied and compared with the in vitro findings. Figure 6 shows the cavitation doses using 100- and 5000-cycle pulses. When applying 100-cycle pulses, the SCDh, SCDu, and ICD were significantly higher than the control at and/or above 300 kPa, 700 kPa, and 600 kPa, respectively. When applying 5000-cycle pulses, the SCDh, SCDu, and ICD were significant compared to the control at pressure lower than that for the 100-cycle pulses: at and above 100 kPa, at 200 kPa and 700 kPa, and at and above 250 kPa, respectively. The cavitation dose when applying 5000-cycle pulses was higher than that with 100-cycle pulses. In either case, the cavitation doses increased monotonically with pressure. Besides, the SCDh using 100-cycle pulses at 450 kPa, the SCDh using 5000-cycle pulses at 150 kPa, and the ICD using 5000-cycle pulses at 300 kPa showed no significance compared to the control (0.05 < p < 0.06) due to their higher variability.
Fig. 6.
In vivo cavitation doses using 100- and 5000-cycle pulses. (a) SCDh. (b) SCDu. (c) ICD. *: p<0.05. The error bar shows the standard deviation. When using 5000-cycle pulses, the SCDh became detectable transcranially at 100 kPa; for the ICD, 250 kPa; while the SCDu was unrealiable and could be detected at high pressures. When using 100-cycle pulses, the pressure threshold in detecion increased.
Figure 7 shows the cavitation SNR for the skull effect using 100- and 5000-cycle pulses. When applying 100-cycle pulses (Fig. 7a), the cavitation SNR for the statistically significant SCDh, SCDu, and ICD compared to the control ranged within 1.2–9.8 dB, 2.3 dB, and 0.7–2.1 dB, respectively. It increased monotonically for the SCDh and ICD, whereas it fluctuated for the SCDu. When applying 5000-cycle pulses (Fig. 7b), the cavitation SNR for the SCDh, SCDu, and ICD ranged within 3.8–13.3 dB, 1.4–3.5 dB, and 1.0–6.1 dB, respectively. It reached a plateau for the SCDh at 250 kPa and then started to decrease at 400 kPa. In the SCDh case, it fluctuated at low pressures and then increased monotonically at and above 400 kPa. In the ICD case, it increased monotonically without fluctuating or reaching a plateau. The cavitation SNR at pressures where significant cavitation signals were detected compared to the control was above the 1-dB SNR limit, with the exception for SCDu (57% of the measurements beyond the detection limit were statistically insignificant compared to the control). This result was remarkably consistent with our in vitro findings.
Fig. 7.
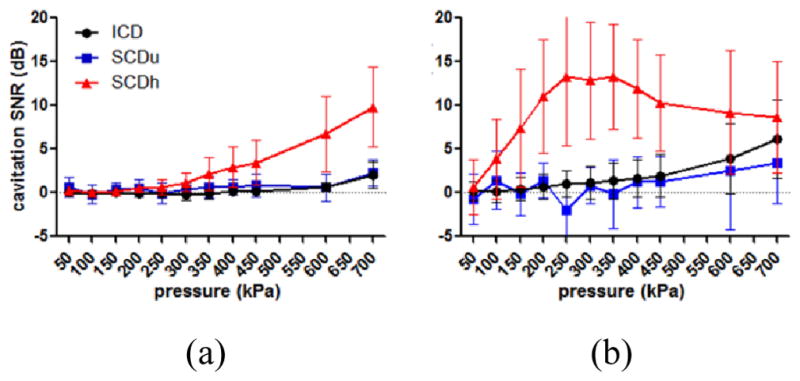
In vivo cavitation SNR using (a) 100-cycle and (b) 5000-cycle pulses. The error bar shows the standard deviation. The cavitation SNR using 100-cycle pulses increased with pressure. When using 5000-cycle pulses, the SNR of the SCDu and ICD increased with pressure, while it for the SCDh reached plateau due to the nonlinear effect of the skull at high pressures.
Real-time PCD monitoring during BBB opening was achieved. Figure 8 shows four cases of PCD monitoring and the corresponding opening results in MRI at different pressures. The MRI showed BBB opening in two macaques in the thalamus and the putamen at pressures ranging from 250 kPa to 600 kPa, with the opening volume of 494.7, 230.9, 112.9, and 299.2 mm3, respectively. The volume increased with pressure in the same macaque (Fig. 8b–d) in general, and its range varied across animals. The dSCDh reached a plateau in 10–30 s after injecting microbubbles and was kept at the same level for the rest of sonication duration. The dSCDu remained mostly undetected. The dICD increased by 3.18 dB at 350 kPa and 0.19 dB at 450 kPa as compared the end of the sonication to the beginning, while it remained unchanged at 275 kPa and 600 kPa.
Fig. 8.

In vivo BBB opening at (a) 275 kPa, (b) 350 kPa, (c) 450 kPa, and (d) 600 kPa in the thalamus (orange arrow) or the putamen (green arrow). The upper and middle rows show the post-contrast T1 weighted images with calculated enhancement (with colorbar) in axial and coronal view, respectively. The opening volume of (a) to (d) was 494.7, 230.9, 112.9, and 299.2 mm3, respectively. The bottom row shows the real-time monitoring of the SCDh, SCDu, and ICD for sonicating the thalamus. Note that in (d) the microbubbles were injected before the sonication was started. Case (b)–(d) were performed in the same macaque.
Finally, Figure 9 shows the safety assessment using T2-weighted MRI and SWI corresponding to the four BBB opening cases in Figure 8. No edema or hemorrhage was detected in any of the animals used, corresponded to the PCD monitoring results for which minimum or no ICD increase was recorded during sonication.
Fig. 9.

Safety assessment using MRI at (a) 275 kPa, (b) 350 kPa, (c) 450 kPa, and (d) 600 kPa. The upper row shows the T2-weighted images (coronal view) for detecting the edema, which is lighter if occurred. The lower row shows the SWI (coronal view) for detecting the hemorrhage, which is darker if occurred. In all cases, no hemorrhage and edema was detected.
4. Discussion
In this study, we have demonstrated the primate skull affecting the PCD performance using short and long pulses. Its sensitivity, reliability, and transcranial cavitation detection limit in macaques and humans were investigated, by performing in vitro macaque and human skull experiments as well as in vivo experiments in macaques with BBB opening. The in vitro study allows extensive investigation of the cavitation characteristics and the primate skull effects, while the in vivo study confirmed the in vitro findings using realtime PCD monitoring. The transcranial PCD was found sensitive to detect cavitation signals at pressures as low as 100 kPa in vivo. The transcranial detection limit (1-dB SNR limit) served as a criterion to guarantee reliable detection. Realtime PCD monitoring was performed during BBB opening, in which safe opening and reliable detection was achieved using long pulses.
A. B-Mode Imaging vs. PCD
B-mode imaging was used to visualize the cavitation, ensuring the focal alignment to the channel and confirming the loss of echogenicity became detected at 200 kPa with and without the skull. It visualized cavitation by the maintenance or loss of echogenicity, representing stable or inertial cavitation, respectively. It also confirmed good focal alignment to the channel before and after placing the skull by detecting the bubble collapse at the center of the channel. In addition, it confirmed that the loss of echogenicity became detectable at 200 kPa in the presence of the skull.
In contrast to the active visualization of B-mode imaging, the PCD served as an indirect monitoring tool. The PCD was shown to be more sensitive than B-mode imaging in this study since it detected inertial cavitation at 50 kPa, lower than the lowest pressure losing echogenicity (200 kPa). Detecting bubble destruction in B-mode imaging is limited by its spatial and contrast resolution, which failed to detect a smaller amount of bubble destruction at pressures lower than 200 kPa. Therefore, B-mode imaging was used to supplement to the PCD results rather than to determine the inertial cavitation threshold. This result–PCD was more sensitive than B-mode imaging–was different from a previous study [35], which may due to the different excitation frequency and microbubbles used as well as different sensitivity of the imaging and PCD systems. On the other hand, the inertial cavitation occurred at 50 kPa in our study due to low excitation frequency, long pulse lengths [36], and low stiffness of the in-house microbubbles with a 4–5 μm diameter [37]. This threshold is comparable to experimental results reported by other groups [36, 38, 39] as well as numerical simulation [40].
B. Cavitation Doses Without and With the Skull
There is a need to define a quantity that could be used to assess the FUS treatment outcome. Since both thermal and non-thermal based FUS treatment outcomes are closely related to the extent of cavitation [8–11], which is typically reflected by the nonlinear emissions including harmonics, ultraharmonics, and broadband emissions, the quantity “cavitation dose” was employed here. The quantification of cavitation doses is based on the detected signals, emitted by acoustic cavitation and attenuated by the brain or skull. Therefore, the true cavitation dose (or cavitation dose in situ) should be estimated by accounting for the skull or tissue attenuation.
The pulse length affected the characteristics of the cavitation dose (Fig. 4). Using 100-cycle pulses, the cavitation doses increased monotonically with pressure increase as the magnitude of bubble oscillation increased. Furthermore, using long pulses (5000 cycles) was found to be more effective in generating higher cavitation dose. This was not only due to the integration over long pulse duration, as the cavitation doses did not linearly increase with the pulse length. In fact, the ICD still increased monotonically with pressure increase, while the SCDh and the SCDu reached a plateau at 250 kPa. It could therefore be explained that under a long-pulse excitation, a larger number of microbubbles underwent stable and inertial cavitation. When most microbubbles were undergoing inertial cavitation and collapse immediately without contributing to stable cavitation, stable cavitation reached a plateau and started to decrease. We also speculate that the microbubbles undergoing stable cavitation diffused faster using longer pulses and failed to enhance the SCDh.
Through the skull the trend of cavitation doses to pressure change remained the same, while the pressure threshold for the cavitation doses becoming detectable varied depending on the type of cavitation doses and the skull (Fig. 4). The monotonical increase of cavitation doses with pressure remained the same after placing the macaque and the human skull for signals surpassed the skull attenuation. On the other hand, the pressure threshold to detect the SCDh through the macaque skull remained unchanged, while it increased for the SCDh and ICD; for the human skull, the threshold increased for all three cavitation doses. In all types of cavitation doses, the pressure threshold for the SCDh was the lowest, followed by the SCDu and ICD. The SCDh remained detectable through the skull at 50 kPa and 100 kPa for macaques and humans, respectively. For the SCDu, the pressure threshold increased to 150 kPa and 250 kPa in the macaques and humans, respectively; for the ICD, 150 kPa and 350 kPa, respectively. This was due to the low signal intensity, even though the ultraharmonics and the broadband emissions occurred at 50 kPa.
The in vivo skull effect (Fig. 6) was supported by the in vitro findings, except that the in vivo SCDu was unreliable. Using 100-cycle and 5000-cycle pulses, the SCDh as well as the ICD increased monotonically with pressure like the in vitro cases, with the exception that the SCDh for the 5000-cycle pulse did not reach a plateau. This could be due to the nonlinear scattering from the skull and possible air trapped between the transducer and the animal’s skin. On the other hand, unreliable SCDu was discerned due to the less frequent ultraharmonics as it was observed in real-time monitoring of BBB opening (Fig 8). It could be attributed to microbubble dynamics in the biological environment such as blood, capillary, and blood vessel, as those were the main differences between the in vivo and the in vitro experiments. The biological environment could presumably affect cavitation for different types of microbubbles with varied extents. In addition, the varying blood pressure could contribute to the variation of the SCDu as well [41]. Finally, the inertial cavitation was detected at and above 250 kPa, although it was possible that microbubble collapse could occur at lower pressures.
C. Cavitation SNR and Skull Effects
The cavitation SNR was defined and used to investigate the sensitivity and reliability of PCD under different conditions such as varied pressures and pulse lengths, and the skull effects on them. It served as a quantitative way to find the transcranial detection limit (1-dB SNR limit), the skull attenuation, and ways to improve the detection. In order to achieve reliable PCD, one may increase the cavitation SNR in two ways: increasing the pressure or the pulse length. Using long pulse lengths was found effective in increasing the cavitation SNR at low pressures, while the cavitation SNR for the SCDh decreased at high pressures due to the cavitation characteristics and nonlinear skull scattering as described in the previous section for discussing the cavitation doses. Increasing the number of microbubbles injected could also improve the cavitation SNR since the inertial cavitation could be detected at low pressures (250 kPa) in the in vivo skull effect experiments after a second bolus injection of microbubbles, which was speculated that more microbubbles were circulating. Although safety could be a concern, no damages were reported in other studies using increased doses of microbubbles to induce BBB opening [24, 42].
The cavitation signals were reliable through the skull provided that the cavitation SNR was above 1 dB. This 1-dB SNR limit was acquired in the in vitro study and confirmed in the in vivo study. As in both studies, the cavitation doses showed statistical significance when satisfying this criterion with the only exception in SCDu. In future applications, this transcranial detection limit provides us indication of inertial cavitation detected for the macaque experiments. In the clinical studies, it could give us an indication of reliable PCD for all types of cavitation doses.
Skull attenuation for macaques (4.92 dB/mm) and humans (7.33 dB/mm) in this study are comparable to previous studies [17, 43]. The attenuation by the human skull is higher than that in the macaque, which might be due to high skull density [18], strong nonlinear ultrasound transmission [19], strong reflections and different extents of mode conversion [16]. The attenuation measured in this study was averaged over 1.25–5.00 MHz. The attenuation decreases when using lower frequencies. However, the broadband emission may be filtered out if signals within 3–5 MHz were excluded in the cases of low pressures (Fig. 2b). Besides, harmonics from the skull and tissue nonlinearity may hinder the detection at low frequencies as described in the following paragraph. The appropriate frequency range is therefore a compromise between skull attenuation, nonlinear effects, and frequency distribution of the cavitation signals. In the future, one could estimate the in situ cavitation strength by combining the transcranial PCD measurements (provided they pass the transcranial detection limit) with the skull attenuation acquiring from simulation or ex vivo measurement in order to assess the treatment outcome.
In addition to the inherent skull attenuation, nonlinear ultrasound scattering due to the skull could further hinder the detection of harmonics. Nonlinear scattering from the human skull became apparent at and above 450 kPa (Fig. 4d), failing the detection of the harmonics (SCDh) generated by the microbubble cavitation. It could be due to the fact that higher pressure was applied in order to compensate for the 80% of pressure attenuation through the human skull, causing inevitable nonlinear scattering. Second, the FUS focus was 25 mm below the human skull, which could cause stronger nonlinear effects compared to a deeper focus [19]. Third, although precautions were taken, trapped air could still be present. This phenomenon was also revealed in the in vivo macaque results (Fig. 6a), in which nonlinear scattering was significant using a 5000-cycle pulse. This nonlinear effect could cause serious problems as it fails the detection of the SCDh and may risk to overtreatment based on the monitoring.
D. Real-time PCD monitoring in BBB Opening
Real-time monitoring of the cavitation doses was performed during BBB opening using 5000-cycle pulses (Fig. 8), providing the information of bubble perfusion and the cavitation level. Furthermore, the use of long pulses enables reliable PCD monitoring and facilitate opening at low pressures, and this lower pressure threshold was also found in the study done in mice [44]. By monitoring the SCDh, the time for microbubbles perfuse to the sonicated region as well as the microbubble persistence during the entire treatment could be monitored at and above 250 kPa. The lowest pressure for detecting the SCDh was 100 kPa as was found in the in vivo skull experiments (Fig. 6a).
The SCDu was detected when the microbubbles first perfused the brain in two (Fig. 8b–c) out of the three cases (Fig 8a–c), although the variability was high. Our finding was consistent with the other group [2, 24], in which not all cases showed significant ultraharmonics. Low SCDu was affected by the noise from the system or the air trapped in the beam path. Therefore, in order to reliably detect the SCDu a pressure as high as 700 kPa should be applied (Fig. 6b), which increases the probability of damage. This finding was also consistent with the method of detection and real-time feedback control based on ultraharmonics in mice by O’Reilly et al. [45]. However, this feedback control method based on ultraharmonics may not be optimal for large animals due to unreliable SCDu and skull effects.
By monitoring the ICD, the safety of the treatment could be monitored in real time since low (SNR < 3dB) or no inertial cavitation was detected in the cases of safe BBB opening. Low or no ICD obtained during BBB opening experiments (Fig. 8) compared to the in vivo skull effect (Fig. 6) was most likely due to lower number of microbubbles circulating during FUS treatment, since significant increase of ICD was obtained in the same animal after a second bolus injection of microbubbles for in vivo skull effect.
Safe BBB opening was achieved at low pressures (250–600 kPa) in both the putamen and the thalamus (Fig. 8). No differences were observed between the putamen and the thalamus in terms of cavitation doses in this study. The opening volume varied across animals, but it increased with pressure in the same macaque as compare the 350-kPa case (Fig. 8b) with the 600-kPa case (Fig. 8d). The 450-kPa case had smaller opening volume than the 350-kPa case was expected based on the slightly decreasing SCDh, which may due to the animal’s physiological effect to the circulating microbubbles. For the safety threshold of ICD, a 3.18-dB (1.44 times above the background signal) SNR of ICD was detected in the case without damage (Fig 8b). This indicated that the ICD safety threshold was higher than 3.18 dB for the system used. This result was consistent with the study done by Arvanitis et al. using a lower excitation frequency [24], in which 6.33 dB (4.3 times above the background power signal) was reported with hemorrhage.
Studies correlating the cavitation dose to the opening volume based on single-element PCD should consider using the ICD instead of the SCDh at relatively high pressures due to three reasons. First, the positive correlation of the ICD to pressure is independent of the pulse length which affected the cavitation characteristics. Second, the ICD is not affected by the nonlinear ultrasound scattering due to the skull (e.g. the human skull results in Fig. 4d–f). Third, the ICD can also provide safety assessment [14, 24]. One major challenge here is to achieve reliable ICD detection by increasing the cavitation SNR. On the other hand, passive cavitation mapping [26, 27] including spatial information of cavitation could give us more precise estimation of opening volume and safety assessment using both the SCDh and ICD. Further studies regarding the effects of brain heterogeneity and individual differences in cavitation doses and treatment outcome in large animals are crucial before clinical applications.
5. Conclusion
In vitro macaque and human skull experiments as well as in vivo macaque experiments to study the skull effect and BBB opening were performed. It was found that through the macaque skull the pressure threshold for detecting the SCDh remained the same, while it increased for SCDu and ICD; through the human skull, it increased for all types of cavitation dose. The pressure threshold for detection the SCDh was the lowest, followed by SCDu and ICD. The positive or negative trend of cavitation doses to pressure increase remained the same through the skull, provided that the signal intensity surpassed the skull attenuation (macaque: 4.92 dB/mm, human: 7.33 dB/mm). The SNR for reliable detection for the PCD system used in this study is 1 dB. Using long pulses enabled reliable PCD monitoring and facilitates BBB opening at low pressures. The in vivo results showed that the SCDh was detected at pressures as low as 100 kPa; the ICD, at 250 kPa and could occur at lower pressures; the SCDu, at 700 kPa and was less reliable at lower pressures. Realtime monitoring of PCD was performed in vivo in macaques during BBB opening, and safe opening has been achieved at 250–600 kPa in both the thalamus and the putamen, with minimum or no inertial cavitation detected. Our study showed that transcranial PCD in macaques in vitro and in vivo as well as humans in vitro is reliable by improving the cavitation SNR to surpass the 1-dB detection limit.
Acknowledgments
The authors thank the reviewers for their valuable comments that have helped in improving the manuscript. This study was supported in part by the National Institutes of Health (R01 AG038961, R01 EB009041), the Wallace H. Coulter Foundation, the FUS Foundation, and the Kavli Foundation. S.-Y. W. would like to thank colleagues in the Ultrasound Elasticity Imaging Laboratory (UEIL), collaborators, and friends at Columbia University: Dr. Tobias Teichert (Department of Neuroscience) for insightful discussion in MR image analysis; Amanda Buch (Department of Neuroscience) for the assistance in handling the animals and fabricating the microbubbles; Gethemani Samiotaki (UEIL) and Stephen Dashnaw (Department of Radiology) for the suggestions in the MRI; Charlie Yongpravat (Department of Biomedical Engineering) for cutting the human skull; Girma Asfaw (Department of Neuroscience) for advices in handling the animals. C. S.-S. would like to thank the funding supported by the Alfonso Martin Escudero Foundation.
References
- 1.Tung YS, et al. Feasibility of noninvasive cavitation-guided blood-brain barrier opening using focused ultrasound and microbubbles in nonhuman primates. Applied Physics Letters. 2011 Apr 18;98:163704. doi: 10.1063/1.3580763. [DOI] [PMC free article] [PubMed] [Google Scholar]
- 2.McDannold N, et al. Temporary disruption of the blood-brain barrier by use of ultrasound and microbubbles: safety and efficacy evaluation in rhesus macaques. Cancer research. 2012;72:3652–63. doi: 10.1158/0008-5472.CAN-12-0128. [DOI] [PMC free article] [PubMed] [Google Scholar]
- 3.Wei KC, et al. Neuronavigation-guided focused ultrasound-induced blood-brain barrier opening: a preliminary study in swine. AJNR Am J Neuroradiol. 2013 Jan;34:115–20. doi: 10.3174/ajnr.A3150. [DOI] [PMC free article] [PubMed] [Google Scholar]
- 4.Alexandrov AV, et al. Ultrasound-enhanced systemic thrombolysis for acute ischemic stroke. N Engl J Med. 2004 Nov 18;351:2170–8. doi: 10.1056/NEJMoa041175. [DOI] [PubMed] [Google Scholar]
- 5.Culp WC, et al. Intracranial clot lysis with intravenous microbubbles and transcranial ultrasound in swine. Stroke; a journal of cerebral circulation. 2004;35:2407–11. doi: 10.1161/01.STR.0000140890.86779.79. [DOI] [PubMed] [Google Scholar]
- 6.McDannold N, et al. Transcranial magnetic resonance imaging- guided focused ultrasound surgery of brain tumors: initial findings in 3 patients. Neurosurgery. 2010 Feb;66:323–32. doi: 10.1227/01.NEU.0000360379.95800.2F. discussion 332. [DOI] [PMC free article] [PubMed] [Google Scholar]
- 7.Elias WJ, et al. A pilot study of focused ultrasound thalamotomy for essential tremor. N Engl J Med. 2013 Aug 15;369:640–8. doi: 10.1056/NEJMoa1300962. [DOI] [PubMed] [Google Scholar]
- 8.Coussios CC, et al. Role of acoustic cavitation in the delivery and monitoring of cancer treatment by high-intensity focused ultrasound (HIFU) Int J Hyperthermia. 2007 Mar;23:105–20. doi: 10.1080/02656730701194131. [DOI] [PubMed] [Google Scholar]
- 9.Coussios CC, Roy RA. Applications of acoustics and cavitation to noninvasive therapy and drug delivery. Annual Review of Fluid Mechanics. 2008;40:395–420. [Google Scholar]
- 10.Datta S, et al. Correlation of cavitation with ultrasound enhancement of thrombolysis. Ultrasound Med Biol. 2006 Aug;32:1257–67. doi: 10.1016/j.ultrasmedbio.2006.04.008. [DOI] [PMC free article] [PubMed] [Google Scholar]
- 11.McDannold N, et al. Targeted disruption of the blood-brain barrier with focused ultrasound: association with cavitation activity. Phys Med Biol. 2006 Feb 21;51:793–807. doi: 10.1088/0031-9155/51/4/003. [DOI] [PubMed] [Google Scholar]
- 12.Leighton TG. The Acoustic Bubble. 1994 [Google Scholar]
- 13.Chen WS, et al. Inertial cavitation dose and hemolysis produced in vitro with or without Optison. Ultrasound Med Biol. 2003 May;29:725–37. doi: 10.1016/s0301-5629(03)00013-9. [DOI] [PubMed] [Google Scholar]
- 14.Tung YS, et al. In vivo transcranial cavitation threshold detection during ultrasound-induced blood-brain barrier opening in mice. Phys Med Biol. 2010 Oct 21;55:6141–55. doi: 10.1088/0031-9155/55/20/007. [DOI] [PMC free article] [PubMed] [Google Scholar]
- 15.Chen CC, et al. Targeted drug delivery with focused ultrasound-induced blood-brain barrier opening using acoustically-activated nanodroplets. J Control Release. 2013 Oct 2;172:795–804. doi: 10.1016/j.jconrel.2013.09.025. [DOI] [PMC free article] [PubMed] [Google Scholar]
- 16.Pinton G, et al. Attenuation, scattering, and absorption of ultrasound in the skull bone. Med Phys. 2012 Jan;39:299–307. doi: 10.1118/1.3668316. [DOI] [PubMed] [Google Scholar]
- 17.Fry FJ, Barger JE. Acoustical properties of the human skull. J Acoust Soc Am. 1978 May;63:1576–90. doi: 10.1121/1.381852. [DOI] [PubMed] [Google Scholar]
- 18.Pichardo S, et al. Multi-frequency characterization of the speed of sound and attenuation coefficient for longitudinal transmission of freshly excised human skulls. Phys Med Biol. 2011 Jan 7;56:219–50. doi: 10.1088/0031-9155/56/1/014. [DOI] [PMC free article] [PubMed] [Google Scholar]
- 19.Pinton G, et al. Effects of nonlinear ultrasound propagation on high intensity brain therapy. Medical physics. 2011;38:1207–16. doi: 10.1118/1.3531553. [DOI] [PubMed] [Google Scholar]
- 20.White PJ, et al. Longitudinal and shear mode ultrasound propagation in human skull bone. Ultrasound Med Biol. 2006 Jul;32:1085–96. doi: 10.1016/j.ultrasmedbio.2006.03.015. [DOI] [PMC free article] [PubMed] [Google Scholar]
- 21.Clement GT, Hynynen K. A non-invasive method for focusing ultrasound through the human skull. Phys Med Biol. 2002 Apr 21;47:1219–36. doi: 10.1088/0031-9155/47/8/301. [DOI] [PubMed] [Google Scholar]
- 22.Deffieux T, Konofagou EE. Numerical study of a simple transcranial focused ultrasound system applied to blood-brain barrier opening. IEEE Trans Ultrason Ferroelectr Freq Control. 2010 Dec;57:2637–53. doi: 10.1109/TUFFC.2010.1738. [DOI] [PMC free article] [PubMed] [Google Scholar]
- 23.Marquet F, et al. Non-invasive transcranial ultrasound therapy based on a 3D CT scan: protocol validation and in vitro results. Phys Med Biol. 2009 May 7;54:2597–613. doi: 10.1088/0031-9155/54/9/001. [DOI] [PubMed] [Google Scholar]
- 24.Arvanitis CD, et al. Controlled ultrasound-induced blood-brain barrier disruption using passive acoustic emissions monitoring. PLoS ONE. 2012;7:e45783. doi: 10.1371/journal.pone.0045783. [DOI] [PMC free article] [PubMed] [Google Scholar]
- 25.Marquet F, et al. Real-time transcranial monitoring of safe blood-brain barrier opening in non-human primates. PLoS ONE. 2014;9:e84310. doi: 10.1371/journal.pone.0084310. [DOI] [PMC free article] [PubMed] [Google Scholar]
- 26.Arvanitis CD, et al. Combined ultrasound and MR imaging to guide focused ultrasound therapies in the brain. Phys Med Biol. 2013 Jul 21;58:4749–61. doi: 10.1088/0031-9155/58/14/4749. [DOI] [PMC free article] [PubMed] [Google Scholar]
- 27.Jones RM, et al. Transcranial passive acoustic mapping with hemispherical sparse arrays using CT-based skull-specific aberration corrections: a simulation study. Phys Med Biol. 2013 Jul 21;58:4981–5005. doi: 10.1088/0031-9155/58/14/4981. [DOI] [PMC free article] [PubMed] [Google Scholar]
- 28.O’Reilly MA, Hynynen K. A super-resolution ultrasound method for brain vascular mapping. Med Phys. 2013 Nov;40:110701. doi: 10.1118/1.4823762. [DOI] [PMC free article] [PubMed] [Google Scholar]
- 29.Marquet F, et al. Feasibility study of a clinical blood-brain barrier opening ultrasound system. Nano Life. 2011;1:1–14. doi: 10.1142/S1793984410000286. [DOI] [PMC free article] [PubMed] [Google Scholar]
- 30.Feshitan JA, et al. Microbubble size isolation by differential centrifugation. J Colloid Interface Sci. 2009 Jan 15;329:316–24. doi: 10.1016/j.jcis.2008.09.066. [DOI] [PubMed] [Google Scholar]
- 31.Marquet F, et al. Noninvasive, transient and selective blood-brain barrier opening in non-human primates in vivo. PLoS ONE. 2011;6:e22598. doi: 10.1371/journal.pone.0022598. [DOI] [PMC free article] [PubMed] [Google Scholar]
- 32.Tung YS, et al. Identifying the inertial cavitation threshold and skull effects in a vessel phantom using focused ultrasound and microbubbles. Ultrasound Med Biol. 2010 May;36:840–52. doi: 10.1016/j.ultrasmedbio.2010.02.009. [DOI] [PMC free article] [PubMed] [Google Scholar]
- 33.Smith SM, et al. Advances in functional and structural MR image analysis and implementation as FSL. Neuroimage. 2004;23(Suppl 1):S208–19. doi: 10.1016/j.neuroimage.2004.07.051. [DOI] [PubMed] [Google Scholar]
- 34.Dollet B, et al. Nonspherical oscillations of ultrasound contrast agent microbubbles. Ultrasound Med Biol. 2008 Sep;34:1465–73. doi: 10.1016/j.ultrasmedbio.2008.01.020. [DOI] [PubMed] [Google Scholar]
- 35.Radhakrishnan K, et al. Relationship between cavitation and loss of echogenicity from ultrasound contrast agents. Phys Med Biol. 2013 Sep 21;58:6541–63. doi: 10.1088/0031-9155/58/18/6541. [DOI] [PMC free article] [PubMed] [Google Scholar]
- 36.Chang PP, et al. Thresholds for inertial cavitation in albunex suspensions under pulsed ultrasound conditions. IEEE Trans Ultrason Ferroelectr Freq Control. 2001 Jan;48:161–70. doi: 10.1109/58.895927. [DOI] [PubMed] [Google Scholar]
- 37.Chen CC, et al. An experimental study on the stiffness of size-isolated microbubbles using atomic force microscopy. IEEE Trans Ultrason Ferroelectr Freq Control. 2013 Mar;60:524–534. doi: 10.1109/TUFFC.2013.2594. [DOI] [PMC free article] [PubMed] [Google Scholar]
- 38.Chen WS, et al. A comparison of the fragmentation thresholds and inertial cavitation doses of different ultrasound contrast agents. J Acoust Soc Am. 2003 Jan;113:643–51. doi: 10.1121/1.1529667. [DOI] [PubMed] [Google Scholar]
- 39.Ammi AY, et al. Ultrasonic contrast agent shell rupture detected by inertial cavitation and rebound signals. IEEE Trans Ultrason Ferroelectr Freq Control. 2006 Jan;53:126–36. doi: 10.1109/tuffc.2006.1588398. [DOI] [PMC free article] [PubMed] [Google Scholar]
- 40.Bader KB, Holland CK. Gauging the likelihood of stable cavitation from ultrasound contrast agents. Phys Med Biol. 2013 Jan 7;58:127–44. doi: 10.1088/0031-9155/58/1/127. [DOI] [PMC free article] [PubMed] [Google Scholar]
- 41.Sun T, et al. Ambient pressure dependence of the ultra-harmonic response from contrast microbubbles. J Acoust Soc Am. 2012 Jun;131:4358–64. doi: 10.1121/1.4707512. [DOI] [PubMed] [Google Scholar]
- 42.Choi JJ, et al. Noninvasive and localized blood-brain barrier disruption using focused ultrasound can be achieved at short pulse lengths and low pulse repetition frequencies. J Cereb Blood Flow Metab. 2010 Sep 15; doi: 10.1038/jcbfm.2010.155. [DOI] [PMC free article] [PubMed] [Google Scholar]
- 43.Duck FA. Physical properties of tissue: a comprehensive reference book. Academic Press; 1990. Physical properties of tissue at ultrasonic frequencies; pp. 73–135. illustrated ed. [Google Scholar]
- 44.Samiotaki G, Konofagou EE. Dependence of the reversibility of focused- ultrasound-induced blood-brain barrier opening on pressure and pulse length in vivo. IEEE Trans Ultrason Ferroelectr Freq Control. 2013 Nov;60:2257–65. doi: 10.1109/TUFFC.2013.6644731. [DOI] [PMC free article] [PubMed] [Google Scholar]
- 45.O’Reilly MA, Hynynen K. Blood-Brain Barrier: Real-time Feedback-controlled Focused Ultrasound Disruption by Using an Acoustic Emissions-based Controller. Radiology. 2012 Apr;263:96–106. doi: 10.1148/radiol.11111417. [DOI] [PMC free article] [PubMed] [Google Scholar]