

Significance
Whereas many heritable obesity phenotypes are known, lean phenotypes are comparatively uncommon. Yet they can reveal critical checkpoints regulating energy balance. During a large-scale random germ-line mutagenesis project, we identified mice with a lean phenotype, myopathy, excessive energy expenditure despite diminished cage activity, and impaired glucose tolerance. This phenotype, termed “supermodel,” was strictly recessive and was ascribed to a missense mutation in Sterile alpha motif domain containing protein 4 (Samd4), a gene encoding an RNA-binding protein with no previously known function in mammals. This study provides evidence that Samd4 modulates the activities of the mechanistic target of rapamycin complex 1, a master regulator of metabolism.
Keywords: Akt/PKB, N-ethyl-N-nitrosourea
Abstract
Sterile alpha motif domain containing protein 4 (Samd4) is an RNA binding protein that mediates translational repression. We identified a Samd4 missense mutation, designated supermodel, that caused leanness and kyphosis associated with myopathy and adipocyte defects in C57BL/6J mice. The supermodel mutation protected homozygous mice from high fat diet-induced obesity, likely by promoting enhanced energy expenditure through uncoupled mitochondrial respiration. Glucose tolerance was impaired due to diminished insulin release in homozygous mutant mice. The defects of metabolism in supermodel mice may be explained by dysregulated mechanistic target of rapamycin complex 1 (mTORC1) signaling, evidenced by hypophosphorylation of 4E-BP1 and S6 in muscle and adipose tissues of homozygous mice. Samd4 may interface with mTORC1 signaling through an interaction with 14-3-3 proteins and with Akt, which phosphorylates Samd4 in vitro.
Sterile alpha motif domain containing protein 4 (Samd4; also called Smaug1) is a mammalian homolog of Drosophila Smaug, a translational repressor in fly embryos (1, 2). Sterile alpha motifs (SAM) have been shown to directly bind mRNA with stem-loop structures known as Smaug recognition elements (SRE) having the consensus sequence CNGG or CNGGN (3–5). Several studies have investigated the function of Samd4 in cultured mammalian cells. For example, when ectopically expressed in mammalian cells, Samd4 formed cytoplasmic granules containing polyadenylated RNA and markers of stress granules (6). Samd4 was also reportedly detected in neuronal dendrites, within mRNA-silencing foci that disassembled in response to the neurotransmitter N-methyl-d-aspartate (7). Recently, Samd4 overexpression was shown to suppress hallmarks of myotonic dystrophy-1 (DM1; Online Mendelian Inheritance in Man no. 160900) in a Drosophila model of the disease and in myoblasts from DM1 patients (8). However, the physiological role of Samd4 in mammals remains unknown.
Here, we describe an N-ethyl-N-nitrosourea (ENU)-induced phenotype identified because homozygous mice are exceptionally thin and, therefore, named supermodel. The supermodel phenotype was attributed to a missense mutation of Samd4. Our data indicate that Samd4 is required for metabolic homeostasis and mechanistic target of rapamycin complex 1 (mTORC1) signaling.
Results
The supermodel Phenotype.
We observed a mouse with a markedly lean body and thoracic kyphosis among the third generation (G3) of C57BL/6J mice carrying mutations induced by ENU (Fig. 1A). The recessive phenotype, named supermodel (spmd), was transmitted in Mendelian fashion equally to male and female offspring, suggesting that an autosomal loss-of-function mutation was responsible. Both male and female homozygotes were highly infertile. Mutant mice had a statistically shortened life span compared with control littermates, with deaths beginning at approximately 3 mo of age (Fig. 1B).
Fig. 1.

The supermodel phenotype. (A) Leanness and kyphosis in a male spmd homozygote at 8 wk of age. An age-matched male WT C57BL/6J mouse is shown at the top of Left. (B) Kaplan–Meier survival curve (n = 11 WT mice, 11 spmd mice). P = 0.018, Log-rank test. (C) Body weight of mice maintained on regular chow or HFD was monitored weekly for 20 wk beginning at 4 wk of age. Kaplan–Meier curves showing deaths of spmd homozygotes during the period of monitoring (Right). Mouse numbers at start of experiment: regular chow, n = 6 male and 7 female WT mice, n = 10 male and 6 female spmd mice; HFD, n = 13 male and 11 female WT mice, n = 8 male and 5 female spmd mice. (D) Total fat and muscle volume of 8-wk-old male homozygous spmd (n = 3) and WT littermates (n = 3) determined by CT analysis. (E) Representative photographs of eWAT and iWAT from 9-wk-old male mice. (F) Weights of eWAT and iWAT normalized to body weight in 16-wk-old mice (n = 4 male and 4 female WT mice, 4 male and 5 female homozygous spmd mice). Data in C, D, and F represent means ± SD. P values were determined by Student t test unless indicated.
Male and female homozygous spmd mice fed standard rodent chow exhibited lower body weight, body mass index, and body length relative to wild-type littermates (Fig. 1C and Table S1). When challenged with a high fat diet (HFD), wild-type mice increased their initial body weight 1.5-fold (males; P < 0.01) or 1.8-fold (females; P < 0.01) over a 6-mo period, whereas spmd homozygotes increased it by only 1.3-fold (males; P = 0.028) or 1.1-fold (females; P = 0.10) (Fig. 1C), indicating elevated resistance to HFD-induced obesity in spmd mice. Circulating levels of cholesterol and high-density lipoprotein (HDL) were reduced, whereas low-density lipoprotein (LDL) was elevated in spmd compared with wild-type mice (Table S2). Pathology analysis of liver sections suggested steatosis in 1 of 4 homozygous spmd mice.
We investigated the weight difference between spmd and wild-type mice by using computed tomography (CT), which indicated that spmd mice had reduced fat and muscle tissue (Fig. 1D). The reductions in spmd mice of both fat and muscle volume were proportionate to the overall reduction in whole body volume (Fig. S1A). However, the proportion of total fat volume corresponding to visceral fat was decreased, whereas the proportion of total fat volume corresponding to s.c. fat was increased, indicating an alteration in fat distribution in spmd mice (Fig. S1B). No change in bone mineral density or bone mineral content was observed in spmd mice (Fig. S1C).
We collected adipose tissues from 15-wk-old male and female spmd and wild-type littermates. Consistent with the lean phenotype of mutants, the weights of epigonadal white adipose tissue (eWAT) and inguinal WAT (iWAT) from spmd mice were significantly reduced relative to those of wild-type mice after normalization with respect to body weight (Fig. 1 E and F). Histological analysis of white adipose tissue from 8- to 10-wk-old spmd mice showed numerous white adipocytes with heterogeneous morphology characterized by reduced cell size and abnormal fat droplet accumulation in the cytoplasm (Fig. 2A and Fig. S2). The weight of interscapular brown adipose tissue (iBAT) was not significantly changed (Fig. S1D), and no morphological defects were observed in iBAT of spmd mice (Fig. S2), suggesting that adipose tissue defects mainly occur in WAT.
Fig. 2.

Adipocyte defects and myopathy in spmd mice. (A) Sections from eWAT of 8- to 10-wk-old WT and homozygous spmd mice were examined by bright field (Upper) and fluorescence microscopy (Lower). (B) Hind limb muscle sections from 8- to 10-wk-old WT and homozygous spmd mice. (Top) H&E staining of gastrocnemii. Green arrowhead indicates myofibers with irregular shapes. Metachromatic ATPase staining (Middle), and myosin (Type I, slow) staining (Bottom). Filled triangles indicate soleus (Sol); open triangles indicate gastrocnemius (Gast). (Scale bars: 60 μm.)
We also examined muscle histology in spmd mice. H&E staining of hind limb muscle sections showed widely scattered focal myopathy in gastrocnemius, soleus, extensor digitorum longus, and tibialis anterior muscles of spmd homozygotes. The myopathy was characterized by focal myofibers with irregular shapes and heterogeneous sizes (Fig. 2B). We also observed a few instances of myofibers with centralized nuclei, indicating constitutive myofiber degeneration and regeneration (Fig. S3). In addition, Periodic Acid-Schiff staining showed increased glycogen content in spmd muscles (Fig. S3). Myofiber typing by metachromatic ATPase staining or immunohistochemistry showed that the size of slow-twitch (type I) fibers was greatly reduced in gastrocnemius muscle (Fig. 2B).
The spmd phenotype is thus characterized by leanness, resistance to HFD-induced obesity, reduced adipose and muscle tissue, and abnormalities in the morphology of myofibers and adipocytes.
A Mutation of Samd4 Causes the spmd Phenotype.
To identify the mutation responsible for the spmd phenotype, F1 mice produced by intracytoplasmic injection of sperm from spmd homozygotes into eggs from C57BL/10J mice were intercrossed, and a total of 43 F2 offspring (10 with lean phenotype and 33 with normal body size) were used for genetic mapping by bulk segregation analysis (BSA). We detected peak linkage of the phenotype (LOD 5.41) with a single nucleotide polymorphism (SNP) at 55054219 bp on chromosome 14 (Fig. 3A), within a critical region bounded by SNPs at 29705069 and 76795502 bp (National Center for Biotechnology Information m38). Whole genome SOLiD sequencing of coding exons and splice junctions identified a single mutation within the critical region, an A to C transversion at 47016337 bp on chromosome 14 within Samd4 (Fig. 3B). The mutation occurs at 994 bp within the Samd4 transcript (Vega OTTMUST00000057924) and leads to a histidine-to-proline substitution at amino acid 86 of the 711-aa Samd4 isoform 1 and the 623-aa Samd4 isoform 2. Expression of Samd4 was detected in both muscle and fat tissue of wild-type mice, with 9- to 10-fold higher levels in muscle than in eWAT (Fig. S4A). Samd4 is one of two mammalian homologs of Drosophila Smaug, which functions to repress translation of developmental regulators such as nanos in fly embryos (1, 9). The second mammalian Smaug homolog is Samd4B; it reportedly repressed transcription in a SAM domain-dependent manner upon overexpression in HEK293 cells (10).
Fig. 3.

Identification of the spmd mutation in Samd4. (A) Chromosomal mapping of the spmd mutation by BSA. LOD, logarithm of odds score. (B) DNA sequence chromatogram of the mutated nucleotide in Samd4. (C) Domain structure of Samd4. The spmd mutation is indicated in red. SAM, sterile alpha motif; SSR, Smaug similarity region.
Human and mouse Samd4 share sequence similarity with Smaug within two N-terminal regions designated Smaug similarity region (SSR) 1 and SSR2, and in the RNA-binding SAM domain (3, 4). The spmd mutation affects a histidine within SSR2 (Fig. 3C) and is predicted to be probably damaging by PolyPhen-2 (score 1.000). Intact expression of mutant Samd4 protein was detected in heart lysates from homozygous spmd mice, indicating that the mutation does not abrogate protein expression (Fig. S4B).
Genotyping of individual mice from mapping crosses confirmed homozygosity of the Samd4 mutation in each mouse with the lean phenotype, but none of the mice with normal body size. A BAC containing C57BL/6J genomic DNA encompassing the Samd4 5′UTR through the third exon was modified by replacing exon sequences downstream from the start codon with a Samd4-GFP cDNA construct encoding Samd4 isoform 2 (Fig. S5A). Sequencing identified no mutations in other genes contained by the modified BAC, which were LOC102638347 and a partial sequence of Cgrrf1, both genes of unknown function. Transgenic expression of the modified BAC in homozygous spmd mice (Fig. S5 B and C) significantly increased their body size and weight (Fig. S5 D and E); more complete rescue of the phenotype may result from transgenic expression of both Samd4 isoforms 1 and 2. We also performed CT analysis to determine whether fat or muscle tissue might be improved preferentially by transgenic Samd4 expression. Fat volume and muscle volume relative to total body volume in transgenic spmd homozygotes were similar to those of wild-type mice, indicating that transgene expression rescued both fat and muscle, increasing them in their normal proportions relative to total body volume (Fig. S5F). The alteration in visceral and s.c. fat distribution observed in homozygous spmd mice was corrected by the transgene (Fig. S5G). These data demonstrate that the spmd phenotype is caused by the H86P mutation of Samd4.
Altered Glucose Metabolism in spmd Mice.
The effects of the spmd mutation on adipose and muscle tissue led us to examine metabolic parameters in spmd mice. Spmd homozygotes 10 to 12 wk of age had reduced fasting glucose and insulin levels compared with wild-type mice (Fig. 4 A and B). However, i.p. glucose tolerance tests showed delayed clearance of glucose from the blood of spmd mice compared with wild-type mice (Fig. 4C), consistent with diminished insulin release or diminished insulin sensitivity on the part of energy storage tissues. Insulin tolerance tests demonstrated elevated insulin sensitivity in spmd mice (Fig. 4D), whereas hyperglycemic clamp showed impaired insulin release by pancreatic beta cells in spmd mice in response to plasma glucose (Fig. 4E). The ratio of glucose infusion rate to plasma insulin concentration during hyperglycemic clamp was elevated in spmd mice, although not significantly at all timepoints, supporting moderately increased insulin sensitivity in these mice (Fig. S6A). Arginine tolerance testing of spmd mice confirmed the reduced capacity of beta cells to release insulin (Fig. S6B). These data demonstrate altered glucose metabolism in spmd mice characterized by compromised ability to release insulin but high insulin sensitivity of glucose-consuming tissues.
Fig. 4.
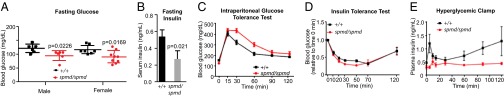
Altered glucose metabolism in spmd mice. (A) Blood glucose was measured in mice fasted for 5 h. Each data point represents one mouse, and the bar indicates the mean of all values; error bars represent SEM. (B) Serum insulin was measured in male WT (n = 6), and homozygous spmd mice (n = 6) fasted for 5 h. (C) i.p. glucose tolerance test. Blood glucose was measured at the indicated times after i.p. glucose injection in male WT (n = 10) and homozygous spmd mice (n = 10). For 0, 15, 30, 60, 90, and 120 min, respectively, P = 0.026, 0.198, 0.0009, 0.0015, 0.0017, and 0.0020. (D) Insulin tolerance test. Blood glucose was measured at the indicated times after i.p. insulin injection in male WT (n = 7) and homozygous spmd mice (n = 9). For 20, 30, and 50 min, respectively, P = 0.067, 0.009, 0.010. (E) Hyperglycemic clamp. Plasma insulin was measured at the indicated times during glucose infusion in male WT (n = 8) and homozygous spmd mice (n = 5). For 0, 5, 10, 15, 30, 60, 90, and 120 min, respectively, P = 0.050, 0.040, 0.100, 0.063, 0.059, 0.027, 0.045, and 0.040. Data in B–E represent means ± SEM. P values were determined by the Student t test.
Uncoupled Respiration in WAT and Skeletal Muscle of spmd Mice.
To understand the nature of the energy imbalance that leads to leanness in spmd mice, we examined their energy expenditure and caloric intake. We assessed energy expenditure in vivo by metabolic cage studies of 10- to 12-wk-old male homozygous spmd and wild-type mice. Spmd mice had significantly enhanced oxygen consumption and carbon dioxide production over a 72-h period, indicative of elevated energy expenditure (Fig. 5A). Paradoxically, spmd mice were hypoactive, as shown by decreased ambulatory movement and exploratory rearing/jumping relative to wild-type mice, especially during the dark period of the light cycle (Fig. 5B). We found that caloric intake normalized to body weight was similar between spmd and wild-type mice (Fig. 5C). Thus, spmd mice consumed a similar number of calories as wild-type mice, but expended a dramatically greater amount of energy despite diminished mobility.
Fig. 5.

Elevated energy expenditure and reduced mobility of spmd mice. (A–C) Metabolic profiling of WT (n = 6) and homozygous spmd mice (n = 6) over a 72-h period. (A) Oxygen consumption and carbon dioxide production. (B) Ambulatory motion and rearing/jumping motions as measured by cage beam breaks. (C) Food intake per day normalized to body weight. (D and E) Expression of mitochondrial uncoupling genes and brown fat markers in eWAT (D) and skeletal muscle (E) of WT (n = 5) and homozygous spmd mice (n = 5). Expression levels were normalized to 18S rRNA expression. Data represent means ± SD. P values were determined by Student t test.
The disparity between activity and energy expenditure led us to hypothesize that mitochondrial respiration may be uncoupled from ATP generation in spmd mice. We tested the expression of mitochondrial uncoupling genes and brown fat markers in WAT by quantitative PCR. Ucp1 and Ucp3 are uncoupling genes and markers of brown fat, and both showed significant increases in expression in spmd compared with wild-type eWAT (Fig. 5D). In addition, brown fat markers Ppara and Cidea, and uncoupling gene Ucp2, were elevated in spmd eWAT (Fig. 5D). These data suggest a switch by spmd eWAT to a brown-like adipocyte identity characterized by the expression of thermogenic genes. However, Ppargc1a, encoding PGC-1α, and Prdm16, key transcriptional regulators of brown adipocyte development, were expressed at wild-type levels in spmd eWAT. It may be that PGC-1α and PRDM16 are controlled at the posttranscriptional level in spmd eWAT, as has been shown for PRDM16 induced by PPARγ agonists (11). Up-regulation of Ucp2, Cidea, and Prdm16 expression were observed in spmd skeletal muscle (Fig. 5E). Together, these data strongly suggest that mitochondrial uncoupling results in increased energy expenditure by spmd mice.
Samd4 Is Necessary for mTORC1 Signaling in Vivo, Is Phosphorylated by Akt, and Interacts with 14-3-3 Proteins in Vitro.
mTORC1 is a key regulator of cell growth and metabolism, affecting the activities of signaling pathways involved in nutrient uptake, protein and lipid synthesis, energy expenditure, and autophagy (12). Raptor is an mTORC1 component that functions as a scaffold protein regulating substrate binding to the complex. Spmd mice phenocopied muscle- and adipose-specific Raptor mutants in many aspects, such as reduced adipose tissue and skeletal muscle mass, muscular dystrophy, resistance to HFD-induced obesity, and elevated oxidative respiration due to mitochondrial uncoupling in adipose tissue (13, 14). We therefore hypothesized that Samd4 may be necessary for mTORC1 signaling. In support of this hypothesis, we found that the mTORC1 target eIF4E binding protein 1 (4E-BP1), and also S6, a substrate of the mTORC1 target S6 kinase 1 (S6K1), were hypophosphorylated in both muscle and adipose tissues from homozygous spmd mice compared with wild-type mice (Fig. 6A).
Fig. 6.

Samd4 is required for mTORC1 signaling. (A) Lysates of muscle or eWAT from 12- to 15-wk-old WT and homozygous spmd mice were immunoblotted by using the indicated antibodies. (B and C) Flag-tagged wild-type Samd4 or Samd4-H86P were transiently overexpressed in 293T cells or stably expressed in C2C12 myoblasts. Myc-tagged 14-3-3ζ protein was cooverexpressed in 293T cells. Flag or Myc immunoprecipitates were immunoblotted by using the indicated antibodies. (B) Flag immunoblots (Upper) were reprobed with either 14-3-3 or Myc antibodies (Lower). Lanes 1 and 4 contain 10% of the IPs from C2C12 cells; lanes 1 and 2 contain 100% of the IPs from 293T cells. (C) 50% of Flag immunoprecipitates from C2C12 cells were immunoblotted using Flag antibody (Upper). The remaining 50% of the same immunoprecipitates were also immunoblotted with p-Ser-14-3-3 binding motif antibody (Lower). (D) In vitro kinase assay. Five micrograms of purified recombinant proteins visualized by Coomassie blue staining (Left). Recombinant proteins were incubated for 30 min with ATP and HA-tagged activated Akt immunoprecipitated from 293T cells. Reaction mixtures were immunoblotted with phospho-Akt substrate and HA antibodies (Right).
We sought to identify Samd4-interacting proteins as a means to understand the mechanism of Samd4 function. We used C2C12 myoblast cells stably expressing Flag-tagged wild-type Samd4 or Samd4-H86P for quantitative mass spectrometric analysis following immunoprecipitation with Flag antibody. Wild-type Samd4 and Samd4-H86P immunoprecipitates contained, respectively, 220 and 212 putative interactors (Dataset S1). Samd4 itself was among the proteins with the highest spectral counts, indicating effective pull down of the target protein complex. None of the known mTORC1 complex components were found in either wild-type or mutant Samd4 immunoprecipitates. However, among wild-type Samd4 interactors were six of seven mammalian 14-3-3 protein isoforms, which were represented with high spectral counts, ε and ζ being the most abundant. Three of the isoforms (η, θ, β) were completely absent, and three were present in greatly reduced amounts (ε, ζ, γ) in the Samd4-H86P immunoprecipitate.
The 14-3-3 proteins propagate signaling in numerous pathways by binding to phosphorylated serine residues within the consensus sequences (R/K)XX(pS/pT)XP (mode I) and RX(F/Y)X(pS)XP (mode II), with mode I sequences more prevalent among reported 14-3-3 binding proteins (15, 16). Two putative 14-3-3 binding motifs were identified in Samd4 that conformed to the mode I motif (RSV(pS)LT, aa 251–265; KTR(pS)LP, aa 655–660) (17). By immunoprecipitation and immunoblotting, we confirmed an interaction between Samd4 and 14-3-3 in Flag-Samd4–expressing C2C12 cells and in 293T cells overexpressing Samd4 and 14-3-3 (Fig. 6B). Moreover, we showed that Samd4 is phosphorylated on serine(s) within a 14-3-3 binding motif (Fig. 6C). Consistent with the mass spectrometry data, Flag-Samd4-H86P failed to pull down 14-3-3 proteins (Fig. 6B), and was not phosphorylated on serine(s) within any 14-3-3 binding motif (Fig. 6C). These data suggest that 14-3-3 proteins exist in a complex with phosphorylated Samd4, but not Samd4-H86P.
The serine/threonine kinase Akt/PKB phosphorylates sites within a consensus sequence similar to the 14-3-3 binding motif (RXRXX[S/T]), and Samd4 contains such a motif (RGRSDS; aa 163–168) (17). We therefore tested whether Akt is capable of phosphorylating Samd4 in vitro. Incubation of purified recombinant GST-Samd4 or GST-Samd4-H86P with ATP and activated Akt (myr-Akt1-HA) immunoprecipitated from 293T cells resulted in accumulation of phosphate groups on Akt phosphorylation sites in wild-type Samd4 (Fig. 6D). However, Akt failed to phosphorylate Samd4-H86P, and the negative control protein 4E-BP1 (18). Thus, Samd4 is subject to phosphorylation by Akt in vitro. The spmd mutation, which lies outside putative Akt phosphorylation site consensus sequences, may disrupt the conformation of Samd4 and, thereby, prevent phosphorylation.
Discussion
The striking resemblance of the spmd phenotype to the phenotypes of muscle- and adipose-specific Raptor mutants (13, 14), together with significantly diminished levels of phosphorylation on 4E-BP1 and S6 in spmd tissues, provides strong evidence that Samd4 plays an important role in metabolic regulation in conjunction with mTORC1 in vivo. Samd4 coimmunoprecipitated with all 14-3-3 isoforms in the muscle progenitor cell line C2C12, suggesting that Samd4 may mediate its effects through interactions with 14-3-3 proteins. The 14-3-3 proteins have been shown to play a positive role in mTORC1 signaling through sequestration of the mTOR inhibitor PRAS40 (19), and through binding and inhibition of TSC2, a negative regulator of mTORC1 (20). Similarly, Akt activates mTORC1 by mediating the inhibitory phosphorylation of PRAS40 and TSC2 (21, 22). Akt also phosphorylates Samd4, supporting the hypothesis that Samd4, 14-3-3, PRAS40, and TSC2 function together in a regulatory network downstream from Akt that activates mTORC1.
Samd4 is known as a translational repressor that binds directly to RNA. In Drosophila, Smaug inhibits translation by blocking the formation of a competent translation initiation complex (9, 23), by promoting deadenylation of target mRNAs leading to their destabilization and degradation (24–26), and by microRNA-independent recruitment of Argonaute 1 (Ago1) to target mRNAs (27). RNA immunoprecipitation combined with microarray analysis demonstrated that Smaug binds directly to numerous embryonic fly RNAs, including those encoding glycolytic enzymes, and components of the proteasome regulatory particle, the TRiC/CCT chaperonin, and lipid droplets (28). In total, Smaug has been shown to destabilize ∼1,000 RNAs in fly embryos (2). Human Samd4 has been shown to both repress and promote translation under conditions of overexpression (6, 8).
Whether the metabolic regulatory role of Samd4 involves RNA binding and translational repression remains unknown. Nonetheless, it is notable that mTORC1 is a primary regulator of translation, acting through S6K1 and 4E-BP1, key translational regulators that promote protein synthesis when phosphorylated by mTORC1 (29). Global analysis of the targets of acute translational regulation by mTORC1 in mouse embryonic fibroblasts demonstrated wide variation in their levels of translation, indicating that the targets of mTORC1 are differentially regulated, although the mechanisms that mediate this fine tuning are not known (30). Our findings raise the possibility that RNA binding and translational regulation by Samd4 represent one mechanism for modulating mTORC1-dependent translation.
The energy-wasting diathesis and inanition of supermodel homozygotes leads us to hypothesize that dysregulation of Samd4 and/or associated proteins may occur in chronic diseases of infectious and neoplastic etiology, where identical metabolic problems are commonly observed. Because Samd4 is expressed much more prominently in muscle than in fat, it is also plausible to consider that some of the effects of Samd4 mutation are not cell intrinsic, but mediated by unknown molecules that communicate between these two cell types. If extracellular signals influence Samd4, they might consequently influence metabolic activity.
Materials and Methods
Detailed materials and methods are described in SI Materials and Methods.
Mice and in Vivo Analyses.
Mice were fed standard chow (Teklad 2016 Harlan) or 60 kcal % high-fat diet (Research Diet) and maintained at the University of Texas Southwestern Medical Center in accordance with institutionally approved protocols. The spmd strain (C57BL/6J-Samd4m1Btlr; Mouse Genome Informatics ID 5547989) was generated by ENU mutagenesis, is described at http://mutagenetix.utsouthwestern.edu, and is available from the Mutant Mouse Regional Resource Center. CT scans; metabolic profiling; glucose, insulin, and arginine tolerance tests; and hyperglycemic clamp are described in SI Materials and Methods.
Plasmids and RT-PCR.
The full-length mouse wild-type Samd4 isoform 1 (Samd4v1) and isoform 2 (Samd4v2) cDNAs were cloned in-frame into pCMV-tag2B (Stratagene), pEGFP-N3 (Clontech), or pGEX6P1 (GE Life Sciences) vectors. cDNA encoding 14-3-3ζ was cloned in frame into the pCMV-tag3B vector (Stratagene). To generate Samd4-H86P, pCMV-tag2B-Samd4v1 was used as the template for site-directed mutagenesis PCR by using high-fidelity Phusion enzyme (NEB) and the primers: 5′-tcccttctgctaactcccctgcctttgctgaag-3′; 5′-cttcagcaaaggcaggggagttagcagaaggga-3′. The PCR product was digested with DpnI restriction enzyme and transformed into competent cells. All plasmids were verified by DNA sequencing. RNA isolation and RT-PCR was performed by using standard procedures.
BAC Transgenesis.
The modified BAC containing Samd4v2 cDNA was generated as described in SI Materials and Methods.
Transfection and Immunoprecipitation.
C2C12 myoblasts and 293T cells were transfected with the indicated plasmids using Lipofectamine LTX with Plus Reagents (Invitrogen Life Technologies) or TransIT-LT1 (Mirus Bio), respectively, according to the manufacturer’s instructions. Immunoprecipitations were carried out by using standard procedures, as described in SI Materials and Methods.
Expression of GST-Tagged Fusion Proteins and in Vitro Kinase Assay.
GST, GST-Samd4, GST-Samd4-H86P, and MBP-4E-BP1 were expressed and purified from BL21-CodonPlus (DE3)-RIPL competent cells (Agilent) by using standard procedures. For in vitro kinase assays, transiently expressed HA-tagged Akt1 was immunoprecipitated from 293T cells and incubated with ATP and the purified recombinant proteins as described in SI Materials and Methods.
Immunohistochemistry and Metachromatic ATPase Staining.
Tissues were fixed, sectioned, and stained with H&E or myosin (skeletal, slow) antibody (Sigma-Aldrich) according to standard procedures. Fiber typing by metachromatic dye-ATPase method was performed as described in SI Materials and Methods.
Supplementary Material
Acknowledgments
This work was supported by National Institutes of Health Grant U19 AI100627.
Footnotes
The authors declare no conflict of interest.
Data deposition: The mutant mouse strain reported in this paper has been deposited in the Mouse Genome Informatics database (accession no. 5547989), and the Mutant Mouse Regional Resource Center repository (ID# 37155-MU).
This article contains supporting information online at www.pnas.org/lookup/suppl/doi:10.1073/pnas.1406511111/-/DCSupplemental.
References
- 1.Smibert CA, Wilson JE, Kerr K, Macdonald PM. smaug protein represses translation of unlocalized nanos mRNA in the Drosophila embryo. Genes Dev. 1996;10(20):2600–2609. doi: 10.1101/gad.10.20.2600. [DOI] [PubMed] [Google Scholar]
- 2.Tadros W, et al. SMAUG is a major regulator of maternal mRNA destabilization in Drosophila and its translation is activated by the PAN GU kinase. Dev Cell. 2007;12(1):143–155. doi: 10.1016/j.devcel.2006.10.005. [DOI] [PubMed] [Google Scholar]
- 3.Aviv T, et al. The RNA-binding SAM domain of Smaug defines a new family of post-transcriptional regulators. Nat Struct Biol. 2003;10(8):614–621. doi: 10.1038/nsb956. [DOI] [PubMed] [Google Scholar]
- 4.Green JB, Gardner CD, Wharton RP, Aggarwal AK. RNA recognition via the SAM domain of Smaug. Mol Cell. 2003;11(6):1537–1548. doi: 10.1016/s1097-2765(03)00178-3. [DOI] [PubMed] [Google Scholar]
- 5.Aviv T, Lin Z, Ben-Ari G, Smibert CA, Sicheri F. Sequence-specific recognition of RNA hairpins by the SAM domain of Vts1p. Nat Struct Mol Biol. 2006;13(2):168–176. doi: 10.1038/nsmb1053. [DOI] [PubMed] [Google Scholar]
- 6.Baez MV, Boccaccio GL. Mammalian Smaug is a translational repressor that forms cytoplasmic foci similar to stress granules. J Biol Chem. 2005;280(52):43131–43140. doi: 10.1074/jbc.M508374200. [DOI] [PubMed] [Google Scholar]
- 7.Baez MV, et al. Smaug1 mRNA-silencing foci respond to NMDA and modulate synapse formation. J Cell Biol. 2011;195(7):1141–1157. doi: 10.1083/jcb.201108159. [DOI] [PMC free article] [PubMed] [Google Scholar]
- 8.de Haro M, et al. Smaug/SAMD4A restores translational activity of CUGBP1 and suppresses CUG-induced myopathy. PLoS Genet. 2013;9(4):e1003445. doi: 10.1371/journal.pgen.1003445. [DOI] [PMC free article] [PubMed] [Google Scholar]
- 9.Jeske M, Moritz B, Anders A, Wahle E. Smaug assembles an ATP-dependent stable complex repressing nanos mRNA translation at multiple levels. EMBO J. 2011;30(1):90–103. doi: 10.1038/emboj.2010.283. [DOI] [PMC free article] [PubMed] [Google Scholar]
- 10.Luo N, et al. SAMD4B, a novel SAM-containing protein, inhibits AP-1-, p53- and p21-mediated transcriptional activity. BMB Rep. 2010;43(5):355–361. doi: 10.5483/bmbrep.2010.43.5.355. [DOI] [PubMed] [Google Scholar]
- 11.Ohno H, Shinoda K, Spiegelman BM, Kajimura S. PPARγ agonists induce a white-to-brown fat conversion through stabilization of PRDM16 protein. Cell Metab. 2012;15(3):395–404. doi: 10.1016/j.cmet.2012.01.019. [DOI] [PMC free article] [PubMed] [Google Scholar]
- 12.Laplante M, Sabatini DM. mTOR signaling in growth control and disease. Cell. 2012;149(2):274–293. doi: 10.1016/j.cell.2012.03.017. [DOI] [PMC free article] [PubMed] [Google Scholar]
- 13.Bentzinger CF, et al. Skeletal muscle-specific ablation of raptor, but not of rictor, causes metabolic changes and results in muscle dystrophy. Cell Metab. 2008;8(5):411–424. doi: 10.1016/j.cmet.2008.10.002. [DOI] [PubMed] [Google Scholar]
- 14.Polak P, et al. Adipose-specific knockout of raptor results in lean mice with enhanced mitochondrial respiration. Cell Metab. 2008;8(5):399–410. doi: 10.1016/j.cmet.2008.09.003. [DOI] [PubMed] [Google Scholar]
- 15.Johnson C, et al. Bioinformatic and experimental survey of 14-3-3-binding sites. Biochem J. 2010;427(1):69–78. doi: 10.1042/BJ20091834. [DOI] [PMC free article] [PubMed] [Google Scholar]
- 16.Gardino AK, Smerdon SJ, Yaffe MB. Structural determinants of 14-3-3 binding specificities and regulation of subcellular localization of 14-3-3-ligand complexes: A comparison of the X-ray crystal structures of all human 14-3-3 isoforms. Semin Cancer Biol. 2006;16(3):173–182. doi: 10.1016/j.semcancer.2006.03.007. [DOI] [PubMed] [Google Scholar]
- 17.Obenauer JC, Cantley LC, Yaffe MB. Scansite 2.0: Proteome-wide prediction of cell signaling interactions using short sequence motifs. Nucleic Acids Res. 2003;31(13):3635–3641. doi: 10.1093/nar/gkg584. [DOI] [PMC free article] [PubMed] [Google Scholar]
- 18.Gingras AC, Kennedy SG, O’Leary MA, Sonenberg N, Hay N. 4E-BP1, a repressor of mRNA translation, is phosphorylated and inactivated by the Akt(PKB) signaling pathway. Genes Dev. 1998;12(4):502–513. doi: 10.1101/gad.12.4.502. [DOI] [PMC free article] [PubMed] [Google Scholar]
- 19.Vander Haar E, Lee SI, Bandhakavi S, Griffin TJ, Kim DH. Insulin signalling to mTOR mediated by the Akt/PKB substrate PRAS40. Nat Cell Biol. 2007;9(3):316–323. doi: 10.1038/ncb1547. [DOI] [PubMed] [Google Scholar]
- 20.DeYoung MP, Horak P, Sofer A, Sgroi D, Ellisen LW. Hypoxia regulates TSC1/2-mTOR signaling and tumor suppression through REDD1-mediated 14-3-3 shuttling. Genes Dev. 2008;22(2):239–251. doi: 10.1101/gad.1617608. [DOI] [PMC free article] [PubMed] [Google Scholar]
- 21.Huang J, Manning BD. A complex interplay between Akt, TSC2 and the two mTOR complexes. Biochem Soc Trans. 2009;37(Pt 1):217–222. doi: 10.1042/BST0370217. [DOI] [PMC free article] [PubMed] [Google Scholar]
- 22.Wiza C, Nascimento EB, Ouwens DM. Role of PRAS40 in Akt and mTOR signaling in health and disease. Am J Physiol Endocrinol Metab. 2012;302(12):E1453–E1460. doi: 10.1152/ajpendo.00660.2011. [DOI] [PubMed] [Google Scholar]
- 23.Nelson MR, Leidal AM, Smibert CA. Drosophila Cup is an eIF4E-binding protein that functions in Smaug-mediated translational repression. EMBO J. 2004;23(1):150–159. doi: 10.1038/sj.emboj.7600026. [DOI] [PMC free article] [PubMed] [Google Scholar]
- 24.Jeske M, Meyer S, Temme C, Freudenreich D, Wahle E. Rapid ATP-dependent deadenylation of nanos mRNA in a cell-free system from Drosophila embryos. J Biol Chem. 2006;281(35):25124–25133. doi: 10.1074/jbc.M604802200. [DOI] [PubMed] [Google Scholar]
- 25.Zaessinger S, Busseau I, Simonelig M. Oskar allows nanos mRNA translation in Drosophila embryos by preventing its deadenylation by Smaug/CCR4. Development. 2006;133(22):4573–4583. doi: 10.1242/dev.02649. [DOI] [PubMed] [Google Scholar]
- 26.Rouget C, et al. Maternal mRNA deadenylation and decay by the piRNA pathway in the early Drosophila embryo. Nature. 2010;467(7319):1128–1132. doi: 10.1038/nature09465. [DOI] [PMC free article] [PubMed] [Google Scholar]
- 27.Pinder BD, Smibert CA. microRNA-independent recruitment of Argonaute 1 to nanos mRNA through the Smaug RNA-binding protein. EMBO Rep. 2013;14(1):80–86. doi: 10.1038/embor.2012.192. [DOI] [PMC free article] [PubMed] [Google Scholar]
- 28.Chen L, et al. Global regulation of mRNA translation and stability in the early Drosophila embryo by the Smaug RNA-binding protein. Genome Biol. 2014;15(1):R4. doi: 10.1186/gb-2014-15-1-r4. [DOI] [PMC free article] [PubMed] [Google Scholar]
- 29.Kong J, Lasko P. Translational control in cellular and developmental processes. Nat Rev Genet. 2012;13(6):383–394. doi: 10.1038/nrg3184. [DOI] [PubMed] [Google Scholar]
- 30.Thoreen CC, et al. A unifying model for mTORC1-mediated regulation of mRNA translation. Nature. 2012;485(7396):109–113. doi: 10.1038/nature11083. [DOI] [PMC free article] [PubMed] [Google Scholar]
Associated Data
This section collects any data citations, data availability statements, or supplementary materials included in this article.