Abstract
We examined whether prefrontal cortex (PFC) neuron activity reflects categorical decisions in monkeys categorizing ambiguous stimuli. A morphing system was used to systematically vary stimulus shape and precisely define category boundaries. Ambiguous stimuli were centered on a category boundary, i.e., they were a mix of 50% of two prototypes and therefore had no category information, so monkeys guessed at their category membership. We found that the monkey's trial-by-trial decision about the category membership of an ambiguous image was reflected in PFC activity. Activity to the same ambiguous image differed significantly depending on which category the monkey had assigned it to. This effect only occurred when that scheme was behaviorally relevant. These indicate that PFC activity reflects categorical decisions.
Keywords: prefrontal cortex, categorization, monkey, flexibility, goal directed, object vision
INTRODUCTION
Categorization is the process of detecting the commonalities that unite different experiences. This allows us to group items by their function rather than their exact appearance. While many, if not most, animals categorize to some degree, the primate brain is an especially prodigious categorizer. Primates learn categories more quickly than other species (Wright & Katz, 2007) as well as learn very high-level, abstract, multivariate categories like “haute cuisine” or “peace, love, and understanding.” Thus, when we encounter ambiguous situations our brains often guess about their category in an attempt to give them meaning. As a result, however, our brains can “over-categorize”, that is, they make a categorical decision when there is actually no category at all (e.g., faces in clouds, etc). We sought to exploit this in monkeys to determine whether neural activity in higher-level cortex reflects categorical decisions about visual stimuli. The reasoning was that if this neural activity truly reflected categorization rather than perception per se, neural activity to an ambiguous, category-neutral stimulus should reflect whatever category monkeys think the stimulus belongs to at a given moment.
To this end, we examined activity in the prefrontal cortex (PFC). The PFC is the brain area most central to higher-order cognition and implicated in neuropsychiatric disorders (for reviews, see Bonelli & Cummings, 2007; E. K. Miller & Cohen, 2001; Stuss & Knight, 2002). Further, it has been shown to have neural correlates of abstract visual categories (Cromer, Roy, & Miller, 2010; DeGutis & D'Esposito, 2007; Diester & Nieder, 2008; Freedman, Riesenhuber, Poggio, & Miller, 2001, 2002, 2003; Roy, Riesenhuber, Poggio, & Miller, 2010; Wyttenbach, May, & Hoy, 1996). Using a novel behavioral paradigm (Cromer et al., 2010; Freedman et al., 2001, 2002, 2003; Roy et al., 2010), we parameterized using a morphing system to blend between different “cat” and “dog” prototypes, which created images of varying physical similarity (Figure 1). This revealed a hallmark of perceptual categorization in both behavior and PFC neural activity: a sharp transition across a discrete category boundary such that stimuli from the same category are treated more similarly than stimuli directly across the boundary (Cromer et al., 2010; Freedman et al., 2001, 2002, 2003; E. K. Miller, Freedman, & Wallis, 2002; P. Miller, Brody, Romo, & Wang, 2003; Roy et al., 2010; Seger & Miller, 2010; Wyttenbach et al., 1996). A modification of this paradigm allowed us to test for categorical guesses. In the current study, we added morph images that were on the boundary between categories. That is, they were category ambiguous, belong to neither category. Because the category ambiguous morphs nonetheless looked like either category (and because we offered no feedback about category membership – see Methods), sometimes the monkeys guessed that a given ambiguous image belonged to one category and other times that it belonged to the other category. We found that the activity of category-selective PFC neurons reflected the monkey's current category guess. This suggests that PFC neurons are indeed involved in categorical decisions.
Figure 1.
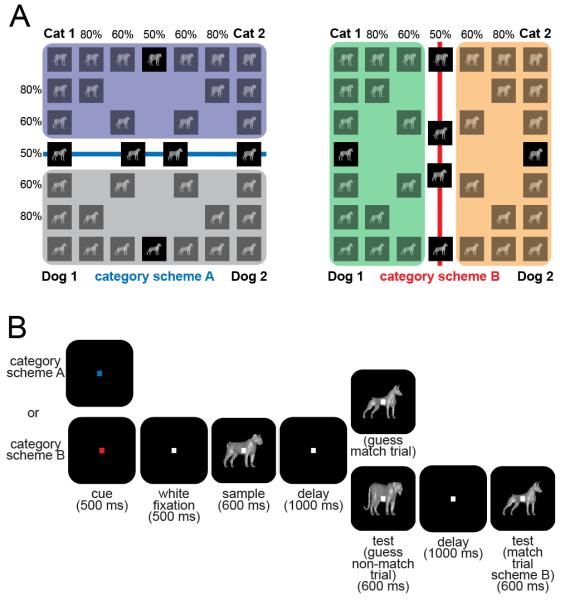
Stimuli and behavioral task. (A) Images were generated by morphing prototypes along six morph lines. Monkeys learned to categorize the same images under two different schemes. Some images were of equal proportion of two prototypes that is they were ambiguous and sat on the boundary lines. (B) Monkeys performed a delayed match-to-category task (see Methods). For the ambiguous stimuli, the category match/nonmatch was randomly assigned.
METHODS
Subjects
Two adult rhesus monkeys (Macacca mulatta) weighing 6.0 and 9.5 kg were used in this study. The animals were handled in accord with National Institutes of Health and the Massachusetts Institute of Technology Committee on Animal Care guidelines. Using previously described methods (Roy et al., 2010), they were implanted with recording hardware. Monitoring of eye movements was done using an infrared eye tracking system (Iscan, Inc., Woburn, MA) with a sampling rate of 240 Hz.
Stimuli and Behavioral Task
The three dimensional cat and dog images used in this study were the same as those in previous studies (Cromer et al., 2010; Freedman et al., 2001, 2002, 2003; Roy et al., 2010). A computerized three-dimensional morphing system (Shelton, 2000) generated parametric blends (morphs) of four prototypes (two cats and two dogs; Figure 1A). The morphs were linear combinations of varying percent compositions of the two constituent prototypes along corresponding points. The stimulus space was divided into two different category schemes where the boundary lines were orthogonal. Each boundary line divided the morph space into two categories (Figure 1A, scheme A in left panel and scheme B in right panel). Any image that contained more than a 50% contribution from a prototype of a one category was considered a member of that category. The monkeys viewed thousands of images generated from combinations of all four prototypes during training to ensure they learned to categorize the whole stimulus space. During the neural recording sessions, 34 images from seven levels of combinations between each pair of prototype (100:0, 80:20, 60:40, 50:50, 40:60, 20:80, 0:100) were used as the sample images. The full set of images and category designations for both schemes is shown in Figure 1A. For this study, we were most interested in the behavioral and neural responses to the eight images that were a 50% blend of the pairs of stimuli, making them ambiguous.
The monkeys were trained to perform a delayed-match-to-category task (Figure 1B). To start a trial, the monkey held a bar and acquired a fixation target for 1000 ms. For the first 500 ms, the color of the fixation dot indicated which category scheme (blue for scheme A and red for scheme B) would be in effect for the trial. The fixation dot turned to white for the remaining 500 ms. A sample image was presented for 600 ms. This manuscript will focus on the eight ambiguous images. A 1000 ms memory delay followed the sample presentation. After the memory delay, a test images was presented and if it matched the category of the sample images the monkey released the bar for a juice reward. If the test images did not match the sample image category, the monkey continued to hold the bar through a second 1000 ms delay that was followed by a category match image to which the monkey responded. The monkeys were rewarded randomly for the category membership guesses they made when presented with the ambiguous stimuli. Category scheme A/B and match/nonmatch trials were randomly interleaved and occurred at similar frequency. The monkeys were required to maintain fixation within a +/−2 degree window centered on the images at the center of the screen throughout the trial.
When a given category scheme was relevant, we included four category images that were at the mid-point (50%) along the morph lines that crossed the (currently relevant) category boundary (Figure 1A), i.e., they were on the category boundary. Thus, unlike the bulk of the images, the category assignment of these images was ambiguous. Also included were two intra-category images that were at the midpoint between the two prototypes that were members of the same category under the current category scheme (Figure 1A). Under the current category scheme, these latter images were fully within a category and thus their category assignment was unambiguous. But note that under the other scheme, they fell on the category boundary and would then be ambiguous. This allowed us to determine how monkeys (and their neurons) treat the same images when they were ambiguous vs. unambiguous.
Recording
On each monkey, recording chambers were stereotaxically placed using MRI images and an anatomical atlas (Paxinos, Huang, & Toga, 1999) over the PFC. The chamber allowed access to the principal sulcus and anterior arcuate sulcus (areas 45, 46, and 12). For each recording day, eight to sixteen epoxy-coated tungsten electrodes (FHC, Inc., Bowdoin, ME) were lowered into the brain using custom made screw-driven microdrives. Each microdrive was used to lower 2 electrodes through a plastic grid with 1 mm spacing (Cromer et al., 2010; Freedman et al., 2001, 2002, 2003; Roy et al., 2010). Activity was recorded from well isolated neurons without first prescreening for task related activity such as stimulus or category activity. On average 1–2 neurons were isolated per electrode. In all 536 lateral prefrontal cortex neurons were recorded over 78 sessions (333 from monkey O in 38 sessions and 203 from monkey L in 40 sessions). Reconstructed recording locations can be found on Figure 1C of Roy et al., 2010. All waveforms were digitized and then stored for off-line sorting into individual neurons using principal components analysis (Offline Sorter, Plexon, Inc., Dallas, TX).
Data Analysis
In order to determine if previous category membership decisions had an influence on the guessing activity of the monkeys, a one-back analysis was performed. The response of the previous unambiguous trial was counted only if the trial was of the same category scheme as the ambiguous trial. The ratio of responses to the constituent categories was calculated. The previous trials of the other category scheme were excludes as they did not have any bearing on the current category scheme.
Neuronal activity was averaged over three time epochs of a trial: sample presentation (100–600 ms after sample onset); the memory delay (300–1100 ms after sample offset), and the test image presentation (100 ms after the test image onset to 2 SD before each monkey's daily average reaction time to match trials). This epoch was chosen in order to reduce the influence of the behavioral response on the neural activity. Monkey O had a mean reaction time to match trials of 284 ms making the test epoch interval an average of 173 ms. Monkey L's mean reaction time to match trials was 350 ms with a test epoch interval of 232 ms.
For all analysis, the neural activity was normalized by first subtracting the minimum activity during the epoch of interest and then dividing by the difference of the maximum and minimum firing rates (Cromer et al., 2010; Freedman et al., 2001, 2002, 2003; Roy et al., 2010). Normalizing maximized the dynamic range of each neuron in each time epoch. Average firing rate traces were filtered using a least-squares smoothing filter (Savizky-Golay filter) with a weighting value of 51 ms. Standard statistical methods such as t-tests were used with the appropriate corrections for repeated measures.
The latency at which there was a significant difference in neural information was reached between the constituent categories of the preferred category for the neural population was calculated. This time point was defined as the point of maximum rise in the difference function around the time that the information difference reached significance (Buschman, Siegel, Roy, & Miller, 2011). The maximum rise statistic is more resilient to the number of neurons than using the first time point of significance as changing the number of neurons changes the threshold of significance but not necessarily the shape of the function or the point of maximum slope. Once the first point of significance was determined, the search for the maximum rise was restricted to a 50 ms window. To assess the uncertainty about the time to significance, a distribution of maximum rise times was generated by randomly resampling with replacement from the neural population (bootstrapped) and recalculating the maximum rise time 1000 times. From this distribution confidence intervals were determined.
In this experiment, the monkeys completed many more trials with unambiguous stimuli as compared to trials with ambiguous stimuli. Before the neural analysis of latency was initiated, the number of trials involving unambiguous stimuli was stratified (balanced) to match the number of trials with ambiguous stimuli. From the larger pool of unambiguous trials, the same number of trials as with ambiguous stimuli were randomly chosen and averaged. This process was repeated for the total number of ambiguous trials. For example if there were 15 ambiguous trials, 15 trials were randomly drawn from the unambiguous pool and averaged for a total of 25 times.
To assess the category selectivity strength of the neurons that remained selective during the ambiguous trials, a category index was generated as previously described (Cromer et al., 2010; Freedman et al., 2001, 2002, 2003; Roy et al., 2010). Briefly, for the unambiguous trials we calculated each neuron's difference in average activity in response to pairs of images along the morph lines that crossed the category boundary. The within-category difference (WCD) was calculated by taking the average absolute difference between the 100% and 80% morphs and the 80% and 60% morphs for both categories. The between-category difference (BCD) was calculated by averaging the across-boundary differences between the 60% of one category and 60% of the other category. The category index (range: −1 to 1) was the ratio of the difference of the WCD and BCD and their sum. A more positive category index means a larger difference in the responses to morphs between categories than within categories. The category index was calculated for the sample presentation and memory delay epochs separately.
RESULTS
Behavior
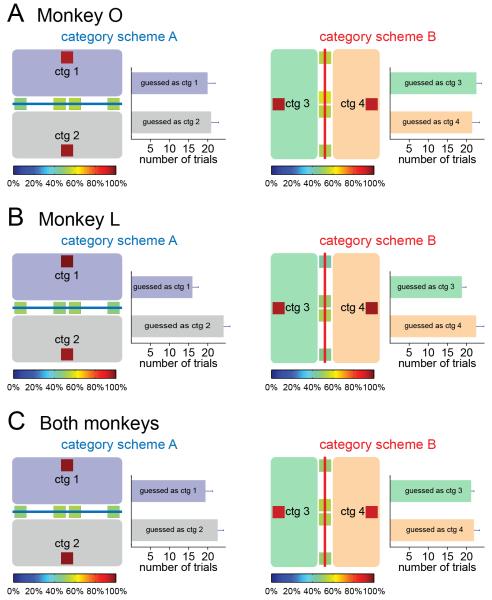
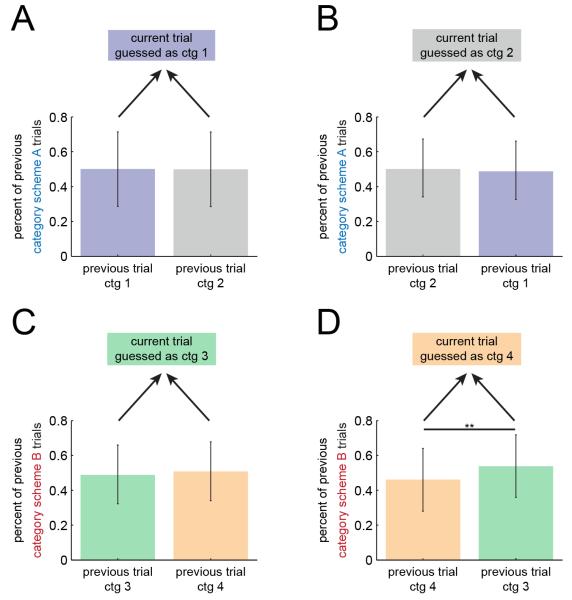
Our analysis focused on behavior and neural activity related to the category-ambiguous vs. category-unambiguous sample images seen at the start of the trial. The decision about the category of the category-ambiguous sample was reflected in the monkeys' comparison between it and the (clearly) category-unambiguous test image at the end of the trial (Figure 1B). Both monkeys correctly categorized all the unambiguous sample images at a high rate (>80%). Monkey O's overall performance was 87+/−19% (mean+/−SD) and monkey L's was 87+/−19%. This included the images that were at a midpoint between the same-category prototypes and thus were unambiguously within the same category under the current scheme. By contrast, under the other scheme, when the same midpoint images were on the category boundary (and thus ambiguous), the monkeys guessed at their category assignment. This is illustrated in Figure 2. For the midpoint unambiguous images (squares not on boundary), the color reflects the percentage of trials the monkeys' categorized the image correctly (as belonging to the category of which it was actually a member). These images were categorized nearly flawlessly (<90%). However when category scheme switched and the same midpoint images (along with two others) were on the boundary of the current category scheme and thus category ambiguous, the monkeys' performance was at chance. These are the images on the boundary in Figure 2. Their color reflects the percentage of trials the monkeys categorized the images as belonging to just one of the categories, arbitrarily chosen. As can be seen in the bar graph to the right of each figure, across all sessions the monkeys' divided their categorization of the ambiguous images between the two currently relevant categories (that is, they guessed). The monkeys' recent history of categorical decisions had little or no influence on the current guess for an ambiguous image (Figure 3). For three of the four categories, a guess that an ambiguous image belonged to that category was preceded by an equal number of trials with a (correct) decision for each category of that category scheme (mean +/− std; t-test, Figure 3A p=0.98, B p=0.63, C p=0.53). For the fourth category, guessing showed a slight (mean = 46+/−18% vs. 53+/−18%), but significant bias towards guessing an image as category 4 after a trial with an unambiguous category 3 (t-test, p=0.007). In short, monkeys did not simply base their category guesses for an ambiguous image on the categorical decisions of the immediately preceding trials (e.g., they did not guess “cat” because the last trial had a “cat”). Across all sessions, their guesses about ambiguous images seemed random. Our goal was to determine whether neural activity in the PFC reflected these guesses.
Figure 2.
Behavioral performance of both monkeys. Monkey O (A) and monkey L (B) categorized the ambiguous stimuli as members of the appropriate category when they were not on the boundary lines (darker squares) and guessed the membership with equal probability (50%) when they sat on the boundary lines (green squares). On average across all sessions, both monkeys guessed a similar number of trials in each category (horizontal plots, mean +/− SEM). (C) Combined behavioral performance of the two animals.
Figure 3.
Influence of previous trial. The subset of trials where the previous trial was of the same category scheme and the sample image was unambiguous were investigated for each category across all sessions (mean =/− std). For three of the categories (A, B, C), the previous trial behavioral decision did not impact the guessing. There was a slight, but significant, bias away from guessing category 4 when the previous trial was a category 3 image (D).
Effects of category decisions on neural activity
The category-related properties of this PFC neuron population have been previously described (Roy et al., 2010). Briefly, a neuron was deemed “category sensitive” if there was a significant difference in average firing rate to all the unambiguous images from one category vs. the other under either or both category schemes (t-test, p<0.05, Bonferroni corrected, during the sample presentation and/or the memory delay, see Methods and Roy et al., 2010). Many randomly-selected lateral PFC neurons (206/536) were category-sensitive. The neuron's “preferred category” was determined by which category elicited the greater average activity. Here, we focus on the comparison of neural activity to ambiguous vs. unambiguous sample images.
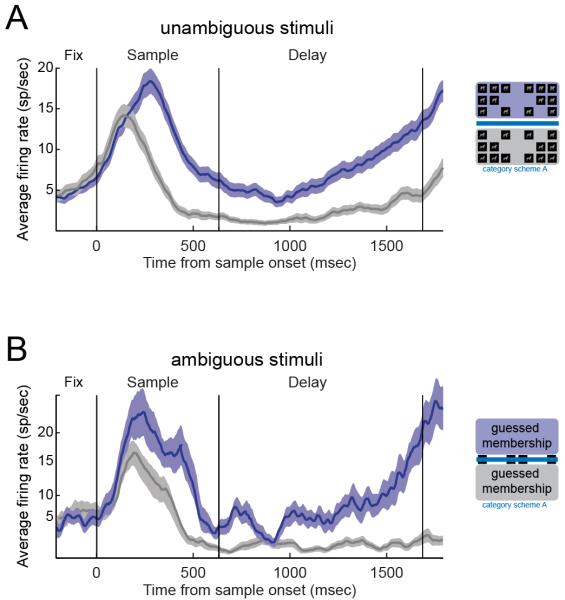
Figure 4A shows an example of a category-sensitive PFC neuron. When the monkey was performing one of the category schemes (scheme A), it showed greater average activity to all the unambiguous sample images from one category (the “preferred category”) than the other (“non-preferred”) category. It is during these intervals that the monkey has to categorize the sample image and hold that category decision in short-term memory. To determine if this activity truly reflected the monkey's trial-by-trial decision of the sample image's category, we examined the trials with ambiguous images. We sorted these trials by whether the monkey decided that the ambiguous image was the neuron's preferred vs. non-preferred category. We did so by using the monkey's decision about whether the sample matched the category of the clearly unambiguous test stimulus. Figure 4B shows the result. When we sorted this neuron's activity based on the monkey's trial-by-trial decision about the category membership of the ambiguous sample images, the neuron showed a significant increase in activity when the monkey guessed that the image was the preferred vs. non-preferred category, even though the images were exactly the same in both cases. Thus, the level of activity of this neuron reflects the monkey's decision about the sample's category membership.
Figure 4.
Category and guessing sensitivity of an example PFC neuron. (A) This neuron preferred category scheme A with its average activity (mean+/−SEM) in response to images of category 1 (purple line) was greater than its response for category 2 (gray line) in the sample presentation interval and throughout the memory delay. (B) The neuron showed the same category sensitivity for ambiguous stimuli, with an increased activity when the monkey guessed the image to be category 1 (purple line) as opposed to category 2 (gray line).
Of the 206 PFC neurons that showed category sensitivity to unambiguous stimuli, 68.4% or 141/206 was also significantly category sensitive to the ambiguous stimuli when we sorted trials by the monkey's decision, as above. As seen for unambiguous images (Roy et al., 2010), some PFC neurons showed this category decision effect for only one category scheme (n=38 for category scheme A and n=63 for category scheme B; t-test, p<0.05, Bonferroni corrected) and some for both schemes (n=40; t-test, p<0.05, Bonferroni corrected). The modal group of neurons (70 of 141 neurons or 50%) showed the guessing effect during the memory delay only, after the monkeys had seen the ambiguous sample image but before they had to register their guesses by responding to the category match/non-match status of the forthcoming (unambiguous) test stimulus. The remainder of neurons showed an effect of guessing during the sample presentation only (38 of 141 neurons or 27%) or during both the sample and delay intervals (23 of 141 neurons or 16.3%). Only a few neurons (10 of 141 neurons or 7.1%) showed significant category sensitivity to unambiguous images in one category scheme but a guessing effect under the other category scheme. Most of neurons (98 of 141 or 70%) that were sensitive to the guessed category of the ambiguous images showed the same category preference that they did to unambiguous images. The remainder of the analyses will focus on these neurons.
Categorization of ambiguous stimuli takes longer
We next compared the neural latency for category information about the ambiguous vs. unambiguous images. This time point was defined as the point of maximum rise (slope) in the difference of the responses to the preferred vs. non-preferred categories (see Methods). The search for the maximum rise time was confined to a 50 ms window around the first point that the difference reached significance. The population of neurons was bootstrapped and the maximum rise time was re-determined 1000 times to generate a population from which confidence intervals could be evaluated.
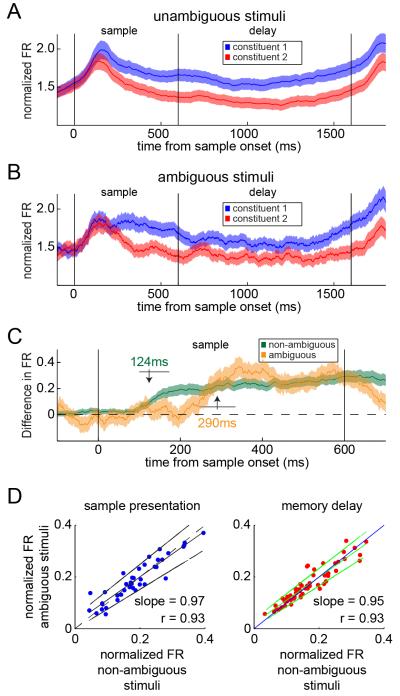
This analysis revealed that the category sensitivity during guessing (ambiguous image) trials appeared at a significantly longer latency than that to unambiguous images. Figure 5 shows the normalized average firing rate activity of the population of 98 PFC neurons (see above). Figure 5A shows their average population activity on trials with unambiguous images and Figure 5B shows the trials in which the monkeys guessed at the category of the ambiguous images. In both cases, average neural activity begins to distinguish between the two categories during presentation of the sample image. By necessity (see Methods), the number of trials with ambiguous stimuli (mean = 20.5+/−1.7 trials per category per day) was much fewer than that of unambiguous (163+/−5 trials per category per day). Therefore, to determine the neural latency of the category effect, we stratified the number of trials used in the analysis of unambiguous trials to match the number of ambiguous trials (see Methods).
Figure 5.
Latency of category sensitivity.The average (mean+/−SEM) neural response for the preferred category of PFC neurons that maintained the same preference during trials with unambiguous (A) and ambiguous (B) stimuli. (C) The maximum rise time was calculated in a 50 ms window centered on the first time point of significance in the difference in neural activity. It took significantly longer during the guessing trials than the unambiguous trials (124ms versus 290ms). (D) Comparison of normalized neural responses averaged over the sample presentation (left panel) and the memory delay (right panel) for unambiguous and ambiguous stimuli. The activity level of the population of PFC neurons were similar with both types of stimuli with slopes not different from unity. Note the number of trials in the unambiguous averages was stratified to match the lower number of ambiguous trials.
Figure 5C shows plots of the average difference in activity to the two categories for the stratified unambiguous trials vs. ambiguous trials. The latency in average PFC activity when categorizing unambiguous images was 124 ms (95th percentiles = 101, 171; Figure 5C green trace), compared to 291 ms when guessing at the category of the ambiguous image (95th percentiles = 240, 334; Figure 5C orange trace; t-test, p<0.05, Bonferroni corrected). A fairly trivial explanation for the latency difference would be that the PFC neurons were not as strongly activated by ambiguous vs. unambiguous images. Figure 5D shows that this was not the case, which shows the normalized mean firing rate to unambiguous and ambiguous stimuli. Both the subset of neurons that were category sensitive during sample presentation (Figure 5D, left panel) and the memory delay (Figure 5D, right panel) had almost identical activity levels to unambiguous vs. ambiguous images (slope = 0.97, not different from unity p = 0.50, r = 0.93 and slope = 0.95, not different from unity p = 0.79, r = 0.93, respectively).
It was possible that the PFC neurons that showed effects of category guesses were more category sensitive in general than those neurons that did not show a guessing effect. To determine this, we calculated a category index (see methods; Cromer et al., 2010; Freedman et al., 2001, 2002, 2003; Roy et al., 2010). Each neuron's difference in mean activity in response to pairs of images from the same category (WCD) and between categories (BCD) was determined. The index was the ratio of the difference between WCD and BCD and their sum. Neurons that showed stronger category sensitivity would have great positive index values. The category index for the 206 category sensitive neurons is shown in Figure 6A for both the sample presentation (left panel) and memory delay epochs (right panel). The category indices for PFC neurons with a guessing effect (n=98) are shown in Figure 6B. The spread of the index values was similar for both subsets of PFC neurons suggesting that PFC neurons that remained sensitive during ambiguous trials were not systematically more sensitive to categories.
Figure 6.
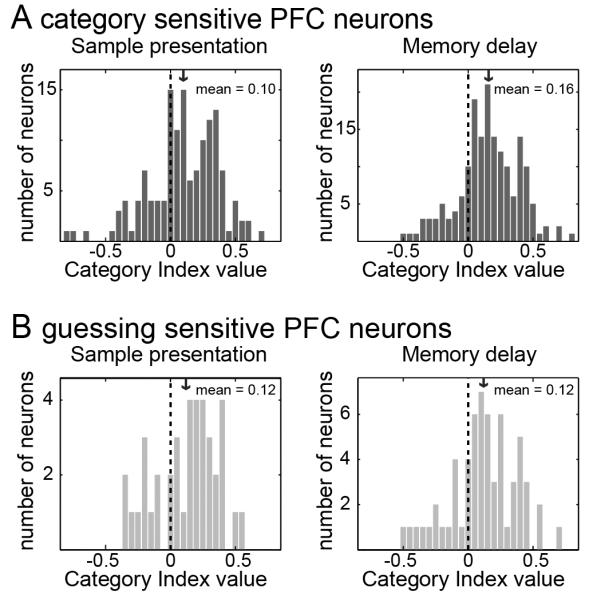
Category selectivity index values. (A) Index values of PFC neurons (n=206) that showed category sensitivity for one of the category schemes with unambiguous stimuli. (B) Index values for the sub-population of neurons (n=98) that maintained the same category sensitivity during trials with ambiguous stimuli.
DISCUSSION
We report that neural activity in the PFC reflected monkeys' categorical decisions about ambiguous category-neutral images that had no actual category information. Neural correlates of visual categories and category learning are well-established higher cortical areas including the PFC (Cromer et al., 2010; Freedman et al., 2001, 2002, 2003; E. K. Miller et al., 2002; Roy et al., 2010), posterior parietal (Fitzgerald, Swaminathan, & Freedman, 2012; Freedman & Assad, 2006, 2011; Swaminathan & Freedman, 2012) and inferior temporal cortices (De Baene, Ons, Wagemans, & Vogels, 2008; Freedman et al., 2003; Gross, 2008; Kriegeskorte et al., 2008; Sigala & Logothetis, 2002; Vogels, 1999). Those studies have shown that neurons, like behavior, sharply parse a continuous set of often very similar looking stimuli into learned categories. Here, we show that PFC neurons can also parse their activity to the exact same stimuli depending on which category the monkeys think the stimulus belongs to at one moment vs. another. This is similar to effects seen when monkeys guess at the motion category of moving dots that actually have no aggregate direction and thus no category (Shadlen & Newsome, 1996, 2001). In those studies, each category was linked to a unique motor response. Our study extends such results by demonstrating category effects in the absence of any possible effect of a motor response. In our experimental design, the motor response indicated a match to the sample category; different motor responses were not linked to different categories. This means that our category guessing effect reflected a purely top-down, cognitive decision independent of any specific motor response.
In fact, the PFC seems to even discard bottom-up information in favor of top-down (Cromer et al., 2010; Roy et al., 2010). The same PFC neurons can participate in representing different categories (i.e., they are category generalists) when there is little chance the categories will be confused because the categories look different (Cromer et al., 2010). By contrast, when the same stimuli are characterized two different ways, different PFC neurons specialize for each category (Roy et al., 2010). If the physical appearance of the stimuli alone (bottom-up information) were determining how information is distributed among PFC neurons, then we would expect the opposite pattern of results. There should be the most overlap in representation when the categories are competing (as in Roy et al., 2010) because the exact same images are being categorized. Thus, consistent with its position at the top of the cortical hierarchy, top-down information seems to dominate in the PFC. Indeed, the PFC seems to be a major source of top-down signals to other cortical areas. Frontal cortical neurons reflect shifts of top-down attention with a shorter latency than more posterior cortex (Buschman & Miller, 2007; Li, Gratton, Yao, & Knight, 2010) and their activity goes into rhythmic synchrony with visual cortex with a phase offset that suggests the former is driving the latter (Gregoriou, Gotts, Zhou, & Desimone, 2009). Microstimulation of PFC produces top-down attention-like modulation of visual cortex (Moore & Armstrong, 2003).
This is not meant to imply that the PFC is the one area that makes categorical decisions. There is no single “categorization area” or a single “decision area” in the brain. Categories are represented in a distributed fashion across the brain and there are multiple neural systems involved (Seger & Miller, 2010). Likewise, many areas contribute to decision making (Gold & Shadlen, 2007; Heekeren, Marrett, & Ungerleider, 2008). Which areas contribute to categorical decisions likely depends on the nature of the task at hand. For example, during motion-categorization, LIP neurons showed stronger category effects at an earlier latency than PFC neurons suggesting that LIP is strongly involved in the decision making (Swaminathan & Freedman, 2012). It remains to be seen if this result will hold during non-spatial tasks with complex images as stimuli or during more dynamic tasks (e.g. multiple category boundaries or changing decision criteria). Our results nonetheless indicate that PFC activity can reflect “pure” cognitive factors independent of bottom-up sensory inputs or motor output.
Acknowledgements
This work was supported by NIMH grant 2R01MH065252-06. We thank Marlene Wicherski for valuable comments, help, and discussions.
References
- De Baene W, Ons B, Wagemans J, Vogels R. Effects of category learning on the stimulus selectivity of macaque inferior temporal neurons. Learning & Memory (Cold Spring Harbor, N.Y.) 2008;15(9):717–727. doi: 10.1101/lm.1040508. [DOI] [PubMed] [Google Scholar]
- Bonelli RM, Cummings JL. Frontal-subcortical circuitry and behavior. Dialogues in Clinical Neuroscience. 2007;9(2):141–151. doi: 10.31887/DCNS.2007.9.2/rbonelli. [DOI] [PMC free article] [PubMed] [Google Scholar]
- Buschman TJ, Miller EK. Top-down versus bottom-up control of attention in the prefrontal and posterior parietal cortices. Science (New York, N.Y.) 2007;315(5820):1860–1862. doi: 10.1126/science.1138071. [DOI] [PubMed] [Google Scholar]
- Buschman TJ, Siegel M, Roy JE, Miller EK. Neural Substrates of Cognitive Capacity Limitations. Proceedings of the National Academy of Sciences. 2011;108(27):11252–11255. doi: 10.1073/pnas.1104666108. [DOI] [PMC free article] [PubMed] [Google Scholar]
- Cromer JA, Roy JE, Miller EK. Representation of Multiple, Independent Categories in the Primate Prefrontal Cortex. Neuron. 2010;66(5):796–807. doi: 10.1016/j.neuron.2010.05.005. [DOI] [PMC free article] [PubMed] [Google Scholar]
- DeGutis J, D'Esposito M. Distinct mechanisms in visual category learning. Cognitive, Affective & Behavioral Neuroscience. 2007;7(3):251–259. doi: 10.3758/cabn.7.3.251. [DOI] [PubMed] [Google Scholar]
- Diester I, Nieder A. Complementary contributions of prefrontal neuron classes in abstract numerical categorization. The Journal of Neuroscience: The Official Journal of the Society for Neuroscience. 2008;28(31):7737–7747. doi: 10.1523/JNEUROSCI.1347-08.2008. [DOI] [PMC free article] [PubMed] [Google Scholar]
- Fitzgerald JK, Swaminathan SK, Freedman DJ. Visual categorization and the parietal cortex. Frontiers in Integrative Neuroscience. 2012;6(18):1–6. doi: 10.3389/fnint.2012.00018. [DOI] [PMC free article] [PubMed] [Google Scholar]
- Freedman DJ, Assad JA. Experience-dependent representation of visual categories in parietal cortex. Nature. 2006;443(7107):85–88. doi: 10.1038/nature05078. [DOI] [PubMed] [Google Scholar]
- Freedman DJ, Assad JA. A proposed common neural mechanism for categorization and perceptual decisions. Nature Neuroscience. 2011;14(2):143–146. doi: 10.1038/nn.2740. [DOI] [PubMed] [Google Scholar]
- Freedman DJ, Riesenhuber M, Poggio TA, Miller EK. Categorical representation of visual stimuli in the primate prefrontal cortex. Science (New York, N.Y.) 2001;291(5502):312–316. doi: 10.1126/science.291.5502.312. [DOI] [PubMed] [Google Scholar]
- Freedman DJ, Riesenhuber M, Poggio T, Miller EK. Visual Categorization and the Primate Prefrontal Cortex: Neurophysiology and Behavior. Journal of Neurophysiology. 2002;88(2):929–941. doi: 10.1152/jn.2002.88.2.929. [DOI] [PubMed] [Google Scholar]
- Freedman DJ, Riesenhuber M, Poggio T, Miller EK. A comparison of primate prefrontal and inferior temporal cortices during visual categorization. The Journal of Neuroscience: The Official Journal of the Society for Neuroscience. 2003;23(12):5235–5246. doi: 10.1523/JNEUROSCI.23-12-05235.2003. [DOI] [PMC free article] [PubMed] [Google Scholar]
- Gold JI, Shadlen MN. The Neural Basis of Decision Making. Annual Review of Neuroscience. 2007;30(1):535–574. doi: 10.1146/annurev.neuro.29.051605.113038. [DOI] [PubMed] [Google Scholar]
- Gregoriou GG, Gotts SJ, Zhou H, Desimone R. Long-range neural coupling through synchronization with attention. In: Srinivasan Narayanan., editor. Progress in Brain Research. Volume 176. Elsevier; 2009. pp. 35–45. [DOI] [PubMed] [Google Scholar]
- Gross CG. Single neuron studies of inferior temporal cortex. Neuropsychologia. 2008;46(3):841–852. doi: 10.1016/j.neuropsychologia.2007.11.009. [DOI] [PubMed] [Google Scholar]
- Heekeren HR, Marrett S, Ungerleider LG. The neural systems that mediate human perceptual decision making. Nature Reviews Neuroscience. 2008;9(6):467–479. doi: 10.1038/nrn2374. [DOI] [PubMed] [Google Scholar]
- Kriegeskorte N, Mur M, Ruff DA, Kiani R, Bodurka J, Esteky H, Tanaka K, et al. Matching Categorical Object Representations in Inferior Temporal Cortex of Man and Monkey. Neuron. 2008;60(6):1126–1141. doi: 10.1016/j.neuron.2008.10.043. [DOI] [PMC free article] [PubMed] [Google Scholar]
- Li L, Gratton C, Yao D, Knight RT. Role of frontal and parietal cortices in the control of bottom-up and top-down attention in humans. Brain Research. 2010;1344:173–184. doi: 10.1016/j.brainres.2010.05.016. [DOI] [PMC free article] [PubMed] [Google Scholar]
- Miller EK, Cohen JD. An Integrative Theory of Prefrontal Cortex Function. Annual Review of Neuroscience. 2001;24(1):167–202. doi: 10.1146/annurev.neuro.24.1.167. [DOI] [PubMed] [Google Scholar]
- Miller EK, Freedman DJ, Wallis JD. The prefrontal cortex: categories, concepts and cognition. Philosophical Transactions of the Royal Society of London. Series B, Biological Sciences. 2002;357(1424):1123–1136. doi: 10.1098/rstb.2002.1099. [DOI] [PMC free article] [PubMed] [Google Scholar]
- Miller P, Brody CD, Romo R, Wang X-J. A recurrent network model of somatosensory parametric working memory in the prefrontal cortex. Cerebral Cortex (New York, N.Y.: 1991) 2003;13(11):1208–1218. doi: 10.1093/cercor/bhg101. [DOI] [PMC free article] [PubMed] [Google Scholar]
- Moore T, Armstrong KM. Selective gating of visual signals by microstimulation of frontal cortex. Nature. 2003;421(6921):370–373. doi: 10.1038/nature01341. [DOI] [PubMed] [Google Scholar]
- Paxinos G, Huang X-F, Toga AW. The Rhesus Monkey Brain in Stereotaxic Coordinates. 1st ed. Academic Press; 1999. [Google Scholar]
- Roy JE, Riesenhuber M, Poggio T, Miller EK. Prefrontal Cortex Activity During Flexible Categorization. The Journal of Neuroscience. 2010;30(25):8519–8528. doi: 10.1523/JNEUROSCI.4837-09.2010. [DOI] [PMC free article] [PubMed] [Google Scholar]
- Seger CA, Miller EK. Category Learning in the Brain. Annual Review of Neuroscience. 2010;33(1):203–219. doi: 10.1146/annurev.neuro.051508.135546. [DOI] [PMC free article] [PubMed] [Google Scholar]
- Shadlen MN, Newsome WT. Motion perception: seeing and deciding. Proceedings of the National Academy of Sciences. 1996;93(2):628–633. doi: 10.1073/pnas.93.2.628. [DOI] [PMC free article] [PubMed] [Google Scholar]
- Shadlen MN, Newsome WT. Neural Basis of a Perceptual Decision in the Parietal Cortex (Area LIP) of the Rhesus Monkey. Journal of Neurophysiology. 2001;86(4):1916–1936. doi: 10.1152/jn.2001.86.4.1916. [DOI] [PubMed] [Google Scholar]
- Shelton CR. Morphable Surface Models. International Journal of Computer Vision. 2000;38(1):75–91. [Google Scholar]
- Sigala N, Logothetis NK. Visual categorization shapes feature selectivity in the primate temporal cortex. Nature. 2002;415(6869):318–320. doi: 10.1038/415318a. [DOI] [PubMed] [Google Scholar]
- Stuss DT, Knight RT. Principles of Frontal Lobe Function. 1st ed. Oxford University Press; USA: 2002. [Google Scholar]
- Swaminathan SK, Freedman DJ. Preferential encoding of visual categories in parietal cortex compared with prefrontal cortex. Nature Neuroscience. 2012;15(2):315–320. doi: 10.1038/nn.3016. [DOI] [PMC free article] [PubMed] [Google Scholar]
- Vogels R. Categorization of complex visual images by rhesus monkeys. Part 2: single-cell study. European Journal of Neuroscience. 1999;11(4):1239–1255. doi: 10.1046/j.1460-9568.1999.00531.x. [DOI] [PubMed] [Google Scholar]
- Wright AA, Katz JS. Generalization hypothesis of abstract-concept learning: Learning strategies and related issues in Macaca mulatta, Cebus apella, and Columba livia. Journal of Comparative Psychology. 2007;121(4):387–397. doi: 10.1037/0735-7036.121.4.387. [DOI] [PubMed] [Google Scholar]
- Wyttenbach RA, May ML, Hoy RR. Categorical Perception of Sound Frequency by Crickets. Science. 1996;273(5281):1542–1544. doi: 10.1126/science.273.5281.1542. [DOI] [PubMed] [Google Scholar]


