

Abstract
Examination of associations between specific disorders and physical properties of functionally relevant frontal lobe sub‐regions is a fundamental goal in neuropsychiatry. Here, we present and evaluate automated methods of frontal lobe parcellation with the programs FreeSurfer(FS) and TOADS‐CRUISE(T‐C), based on the manual method described in Ranta et al. [2009]: Psychiatry Res 172:147‐154 in which sulcal‐gyral landmarks were used to manually delimit functionally relevant regions within the frontal lobe: i.e., primary motor cortex, anterior cingulate, deep white matter, premotor cortex regions (supplementary motor complex, frontal eye field, and lateral premotor cortex) and prefrontal cortex (PFC) regions (medial PFC, dorsolateral PFC, inferior PFC, lateral orbitofrontal cortex [OFC] and medial OFC). Dice's coefficient, a measure of overlap, and percent volume difference were used to measure the reliability between manual and automated delineations for each frontal lobe region. For FS, mean Dice's coefficient for all regions was 0.75 and percent volume difference was 21.2%. For T‐C the mean Dice's coefficient was 0.77 and the mean percent volume difference for all regions was 20.2%. These results, along with a high degree of agreement between the two automated methods (mean Dice's coefficient = 0.81, percent volume difference = 12.4%) and a proof‐of‐principle group difference analysis that highlights the consistency and sensitivity of the automated methods, indicate that the automated methods are valid techniques for parcellation of the frontal lobe into functionally relevant sub‐regions. Thus, the methodology has the potential to increase efficiency, statistical power and reproducibility for population analyses of neuropsychiatric disorders with hypothesized frontal lobe contributions. Hum Brain Mapp 35:2009–2026, 2014. © 2013 Wiley Periodicals, Inc.
Keywords: children, automation, cortex, prefrontal, premotor, segmentation
INTRODUCTION
The ability to examine associations between specific disorders and physical characteristics of functionally relevant frontal lobe sub‐regions is a fundamental goal in neuropsychiatry. The frontal lobe is the region of the brain associated with executive control and planning, including functions such as response inhibition, working memory and motivational aspects of behavior and high‐order motor control [Alvarez and Emory, 2006; Ashe et al., 2006; Graziano and Aflalo, 2007; Tekin and Cummings, 2002]. Due to this wide range of complex brain functions, abnormalities in frontal lobe structure and function have been hypothesized to contribute to many neuropsychiatric disorders, including obsessive‐compulsive disorder (OCD) [Tekin and Cummings, 2002], depression and bipolar disorder [Tekin and Cummings, 2002], schizophrenia [Shad et al., 2006; Suzuki et al., 2005; Yamasue et al., 2004], Down syndrome [Pinter et al., 2001; Porter et al., 2007], Rett syndrome [Carter et al., 2008], fragile X syndrome [Gothelf et al., 2008; Kates et al., 2002a], idiopathic autism [Acosta and Pearl, 2004; Courchesne et al., 2007], Tourette syndrome [Fredericksen et al., 2002; Marsh et al., 2007], and Attention‐Deficit/Hyperactivity disorder (ADHD) [Kelly et al., 2007; Mostofsky et al., 2002; Nigg and Casey, 2005; Shaw et al., 2006, 2007; Sowell et al., 2003]. In view of the size and functional heterogeneity of the frontal lobe [Fuster, 1997], it is likely that abnormalities in distinct functional regions are preferentially associated with a particular disorder or with a specific aspect of that disorder.
While gyral‐sulcal landmarks define cytoarchitectonically and functionally relevant discrete regions in many cortical areas (e.g., angular gyrus/area 39 of Brodmann/posterior inferior parietal lobule) [Bouret and Richmond, 2010; Geyer et al., 2000; Tekin and Cummings, 2002; Zilles, 1990; Zilles et al., 1997], the major frontal gyri traverse multiple cytoarchitectonic and functional regions [Fischl et al., 2008; Sanides, 1972]. Therefore, frontal gyral regions may not correspond to functional regions. Previous frontal lobe parcellation protocols have often used only the most prominent sulcal landmarks due to concerns about rater reliability and image resolution, preserving most of the major frontal gyri as frontal subdivisions and leading therefore to predominantly anatomical parcellation schemes [Buchanan et al., 1998; Convit et al., 2001; Crespo‐Facorro et al., 1999, 2000; Desikan et al., 2006; Destrieux et al., 2010; Heckemann et al., 2010; Howard et al., 2003; John et al., 2006; Wible et al., 1997]. For example, the approach proposed by Rademacher et al. [1992] and its subsequent revisions [e.g., Kennedy et al., 1998] defined 14 frontal lobe sub‐regions with boundaries defined by multiple sulci and landmark‐based planes extended through the brain volume (cut planes), using techniques similar to ours [Kates et al., 2002b]. However, the resulting parcellation units were predominantly gyri or portions of them with limited correspondence to functional regions [Kennedy et al., 1998; Rademacher et al., 1992]. Significantly, two of the Rademacher sub‐regions, corresponding to the superior and middle frontal gyri, included several Brodmann areas each, including regions from both prefrontal and premotor areas whose divergent functions are well established [Alvarez and Emory, 2006; Graziano and Aflalo, 2007; Tekin and Cummings, 2002].
In this protocol, frontal lobe sub‐regions were delineated on the bases of consistent sulcal/gyral landmarks chosen because of their relationships to functional boundaries indicated by cytoarchitectonic, electrophysiological, magnetic stimulation, and functional imaging findings [Geschwind, 1979; Geyer et al., 2000; Tekin and Cummings, 2002; Zilles, 1990]. To balance the competing priorities of validity and reliability, sulcal contours were used when appropriate for defining a functional area and cut planes were used where functional and sulcal divisions diverged or when the level of anatomical detail in MR images or degree of intersubject variability made the use of standard anatomical landmarks excessively difficult. The theoretical foundations for the divisions used in our protocol include the sometimes divergent relationships between gyral/sulcal landmarks and cytoarchitectonical and functional organization of the cortex [Fischl et al., 2008; Geyer et al., 2000; Ongur et al., 2003; Zilles, 1990; Zilles et al., 1997] and the increasing body of information on the functional relevance of discrete frontal sub‐regions for neuropsychiatric disorders. The premotor and prefrontal modules are divided into several anatomo‐physiologic sub‐regions based on the foundations of traditional and more recent anatomical and functional literature [Bouret and Richmond, 2010; Costafreda et al., 2006; Graziano and Aflalo, 2007; Howard et al., 2003; Lacerda et al., 2003; McGlinchey‐Berroth et al., 1995; Mostofsky et al., 2007; Ongur et al., 2003; Rushworth et al., 2007; Rypma, 2006; Tekin and Cummings, 2002; Tzourio‐Mazoyer et al., 2002].
In two prior studies [Kates et al., 2002b; Ranta et al., 2009], we presented a manual frontal lobe parcellation protocol that relies on sulcal‐gyral landmarks to delineate functionally distinct frontal sub‐regions: i.e., primary motor cortex, anterior cingulate, deep white matter, premotor cortex regions (supplementary motor complex [SMC], frontal eye field [FEF], and lateral premotor cortex [LPM]) and prefrontal cortex (PFC) regions (medial PFC, dorsolateral PFC [DLPFC], inferior PFC, lateral orbitofrontal cortex [OFC] and medial OFC) (see Figs. 1 and 2, Table 1). Instead of relying only on prominent gyri and sulci, this protocol utilizes both major and minor anatomical landmarks along with cut planes along the trajectories of sulci or at sulcal intersections and turning points in order to define more “functionally relevant” frontal lobe sub‐regions, by which we mean regions that approximate as closely as possible functionally distinct areas of the frontal lobe. In addition, the definition of deep white matter (DWM) allows for a distinction between short (gyral white matter) and long or projecting association fibers [Makris et al., 1999], increasing the relevance of regional measurements. These functional divisions allow for more detailed examinations of the pathophysiology of disorders in which behavioral deficits and previous findings predict selective frontal lobe involvement. In this article, we present the next stage in the development of this technique: automation of the frontal lobe parcellation protocol.
Figure 1.
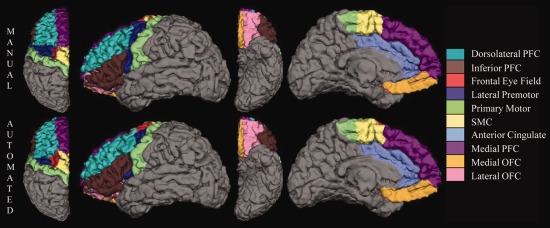
Manual (top row) and FreeSurfer automated (bottom row) parcellation of the left frontal lobe of an 8.2‐year‐old girl on dorsal, lateral, ventral, and medial surfaces. The deep white matter region is not visible on the surface of the brain.
Figure 2.
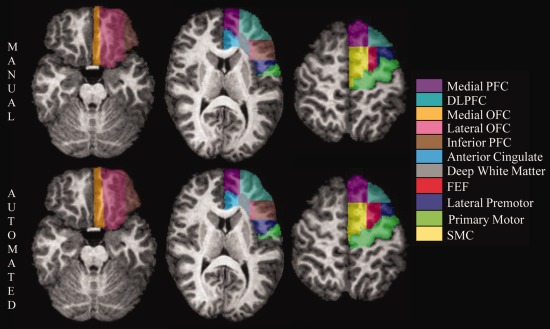
Manual (top row) and TOADS‐CRUISE automated (bottom row) parcellation of the left frontal lobe of a 10.7‐year‐old boy in a series of axial cross‐sections. Images from left to right move from more inferior to more superior positions in the brain.
Table 1.
Frontal lobe parcellation regions and abbreviations
| Primary Motor Cortex |
| Anterior Cingulate |
| Deep White Matter (DWM) |
| Supplementary Motor Complex (SMC) |
| Frontal Eye Field (FEF) |
| Lateral Premotor Cortex (LPM) |
| Medial Prefrontal Cortex (Medial PFC) |
| Dorsolateral Prefrontal Cortex (DLPFC) |
| Inferior Prefrontal Cortex (Inferior PFC) |
| Lateral Orbitofrontal Cortex (Lateral OFC) |
| Medial Orbitofrontal Cortex (Medial OFC) |
The use of automated parcellation of MR (magnetic resonance) brain scans is of growing interest in neuropsychiatry. Important contributions to the study of neuropsychiatric disorders have been made with MR automated parcellation studies since their introduction, notably in Alzheimer disease [Desikan et al., 2009, 2010; Oliveira et al., 2010; Scheinin et al., 2009; Westman et al., 2011], schizophrenia [Kikinis et al., 2010; Kuperberg et al., 2003; Nesvag et al., 2008; Voets et al., 2008], depression [Bergouignan et al., 2009; Dotson et al., 2009; Nifosi et al., 2010], Parkinson disease [Tinaz et al., 2010], ADHD [Almeida et al., 2010; Wolosin et al., 2007], autism [Ecker et al., 2010; Hadjikhani et al., 2006], and bipolar disorder [Nery et al., 2009]. Continuing debate on the best methods for evaluating the relative reliability, sensitivity, and validity of manual versus automated parcellations exists. However, in papers that have addressed the question it is generally agreed that automated methods provide important gains in efficiency, consistency, statistical power, and reproducibility compared to manual parcellation, which is inherently time‐consuming and subject to rater error [Barnes et al., 2007; Cherbuin et al., 2009; Dewey et al., 2010; Fischl et al., 2002; Hasboun et al., 1996; Lehmann et al., 2010; Morey et al., 2009; Pardoe et al., 2009; Tae et al., 2008].
In pursuance of the goal of examining the roles of functionally relevant frontal lobe regions in a variety of neuropsychological disorders, we have incorporated the Ranta et al. [2009] parcellation scheme into two automated programs: FreeSurfer (FS) [Fischl et al., 1999, 2004] and TOADS‐CRUISE (T‐C) (Topology‐preserving, Anatomy‐Driven Segmentation‐Cortical Reconstruction Using Implicit Surface Evolution) [Bazin and Pham, 2008; Han et al., 2004; Wan et al., 2008]. We selected two programs in order to allow a more powerful examination of validity and reliability of the automated methods.
MATERIALS AND METHODS
Participants
The subject group consisted of 113 children for whom the manual Ranta et al. [2009] frontal lobe parcellation method was applied to MR brain scans. The group was comprised of 48 typically developing (TD) children (23 girls), 24 children with autism spectrum disorder (ASD) (all boys) and 41 children with Attention‐Deficit Hyperactivity Disorder (ADHD) (20 girls). The subjects were 8.10 to 13.34 years old with a mean age of 10.30 years (±1.39).
Participants were recruited from outpatient clinics at the Kennedy Krieger Institute and from local pediatricians, local chapters of Children and Adults with Attention‐Deficit/Hyperactivity Disorder and the Autism Society of America, schools, social/service organizations and advertisements in the community. Written assent was obtained from all subjects and their parent/guardian under approval of the Johns Hopkins Institutional Review Board.
Children in the study had a full scale IQ (FSIQ) of 80 or higher based on performance on the Wechsler Intelligence Scale for Children (WISC)– 3rd edition [Wechsler, 1991] (n = 15) or the WISC– 4th edition [Wechsler, 2003] (n = 98). For three subjects, although FSIQ was below 80, significant discrepancies between IQ sub‐indices existed and one or both of the Perceptual Reasoning Index (PRI) and Verbal Comprehension Index (VCI) scores was above 85. None of the children had a history of speech/language disorder or a reading disability, and all had a basic reading standard score of 84 (14th percentile) or higher on the word reading subtest from the Wechsler Individual Achievement Test, First Edition (WIAT) [Wechsler, 1992] (n = 15) or Second Edition (WIAT–II) [Wechsler, 2002] (n = 98). TD children were excluded from the group if they had a history of neurological, developmental, or psychiatric disorders based on responses from the Diagnostic Interview for Children and Adolescents‐ 4th edition (DICA‐IV) with the exception of simple phobia, which was allowed (n = 4) [Reich et al., 1997].
The DICA‐IV structured parent interview, and ADHD‐specific and broad behavior rating scales (Conners' Parent and Teacher Rating Scales‐Revised CPRS‐R, CTRS‐R, long form) [Conners, 1997] were used to confirm ADHD diagnosis. TD children with T‐scores greater than 60 on the ADHD (Diagnostic and Statistical Manual of Mental Disorders (DSM)‐IV Inattention, DSM‐IV Hyperactivity) subscales of CPRS‐R were excluded from the study. The CPRS‐R and DSM IV criteria were used to evaluate ADHD subtype. Of the 41 ADHD subjects in the study, 16 were Predominantly Inattentive, 1 was Predominantly Hyperactive‐Impulsive and 24 were combined subtype. ADHD subjects with co‐morbid conduct disorder, mood disorder, generalized anxiety disorder, separation anxiety disorder, or obsessive–compulsive disorder were excluded from the study. ADHD children with Oppositional Defiant Disorder (ODD) and/or simple phobia were included; ODD was present in 12 of the ADHD subjects and simple phobia was present in eight, including three subjects with both.
Twenty‐two children with ADHD, 12 girls and 10 boys, were being prescribed stimulant medications at the time of the study (there was no significant difference by gender in medications prescribed at the time of study: Χ 2 = 4.698, P = 0.583). Stimulant medications were discontinued the day before and day of study participation. Children with ADHD were excluded from the study if they were taking long‐acting psychoactive medications. One boy with ADHD had an unknown drug history.
Children with ASD met criteria based on the DSM, subsequently confirmed using both the Autism Diagnostic Observation Schedule‐Generic (ADOS‐G) [Lord et al., 2000] and the Autism Diagnostic Interview‐Revised (ADI‐R) [Lord et al., 1994]. The ADOS‐G, ADI‐R, and DICA‐IV, along with the clinical judgment of the examiners, the Principal Investigator, and a neuropsychologist, were all factors in determining final diagnosis. Ten subjects in the study group were diagnosed with high functioning autism (HFA) and 14 with Asperger's syndrome, as distinguished by the presence of delayed language development in HFA. Children with identifiable causes of ASD (e.g., fragile X syndrome) and known neurological disorders, including epilepsy, were excluded [Welner et al., 1987]. On the DICA‐IV examination, eight ASD subjects met criteria for one or more co‐morbidities: ADHD (n = 6), ODD (n = 5), simple or social phobia (n = 5), Obsessive Compulsive Disorder (n = 2) or Generalized Anxiety Disorder (n = 2) and past depression (n = 1). Four ASD subjects did not have a DICA examination on record.
Seven boys with ASD were being prescribed psychoactive medicines at the time of the study: two were taking stimulants, one was taking a selective serotonin reuptake inhibitor (SSRI), one was taking atomoxetine, one was taking a stimulant and an SSRI, one was taking a stimulant and buspirone, and one was taking buproprion and a neuroleptic. Two subjects with ASD had unknown drug histories. Stimulant medications were discontinued the day before and day of study participation.
MRI Image Acquisition and Preprocessing
T1‐weighted 3D‐volume MPRAGE images of the brain (matrix size = 256 × 256, echo time = 3 ms, repetition time = 7 ms, field of view = 260 mm, slice thickness = 1.2 mm, flip angle = 8 degrees) were acquired using a 1.5T Philips Gyroscan NT (Royal Philips Electronics, Amsterdam, The Netherlands) for each subject in the study.
For each subject, manual parcellation of the frontal lobe was completed using the MIPAV (Medical Image Processing, Analysis and Visualization) software package [McAuliffe et al., 2001] from the Center for Imaging Technology (CIT) of the National Institutes of Health (NIH, Bethesda, MD, USA) and the previously published manual parcellation protocol [Ranta et al., 2009]. As reported in Ranta et al. [2009], inter‐ and intra‐rater reliability results for the manual protocol were calculated using intraclass correlation coefficients (ICC). Raters were blind to diagnosis and left and right hemisphere regions were evaluated independently. Intra‐rater ICC for the 22 frontal sub‐regions ranged from 0.778 to 0.997 with a mean of 0.952; inter‐rater ICC for the 22 frontal sub‐regions ranged from 0.724 to 0.997 with a mean of 0.919. Full manual parcellation protocol results are presented in Ranta et al. [2009].
The fully automated standard FS processing stream was implemented for each subject using version 4.0.4 on a Linux platform (http://surfxer.nmr.mgh.harvard.edu/). FS uses a fully automated method to perform preprocessing steps including Talairach alignment, intensity normalization, removal of skull and non‐brain tissue with a hybrid watershed/surface deformation procedure, separation of the cerebellum and brainstem from the cerebrum and splitting of the left and right hemispheres [Dale et al., 1999; Fischl et al., 2001; Segonne et al., 2004, 2005]. A deformable surface algorithm was used to define inner (gray‐white) and outer or pial (gray‐CSF) cortical surfaces [Dale et al., 1999; Fischl and Dale, 2000]. Automated topological correction, surface inflation and registration to a spherical atlas were also included in the processing stream [Dale et al., 1999; Fischl et al., 1999]. Total cerebral volume (TCV) for each subject was estimated using the FS pial surface.
For our FS automation technique, we primarily used the surface‐based cortical techniques available in FS. A method for defining white matter regions associated with each defined cortical gray matter region exists, however the volume‐based regions thus defined were not analogous to our manual definitions. Therefore, FS protocol automation and manual to automated comparisons within FS were carried out on cortical surface parcellations and cortical volumes and did not include the DWM region. Manual parcellations were sampled to the FS surfaces for all comparisons.
T‐C processing was completed using the May 2010 release. The manual skull stripping performed for use in the manual parcellation was used for T‐C processing. White and gray matter segmentations were performed using TOADS [Bazin and Pham, 2008], a topology preserving classification method that utilizes homeomorphic growing and thinning to transform a topology template to align with the structures in the target image. The surface reconstruction was performed using CRUISE [Han et al., 2004], which uses fuzzy tissue classification and a topology preserving geometric deformable surface model to estimate the inner, central and outer surfaces of the cortex.
T‐C has cortical surface definition and measurement capabilities, but is able to accommodate volume‐based regional definitions as well. Protocol automation and manual to automated comparisons within T‐C were carried out on volume‐based (combining cortical and sub‐cortical) regions and volumes like those originally delineated using the manual protocol.
Automation Methods
Manual parcellation masks from 13 mixed‐gender, TD subjects were used as atlases to produce automated parcellations for an additional 100 subjects in FS and in T‐C. Details of atlas selection and application are described below.
For implementation in FS, the volume‐based manual parcellation masks were mapped to the FS cortical pial surfaces. Small discrepancies resulted from differences in skull stripping, leaving a small percentage of the overall parcellation areas unlabeled, however the resulting unlabelled area was a very small fraction of the overall area. In addition, regions that were connected when volume‐based were not always connected as surface labels, as when the deeper part of a sulcal fold fell to the inside of a plane cut made through the volume while the parts of the sulcus closer to the surface of the brain remained outside the cut plane. When these labels are displayed on a flattened cortical surface the result is a donut shape with the deeper label in the center and the shallower label surrounding it. However, the FS parcellation method used the information provided by multiple atlas subjects, averaging to produce automated labels that were continuous and complete on the cortical surface of each brain.
In the FS automation, a cortical surface parcellation atlas was developed using probabilistic information estimated from a training set consisting of multiple manual parcellations, a technique described in Fischl et al. [2004]. Labels were automatically assigned to the cortical surface of individual target subjects using the atlas developed from the manual training set and geometric information derived from subject‐specific cortical geometry [Fischl et al., 2004]. A sample subject's manual parcellation (mapped onto the cortical surface) and FS automated parcellation are shown in Figure 1.
For implementation in T‐C, the automated parcellation was performed using an adaptation of the multiatlas cortical surface labeling method provided in the T‐C Brain Segmentation Tools software package (http://www.nitrc.org/projects/toads-cruise/). The automated method begins by registering each “atlas” brain to the unparcellated target brain via nonlinear registration. The algorithm used for the registration was a vectorized adaptation [Chen et al., 2010] of the adaptive bases algorithm (ABA) presented in Rohde et al. [2003], which models a deformation field that maps each atlas image to the target image using a summation of radial basis functions. The registration algorithm was validated by replicating the evaluation process performed by Klein et al. [2009] using two of that analysis' data sets (LPA40 and ISBR18), with ABA showing target overlap results at or above the average of the fifteen algorithms that were originally tested (full results of the evaluation are presented in Supporting Information). Image mappings were applied to the manual parcellation of each atlas resulting in an approximation of a parcellation for the target image based on each of the atlas brains.
These approximations were then combined using a probabilistic label fusion technique presented in Warfield et al. [2004], which produced a prediction of the correct parcellation by evaluating the reliability of each atlas relative to all the other atlases using a calculated probability term. The method was an iterative algorithm that initially assumed all atlases were equally reliable. Then, at each step, it combined all the atlas approximations into one parcellation using the reliability measure for each atlas. This combined parcellation was then used to recalculate the reliability of each atlas. The process was repeated until convergence was achieved, at which point the combined parcellation represented a better prediction of the correct parcellation than any individual atlas approximation. A final automated step was applied to remove small topological inaccuracies and straighten the boundaries between several labels by fitting vertical and horizontal planes to the results in order to better match the plane cuts used in the manual protocol to define several of its boundaries. A sample subject's manual parcellation and T‐C automated parcellation are shown in Figure 2.
Atlas Size Determination
To determine the optimal number of manually parcellated subjects to be used in our atlas group we carried out automated labeling on a test group of 30 mixed‐gender, mixed‐diagnosis subjects using an atlas group ranging from 1 to 15 subjects. The atlas groups were composed of TD children and each was divided as evenly as possible between girls and boys and included a range of ages and cerebral volumes representative of the full subject group; except for verifying that these group requirements were met, atlas subjects were randomly selected. The test group consisted of 12 TD (6 girls), 12 ADHD (6 girls), and 6 ASD (all boys) subjects, randomly selected from each diagnosis‐gender group.
Considering that spatial regional overlap, rather than agreement in regional volumes is a more suitable measure of reliability in the present study, we used the Dice's coefficient (D), an estimate of overlap, to evaluate the reliability of the automated labeling for each size atlas group. Dice's coefficient is calculated as:
where A is the manual parcellation and B is the automated parcellation [Dice, 1945]. Perfect overlap produces a Dice's coefficient equal to 1, while lesser degrees of overlap produce a Dice's coefficient greater than 0 but less than 1. There is no standard level that is deemed acceptable for Dice's coefficients, as values are dependent on size and structure type; e.g., a skull stripping protocol would generally require a higher Dice's coefficient to be considered reliable than would a lesion identification protocol. However, the Dice's coefficient is statistically very similar to Kappa statistics [Zijdenbos et al., 1994], for which guidelines have been proposed [Fleiss, 1971; Landis and Koch, 1977]. Landis and Koch [1977] described agreement for Kappa statistics less than 0.2 as slight, 0.21–0.4 as fair, 0.41–0.6 as moderate, 0.61–0.8 as substantial, and 0.81–1 as almost perfect while Fleiss characterized Kappa statistics below 0.4 as poor, 0.4 to 0.75 as fair or good, and over 0.75 as excellent. For FS, where our automation technique was primarily surface based, the overlap comparison was carried out on surface vertices. For T‐C, the comparison included all parcellation voxels, both cortical and subcortical.
Plots of the mean Dice's coefficients for manual versus automated parcellations for each size atlas group are shown in Figure 3. For both FS and T‐C there was an increase in the accuracy of automated labeling, as measured by average Dice's coefficient, up to an atlas size of 13.
Figure 3.
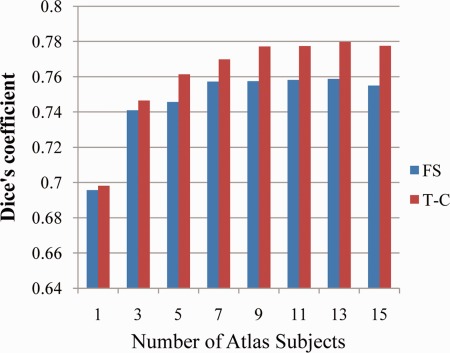
Mean manual versus automated Dice's coefficients averaged over 30 test subjects and all frontal lobe regions for atlas groups composed of 1 through 15 typically developing subjects. [Color figure can be viewed in the online issue, which is available at http://wileyonlinelibrary.com.]
To carry out further analysis, the 13 subject, mixed‐gender TD atlas group was used to produce automated parcellations in FS and in T‐C for 100 subjects. The atlas and analysis groups were matched on gender, age, FSIQ, PRI, handedness and Hollingshead Socioeconomic Status (SES). The groups differed on diagnosis (X 2 = 19.893, P < 0.001) and total cerebral volume (TCV) (F = 4.052, P = 0.047), with the atlas group having no ADHD or ASD subjects and larger TCV than the analysis group. The group difference in TCV is in part due to the differing number of ADHD subjects, who have previously been shown to have lower TCV by 6–7% in this age range [Ranta et al., 2009; Wolosin et al., 2007]. Comparison of TD subjects alone in the atlas and analysis group showed no significant difference in TCV. Information on group composition and demographic characteristics of the 13 subject atlas group and the 100 subject analysis group are shown in Table 2.
Table 2.
Atlas and analysis group characteristics
| Atlas group | Analysis group | |
|---|---|---|
| N | 13 | 100 |
| Diagnosisa,b | 100% TD | 35% TD, 41% ADHD, 24% ASD |
| Gender | 54% male, 46% female | 64% male, 37% female |
| Age (years) | 10.37 (1.09) | 10.29 (1.43) |
| FSIQc | 116.2 (13.5) | 110.9 (14.5) |
| PRId | 114.2 (16.1) | 110.5 (14.1) |
| TCV(mm3)b,e | 1,084,394 (92,504) | 1,031,374 (88,948) |
| Handedness | 100% right | 90% right, 9% left, 1% mixed |
| SESf | 57.7 (6.8) | 53.2 (8.6) |
Diagnosis: X 2 = 19.893, P < 0.001.
Significant difference between atlas and analysis groups.
FSIQ, full scale IQ.
PRI, perceptual reasoning index.
TCV, total cerebral volume: F = 4.052, P = 0.047.
SES, Hollingshead socioeconomic status; seven analysis group subjects did not have SES.
Atlas Gender and Diagnosis Composition Determination
Our initial assumption in carrying out the atlas size testing was that an appropriately sized atlas group composed of mixed‐gender TD subjects would provide enough anatomic variability for successful parcellation of subjects of both genders and all diagnoses. To test this assumption, we wanted to see if the automated labeling of any diagnosis(DX)‐gender group was significantly better or worse (as measured by manual versus automated Dice's coefficients) than that for any other DX‐gender group. The way we tested this was to conduct a multivariate analysis of variance (MANOVA) comparison to look for interactions between manual versus automated Dice's coefficients for each frontal lobe region and DX‐gender group. Breaking down the 100 subject analysis group, the individual DX‐gender groups consisted of 17 TD girls, 18 TD boys, 20 ADHD girls, 21 ADHD boys, and 24 ASD boys.
As a further test of gender and diagnosis neutrality we wanted to see whether a specific DX‐gender group, for example, girls with ADHD, would have more accurate automated labels if the atlases used for labeling came from other girls with ADHD. The way we tested this was to use five single gender, single diagnosis atlas groups of 13 subjects each to produce automated parcellations for the remaining subjects of the same diagnosis and gender. The test subjects were 10 TD girls, 7 ADHD girls, 12 TD boys, 8 ADHD boys, and 11 ASD boys.
Statistical Analysis
Statistical analyses were conducted using the SPSS 18.0 statistical analysis package (SPSS, Inc., Chicago, IL, USA) and Microsoft Excel 2007 (The Microsoft Corporation, Redmond, WA, USA). A value of P < 0.05 was considered statistically significant while a value of P < 0.1 was considered to be significant at trend level.
Dice's coefficient (see “Atlas Size Determination” Section for definition), was used to evaluate overlap between labels. As previously described, for FS, the Dice's coefficient calculation was carried out on surface vertices while for T‐C the calculation included all voxels. In general, Dice's coefficients for a three dimensional volume label and a two dimensional surface label of the same region can be significantly different (either higher or lower) depending on the shape of the label within the volume. In an idealized case, in which the surface is flat and the volume's contours do not change along the direction perpendicular to the surface, Dice's coefficients for surfaces and volumes will be identical. The cortical surface is not flat, but many of the frontal lobe volume labels defined here have fairly straight boundaries that are approximately perpendicular to the cortical surface. For regions which are significantly large compared to sulcal variations, the depth of the volume labels will have minimal effect on their final Dice's coefficient. This allows the volumetric and surface Dice's coefficients from our results to be evaluated similarly, although a direct comparison of the two methods based on Dice's coefficients alone should be avoided.
Although we consider Dice's coefficients to be the best measure of reliability for method validation purposes, many neuroanatomical studies are only interested in quantifying volumetric changes or overall group differences. Thus, percent volume difference is also a useful metric for evaluating our automated parcellations. Percent volume difference is defined as:
where V(M) is the volume of the manual parcellation and V(A) is the volume of the automated parcellation.
Pitman's t‐test was used to examine differences in within population variance between V(M) and V(A). Diagnosis groups were combined for evaluation; each frontal sub‐region was tested individually. Pitman's t is defined as:
where variance is the square of the standard deviation, F is the ratio of the larger variance to the smaller variance, and r is the correlation value between V(M) and V(A) [Pitman, 1939]. A P‐value was calculated by evaluating t on n‐2 degrees of freedom.
RESULTS
Comparing Manual and Automated Parcellations
Overlap
For FS, averaging over the 100 subjects analyzed and all frontal lobe regions revealed a mean manual to automated Dice's coefficient of 0.754, with an average of 0.750 in the left hemisphere and 0.759 in the right hemisphere (see Fig. 4). Dice's coefficients for the individual sub‐regions ranged from 0.674 to 0.829 except for the left and right FEF, which were 0.541 and 0.561, respectively. Excluding the FEF, nine regions had a mean Dice's coefficient greater than 0.80, five were greater than 0.75, two were greater than 0.70, and the remaining two were greater than 0.67.
Figure 4.
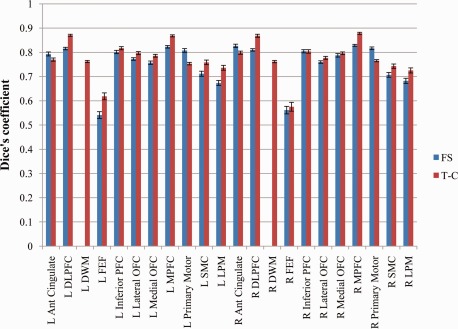
Mean manual versus automated Dice's coefficients for each frontal lobe region averaged over 100 analyzed subjects for FS and T‐C automated parcellations with standard error bars. [Color figure can be viewed in the online issue, which is available at http://wileyonlinelibrary.com.]
For T‐C, averaging over the 100 subjects analyzed and all frontal lobe regions revealed a mean Dice's coefficient of 0.774, with an average of 0.776 in the left hemisphere and 0.772 in the right hemisphere (see Fig. 4). Dice's coefficients for the individual sub‐regions ranged from 0.725 to 0.878, except for the left and right FEF, which were 0.618 and 0.575, respectively. Excluding the FEF, 6 regions had a mean Dice's coefficient greater than 0.8, 11 were greater than 0.75 and the remaining 3 were greater than 0.72.
Volume difference
For FS, averaging over the 100 subjects analyzed and all frontal lobe regions revealed a mean percent volume difference of 21.2% between V(M) and V(A) (see Fig. 5). Results for the individual frontal lobe sub‐regions ranged from 12.2% to 28.9% except for the left and right FEF, which were 44.9% and 45.8%, respectively. The mean for the left hemisphere was 21.8%; for the right hemisphere it was 20.6%. Excluding the FEF, 7 regions had a mean percent volume difference less than 15%, 4 were less than 20%, 5 were less than 25% and the remaining 2 were less than 29%.
Figure 5.
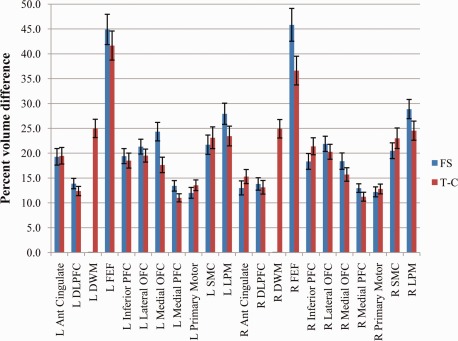
Mean manual versus automated percent volume difference for each frontal lobe region averaged over 100 analyzed subjects for FS and T‐C automated parcellations with standard error bars. [Color figure can be viewed in the online issue, which is available at http://wileyonlinelibrary.com.]
For T‐C, averaging over the 100 subjects analyzed and all frontal lobe regions revealed a mean percent volume difference of 20.2% (see Fig. 5). Results for the individual frontal lobe sub‐regions ranged from 11.0% to 25.0% except for the left and right FEF, which were 41.7% and 36.6%, respectively. The mean for the left hemisphere was 20.6%; for the right hemisphere it was 19.4%. Excluding the FEF, 6 regions had a mean percent volume difference less than 15%, 6 were less than 20%, and the remaining 8 were less than 25%.
Variance
In analyzing differences in within population variance between V(M) and V(A), we found a smaller range in V(A) for both FS and T‐C when compared to V(M). For FS, the Pitman's t‐test's P‐value for all frontal lobe regions was less than 0.01, indicating that the variances in V(M) and V(A) for all regions were different at a statistically significant level. For T‐C all regions except R SMC and R LPM had a P‐value below 0.01 (R SMC: t = 1.41, P = 0.07; R LPM: t = 1.14, P = 0.26). The direction of the difference was the same for all frontal lobe regions for both FS and T‐C: the variance was consistently larger for V(M) than for V(A).
Protocol Implementation—Group Difference Analysis
As proof‐of‐principle, and a test of the sensitivity of our automated frontal lobe parcellation techniques, the results from the automated FS and T‐C methods for 37 girls and 63 boys were used to examine the effect of gender on total volume in each frontal lobe region. The boys and girls were matched on age, FSIQ, PRI, handedness and Hollingshead Socioeconomic Status (SES). The groups differed on diagnosis (X 2 = 18.547, P < 0.001) and total cerebral volume (TCV) (F = 23.970, P < 0.001), with the girls having smaller percentages of ADHD and ASD subjects and smaller TCV than the boys. A comparison by gender was chosen for this proof‐of‐principle analysis because multiple areas of significantly smaller volume in girls were predicted due to overall smaller head and brain size in girls (for this group, the girls' mean TCV was found to be 8% smaller than the boys' mean TCV) and because this comparison provided the greatest statistical power for the available data sample [Caviness et al., 1996; Courchesne et al., 2000; De Bellis et al., 2001; Dekaban, 1978; Giedd et al., 1999; Sowell et al., 2002]. Two‐way ANOVA analysis was used to compare regional volumes between the boys and the girls. In this targeted analysis, TCV was excluded as a covariate despite a known gender difference in order to maximize statistical power and the number of regions showing differences, leaving a full analysis of differences by gender for future investigations.
The results from the manual parcellations identified significantly lower V(M) in the group of girls in bilateral DLPFC, DWM, medial PFC, and primary motor, right inferior PFC and SMC, and left LPM. The automated T‐C method identified significantly lower V(A) in all of the same regions (L LPM at trend level, P = 0.079) plus significant reductions in bilateral medial OFC and lateral OFC and left FEF. P‐values for each parcellation method are reported in Table 3.
Table 3.
P‐values for male versus female ANOVA for manual and automated T‐C parcellation volumes
| Anterior cingulate | DLPFC | DWM | FEF | Inferior PFC | Lateral OFC | Medial OFC | Medial PFC | Primary Motor | SMC | LPM | ||
|---|---|---|---|---|---|---|---|---|---|---|---|---|
| Left | Manual | 0.574 | 0.019 | <0.001 | 0.841 | 0.106 | 0.216 | 0.220 | 0.003 | 0.009 | 0.097 | 0.023 |
| T‐C | 0.171 | 0.004 | 0.003 | 0.025 | 0.007 | <0.001 | <0.001 | <0.001 | <0.001 | 0.191 | 0.079 | |
| Right | Manual | 0.680 | 0.007 | <0.001 | 0.781 | 0.027 | 0.699 | 0.139 | 0.006 | <0.001 | 0.024 | 0.135 |
| T‐C | 0.381 | 0.018 | 0.008 | 0.298 | 0.008 | <0.001 | 0.001 | 0.007 | 0.001 | 0.038 | 0.072 |
After sampling the manual parcellations to the FS surfaces, significant reductions in cortical V(M) were found in bilateral DLPFC and medial PFC, left LPM, and right primary motor and SMC. The automated FS parcellation method identified significantly lower cortical V(A) in all of the same regions (L LPM at trend level, P = 0.053) plus significant reductions in bilateral lateral OFC, right inferior PFC, left medial OFC, primary motor cortex and SMC. P‐values for each parcellation method are reported in Table 4.
Table 4.
P‐values for male versus female ANOVA for manual and automated FS parcellation cortical volumes
| Anterior Cingulate | DLPFC | FEF | Inferior PFC | Lateral OFC | Medial OFC | Medial PFC | Primary Motor | SMC | LPM | ||
|---|---|---|---|---|---|---|---|---|---|---|---|
| Left | Manual | 0.682 | 0.020 | 0.621 | 0.307 | 0.412 | 0.099 | 0.009 | 0.069 | 0.138 | 0.019 |
| FS | 0.976 | <0.001 | 0.085 | 0.220 | 0.021 | 0.021 | 0.008 | 0.007 | 0.002 | 0.053 | |
| Right | Manual | 0.831 | 0.010 | 0.848 | 0.059 | 0.723 | 0.179 | 0.015 | 0.003 | 0.022 | 0.192 |
| FS | 0.943 | 0.005 | 0.217 | <0.001 | 0.004 | 0.324 | 0.001 | 0.002 | 0.033 | 0.085 |
Comparing FreeSurfer and TOADS‐CRUISE Automated Parcellations
As an additional test of the reliability of our automated parcellations, we examined the correspondence between the FS and T‐C automated parcellation methods. To put both automated parcellations into the same space for comparison, the volume‐based T‐C parcellations were imported into FS space and sampled to the FS surfaces.
Looking at the overlap between the cortical surface labels for the automated FS and T‐C parcellations, the Dice's coefficient averaged over 100 subjects and all frontal lobe regions was 0.81 (see Fig. 6). In the left hemisphere, the average Dice's coefficient was 0.80; in the right hemisphere it was 0.83. Dice's coefficients for individual frontal lobe regions ranged from 0.75 to 0.86 except for left and right FEF, which were 0.62 and 0.59, respectively. Excluding the FEF, 5 regions had a mean Dice's coefficient greater than 0.85, 9 were greater than 0.80 and the remaining 4 were greater than 0.75.
Figure 6.
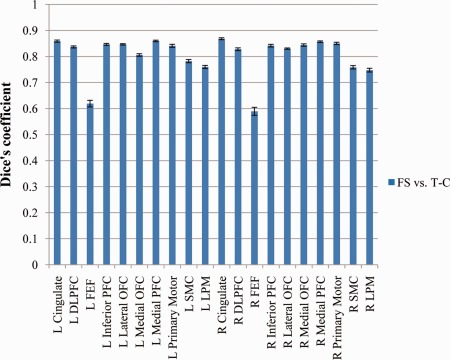
Mean automated FS versus automated T‐C Dice's coefficients for each frontal lobe region averaged over 100 analyzed subjects with standard error bars. [Color figure can be viewed in the online issue, which is available at http://wileyonlinelibrary.com.]
The mean percent volume differences between automated FS and T‐C cortical regions, averaged over all subjects and all regions was 12.4% (see Fig. 7). The mean for the left hemisphere was 12.2%; for the right hemisphere it was 12.5%. Average percent volume differences for the individual frontal lobe sub‐regions ranged from 5.7% to 19.6%, except for the left and right FEF, which were 23.6% and 32.1%, respectively. Excluding the FEF, 12 regions had a mean percent volume difference less than 10%, 3 were less than 15%, and the remaining 3 were less than 20%.
Figure 7.
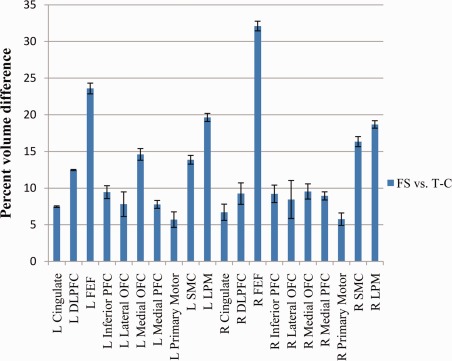
Mean automated FS versus automated T‐C percent volume difference for each frontal lobe region averaged over 100 analyzed subjects with standard error bars. [Color figure can be viewed in the online issue, which is available at http://wileyonlinelibrary.com.]
Using Pitman's t‐test, we found that the variance in V(A) for the two methods were comparable at the 0.05 level of significance for 14 out of 20 individual regions. Of the six regions in which variance was significantly different, the directions of the differences were mixed: variance was higher for the T‐C V(A) in four regions (bilateral medial OFC and bilateral LPM) and higher for the FS V(A) in two regions (R DLPFC, R primary motor).
Qualitatively, visual comparisons of the automated parcellations showed that T‐C parcellations did not follow sulci as closely as FS parcellations, which is most important for the anterior cingulate and primary motor cortex definitions, but T‐C parcellations were better at replicating the cut planes used in the manual protocol to divide regions where no explicit sulcal boundaries existed.
Comparing a Mixed‐Gender TD Atlas Against DX‐Gender Specific Atlases
In the comparisons conducted to examine the use of an atlas group composed of mixed‐gender TD subjects for labeling of both boys and girls of all diagnoses, results were somewhat mixed, with a small number of regions showing better automated labeling for one DX‐group over another or improvement in labeling with a same‐gender, same‐diagnosis atlas group. However, the lack of significant effects in a much larger number of regions strongly supported the use of a TD only atlas. For the automated FS parcellations, two regions showed a significant effect of DX‐gender group on Dice's coefficient in MANOVA analysis: L LPM (P = 0.013) and L SMC (P = 0.042). Tukey's post‐hoc tests showed that the effect for L LPM resulted from a trend level higher Dice's coefficient for ASD boys (mean = 0.711) when compared to ADHD girls (mean = 0.629, P = 0.054) and TD boys (mean = 0.627, P = 0.057). The effect for L SMC resulted from a higher Dice's coefficient for TD boys (mean = 0.771) when compared to ADHD boys (mean = 0.675, P = 0.034).
For T‐C, three regions showed a significant effect of DX‐gender group on Dice's coefficient: L DWM (P < 0.001), R DWM (P = 0.002) and L LPM (P = 0.047), Tukey's post‐hoc tests showed that the effect for L DWM resulted from a higher Dice's coefficient for ASD boys (mean = 0.783) when compared to ADHD girls (mean = 0.738, P = 0.003) and TD girls (mean = 0.738, P = 0.005) and a higher Dice's coefficient for ADHD boys (mean = 0.775) compared to ADHD girls (mean = 0.738, P = 0.026) and TD girls (mean = 0.738, P = 0.040). The effect for R DWM resulted from a higher Dice's coefficient for ASD boys (mean = 0.788) when compared to ADHD girls (mean = 0.739, P = 0.004) and TD girls (mean = 0.741, P = 0.011). For L LPM no DX‐gender group had a significantly higher Dice's coefficient than any other group (all P > 0.109).
To test single gender, single diagnosis atlas groups we calculated the manual versus automated Dice's coefficients for same gender, same diagnosis atlas parcellations and compared them to the Dice's coefficients for the original mixed‐gender, TD atlas parcellations. Analysis of variance (ANOVA) revealed that using DX‐gender specific atlases resulted in significantly higher Dice's coefficients for two regions for a single DX‐gender group in either T‐C or FS automation. However, these results were countered by the fact that DX‐gender specific atlases resulted in significantly lower Dice's coefficients for five regions, each for a single DX‐gender group and automation method. The overall lack of significant evidence for improvement in automated labeling using same‐gender, same‐diagnosis atlas groups validated our choice of a group composed of 13 mixed‐gender TD subjects as the final atlas group.
DISCUSSION
The automated implementation of the Ranta et al. [2009] frontal lobe parcellation protocol is a further step in our pursuit of a parcellation methodology that provides measures of functionally relevant frontal components, rather than primarily or predominantly anatomical components as in most previously published methodologies. Our analyses show that we have developed a reliable method to automatically parcellate brain MR data into functionally relevant frontal lobe sub‐regions using two programs for brain MR segmentation and parcellation (i.e., FS and T‐C). Although the automated methods do not reproduce the manual results exactly, this is not entirely unexpected nor undesirable. Overall, the reliability results are reasonably high, particularly considering that many of the regions being defined do not have boundaries visible in MR images, such as a continuous sulcal division or a change in tissue type, to guide automated parcellation. Additionally, the proof‐of‐principle application of the protocol to a cohort of boys and girls provides evidence of the feasibility and sensitivity of the automated methods and the high correspondence between the FS and T‐C automation methods is strong evidence for the validity of the automated results.
In developing automated parcellation methods based on our frontal lobe protocol we were seeking a tool for relatively large‐scale analyses, with the goal of identifying the anatomic correlates of a particular neuropsychiatric disorder through the application of a protocol to a large number of subjects. Because of its inherent statistical power, this approach allows the detection of subtle anatomical differences even if the protocol used presents some sensitivity or specificity deficiencies. Moreover, automated methods can, by definition, apply rules more consistently and objectively than human raters. Automated MR parcellation methods currently in use have most often been applied to regions with relatively clear boundaries, particularly the hippocampus [e.g., Jatzko et al., 2006; Nifosi et al., 2010; Tae et al., 2008] or to gyral‐based cortical surface parcellation [e.g., Lemaitre et al., 2010; Li et al., 2009; Lopez‐Garcia et al., 2006; Makris et al., 2005]. For regions like the hippocampus or the supramarginal gyrus, where relatively explicit boundaries exist, a carefully defined and executed manual delineation is generally considered the best possible parcellation method. However, in the definition of frontal regions, where sulcal boundaries often do not correspond to functional boundaries and no equally clear division is visible in MR scans, the alternate benefits of manual and automated parcellations are more open to debate. Furthermore, a true definition of functional divisions in any individual brain is only possible with methods beyond MR scanning, such as detailed electrophysiological mapping or post‐mortem cytoarchitectonic and connectivity studies. Thus, although our manual protocol definitions are based on a large body of information from electrophysiological, cytoarchitectonic, magnetic stimulation and functional imaging findings, which can be translated onto MR macroanatomy, they are still only informed approximations of the true functional divisions for each individual brain. However, this is not a reason to abandon detailed MR brain parcellation studies. Rather, in light of the significant contributions to the study of neuropsychiatric disorders that have been made with MR parcellation studies, the best methods for applying MR parcellations should continue to be refined, especially as stronger MRI scanners and more sophisticated automation techniques become available.
Our analyses show that for all regions except the FEF, a mean Dice's coefficient of at least 0.67 and a percent volume difference of less than 29% were achieved for both the FS and T‐C automation methods, indicating fairly high overall reliability between manual and automated labeling. The lower Dice's coefficients and higher percent volume differences for the FEF, although not ideal, are not entirely surprising. The FEF is the smallest region defined, has a particularly complicated boundary definition because it touches neither the medial nor lateral surface of the brain, and had the lowest intra‐ and inter‐rater reliability results for the manual protocol application [Ranta et al., 2009]. In addition, some difficulty in defining the DWM is apparent in the percent volume difference results for the T‐C automated parcellation but the issues with the DWM are not as severe as those for the FEF. Moreover, the main goal of DWM definition is the division of long or projecting association fibers from short association fibers (gyral white matter with strong associations to particular cortical regions), more than the measurement of DWM itself.
The decreased variance in automated versus manual parcellation volumes is worth noting. The regions with particularly small or large volumes that were produced for individual subject brains with manual parcellation seem to be considered extremes which are not permitted in the automated parcellations. We can speculate that this is due to decreased sensitivity in the automated protocol, in which real extremes in anatomical variability are being ignored, or we can attribute the difference to lower consistency in the manual protocol and the possibility of rater error. Without additional information available outside of MR imaging, we cannot know for certain which delineation is true for any particular parcellation, however, if the ultimate goal of frontal lobe parcellation is group analysis, the details underlying the difference may be of lesser importance than the overall consistency of the results.
The proof‐of‐principle application of the FS and T‐C automated protocols to a cohort of boys and girls provides important evidence in support of the consistency and possibly increased sensitivity of the automated parcellation methods proposed here. Every region for which volume was found to be significantly different between genders using manually derived volumes was also found to be significantly different using automatically derived volumes—mostly at the P < 0.05 level and always at no less than trend level. Both of the analyses using automatically derived volumes also identified a number of additional significant volume differences in frontal lobe regions. Based on previous studies including subjects in the same age range [Caviness et al., 1996; Courchesne et al., 2000; Sowell et al., 2002] we hypothesized that there would be widely distributed volume reductions in girls compared to boys. None of these previous studies specifically tested for differences in frontal lobe sub‐regions, however we believe that a relatively even distribution of lower volumes is likely and that increased sensitivity, rather than over‐identification, in the automated versus manual methods is a logical, though not certain, conclusion. The results are probably influenced by the significantly lower between‐subject variance in the automated methods' results as well, given that variance and statistical sensitivity are interrelated. Although open to some debate, these findings are potentially strong evidence of high consistency between automated and manual frontal lobe parcellation methods, as well as of possibly increased sensitivity of the automated methods.
The inclusion of two distinct automation methodologies in this study, that is, one cortical (FS) and one volume‐based (T‐C), introduces a degree of uncertainty into the evaluation of the automated FS parcellations and comparisons of the two automated methods. Some level of distortion is inevitably introduced by sampling from a volume to a surface, as is some degree of bias due to the manual parcellations having been carried out in the volume before being sampled to the surface for use in FS automation [Klein et al., 2010]. However, we expect these issues to be relatively minor due to the fact that the volume to surface sampling was done directly for one subject at a time and consisted of transformation from a single volume image to surfaces that were created from the same image and because the majority of the labeling landmarks were based on surface features. In addition, the use of two different methodologies allows users the option to choose the method of parcellation that best fits their research goals and also enabled a more powerful examination of automation validity and reliability.
In comparing the automated FS and T‐C parcellations, we found a high average Dice's coefficient as well as a low average percent volume difference. These high levels of correspondence between FS and T‐C were higher than those for comparisons between the manual approach and either automated method. Both methods appear to be prioritizing the same information from the manual parcellations on which they were based, and the high level of agreement greatly reduces the possibility that the parcellation results are an artifact of a particular feature of either automation method.
Given the multistep development of the automated parcellation methods presented here, it is difficult, if not impossible, to separate the individual contributions made by protocol design, intersubject anatomic variability and automation method to final discrepancies in manual versus automated labels. With the comparison of two automated parcellations we have ruled out any major bias introduced by either program and the high manual protocol intra‐ and inter‐rater reliability measures reported in Ranta et al. [2009] indicate that there were no major issues with protocol design or intersubject variability for manual raters.
Despite the multiple strengths of our data discussed above, there were also limitations. First, our automated parcellations were developed using manual parcellations of MR scans of children in a narrow age range (i.e., 8–13). Applicability was tested on children with ADHD and ASD, two highly prevalent neurodevelopmental disorders, but no other disorders with major volumetric or conformational abnormalities were included. However, the inclusion of subjects with ADHD and ASD in this study demonstrates the feasibility of our methods for analysis of neuropsychiatric disorders and allows for a future examination of group differences with the application of the automated approach to larger samples than could easily be analyzed using a manual parcellation protocol.
CONCLUSION
With frontal divisions closely corresponding to functional regions and high consistency and speed, the automated FreeSurfer and TOADS‐CRUISE implementations of our frontal lobe parcellation protocol presented here have the potential to further our understanding of the anatomic substrates of the large number of disorders in which frontal lobe abnormalities are hypothesized to be a contributing factor.
Supporting information
Supplementary Figure 1.) Overlap results for the IBSR18 data set. Values were averaged over all regions and then across the 306 brain pairs. Each box has lines at the lower quartile, median, and upper quartile values and the whiskers extend from each end of the box to 1.5 times the interquartile renge. Outliers are indicated by (+).(a.) shows the original comparisons presented in Figure 5 from Klein et al. 2009) and (b.) shows the equivalent results from ABA. The notched box shows the range of significance for the median.
ACKNOWLEDGMENTS
The authors are grateful to the families that participated in our studies.
REFERENCES
- Acosta MT, Pearl PL (2004): Imaging data in autism: From structure to malfunction. Semin Pediatr Neurol 11:205–213. [DOI] [PubMed] [Google Scholar]
- Almeida LG, Ricardo‐Garcell J, Prado H, Barajas L, Fernandez‐Bouzas A, Avila D, Martinez RB (2010): Reduced right frontal cortical thickness in children, adolescents and adults with ADHD and its correlation to clinical variables: A cross‐sectional study. J Psychiatr Res 44:1214–1223. [DOI] [PubMed] [Google Scholar]
- Alvarez JA, Emory E (2006): Executive function and the frontal lobes: A meta‐analytic review. Neuropsychol Rev 16:17–42. [DOI] [PubMed] [Google Scholar]
- Ashe J, Lungu OV, Basford AT, Lu X (2006): Cortical control of motor sequences. Curr Opin Neurobiol 16:213–221. [DOI] [PubMed] [Google Scholar]
- Barnes J, Lewis EB, Scahill RI, Bartlett JW, Frost C, Schott JM, Rossor MN, Fox NC (2007): Automated measurement of hippocampal atrophy using fluid‐registered serial MRI in AD and controls. J Comput Assist Tomogr 31:581–587. [DOI] [PubMed] [Google Scholar]
- Bazin PL, Pham DL (2008): Homeomorphic brain image segmentation with topological and statistical atlases. Med Image Anal 12:616–625. [DOI] [PMC free article] [PubMed] [Google Scholar]
- Bergouignan L, Chupin M, Czechowska Y, Kinkingnehun S, Lemogne C, Le Bastard G, Lepage M, Garnero L, Colliot O, Fossati P (2009): Can voxel based morphometry, manual segmentation and automated segmentation equally detect hippocampal volume differences in acute depression? Neuroimage 45:29–37. [DOI] [PubMed] [Google Scholar]
- Bouret S, Richmond BJ (2010): Ventromedial and orbital prefrontal neurons differentially encode internally and externally driven motivational values in monkeys. J Neurosci 30:8591–8601. [DOI] [PMC free article] [PubMed] [Google Scholar]
- Buchanan RW, Vladar K, Barta PE, Pearlson GD (1998): Structural evaluation of the prefrontal cortex in schizophrenia. Am J Psychiatry 155:1049–1055. [DOI] [PubMed] [Google Scholar]
- Carter JC, Lanham DC, Pham D, Bibat G, Naidu S, Kaufmann WE (2008): Selective cerebral volume reduction in Rett syndrome: A multiple‐approach MR imaging study. AJNR Am J Neuroradiol 29:436–441. [DOI] [PMC free article] [PubMed] [Google Scholar]
- Caviness VS, Kennedy DN, Richelme C, Rademacher J, Filipek PA (1996): The human brain age 7‐11 years: A volumetric analysis based on magnetic resonance images. Cereb Cortex 1996;6:726–736. [DOI] [PubMed] [Google Scholar]
- Chen M, Carass A, Wheeler B, Liu X, Prince JL (2010): Multi‐channel enhancement of the adaptive bases algorithm. In Proceedings of the 16th Annual Meeting of the Organization for Human Brain Mapping.
- Cherbuin N, Anstey KJ, Reglade‐Meslin C, Sachdev PS (2009): In vivo hippocampal measurement and memory: A comparison of manual tracing and automated segmentation in a large community‐based sample. PLoS One 4:e5265. [DOI] [PMC free article] [PubMed] [Google Scholar]
- Conners CK, editor (1997): Conners' Rating Scales—Revised. North Tonawanda, New York: Multi‐Health Systems Inc. [Google Scholar]
- Convit A, Wolf OT, de Leon MJ, Patalinjug M, Kandil E, Caraos C, Scherer A, Saint Louis LA, Cancro R (2001): Volumetric analysis of the pre‐frontal regions: Findings in aging and schizophrenia. Psychiatry Res 107:61–73. [DOI] [PubMed] [Google Scholar]
- Costafreda SG, Fu CH, Lee L, Everitt B, Brammer MJ, David AS (2006): A systematic review and quantitative appraisal of fMRI studies of verbal fluency: Role of the left inferior frontal gyrus. Hum Brain Mapp 27:799–810. [DOI] [PMC free article] [PubMed] [Google Scholar]
- Courchesne E, Chisum HJ, Townsend J, Cowles A, Covington J, Egaas B, Harwood M, Hinds S, Press GA (2000): Normal brain development and aging: Quantitative analysis at in vivo MR imaging in healthy volunteers. Radiology 216:672–682. [DOI] [PubMed] [Google Scholar]
- Courchesne E, Pierce K, Schumann CM, Redcay E, Buckwalter JA, Kennedy DP, Morgan J (2007): Mapping early brain development in autism. Neuron 56:399–413. [DOI] [PubMed] [Google Scholar]
- Crespo‐Facorro B, Kim J‐J, Andreasen NC, O'Leary DS, Wiser AK, Bailey JM, Harris G, Magnotta VA (1999): Human frontal cortex: An MRI‐based parcellation method. NeuroImage 10:500–519. [DOI] [PubMed] [Google Scholar]
- Crespo‐Facorro B, Kim J, Andreasen NC, Spinks R, O'Leary DS, Bockholt HJ, Harris G, Magnotta VA (2000): Cerebral cortex: A topographic segmentation method using magnetic resonance imaging. Psychiatry Res 100:97–126. [DOI] [PubMed] [Google Scholar]
- Dale AM, Fischl B, Sereno MI (1999): Cortical surface‐based analysis. I. Segmentation and cortical surface reconstruction. Neuroimage 9:179–194. [DOI] [PubMed] [Google Scholar]
- De Bellis MD, Keshavan MS, Beers SR, Hall J, Frustaci K, Masalehdan A, Noll J, Boring AM (2001): Sex differences in brain maturation during childhood and adolescence. Cereb Cortex 11:552–557. [DOI] [PubMed] [Google Scholar]
- Dekaban AS (1978): Changes in brain weights during the span of human life: Relation of brain weights to body heights and body weights. Ann Neurol 4:345–356. [DOI] [PubMed] [Google Scholar]
- Desikan RS, Ségonne F, Fischl B, Quinn BT, Dickerson BC, Blacker D, Buckner RL, Dale AM, Maguire RP, Hyman BT, Albert MS, Killiany RJ (2006): An automated labeling system for subdividing the human cerebral cortex on MRI scans into gyral based regions of interest. Neuroimage 31:968–980. [DOI] [PubMed] [Google Scholar]
- Desikan RS, Cabral HJ, Hess CP, Dillon WP, Glastonbury CM, Weiner MW, Schmansky NJ, Greve DN, Salat DH, Buckner RL, et al. (2009): Automated MRI measures identify individuals with mild cognitive impairment and Alzheimer's disease. Brain 132 (Part 8):2048–2057. [DOI] [PMC free article] [PubMed] [Google Scholar]
- Desikan RS, Cabral HJ, Settecase F, Hess CP, Dillon WP, Glastonbury CM, Weiner MW, Schmansky NJ, Salat DH, Fischl B (2010): Automated MRI measures predict progression to Alzheimer's disease. Neurobiol Aging 31:1364–1374. [DOI] [PMC free article] [PubMed] [Google Scholar]
- Destrieux C, Fischl B, Dale A, Halgren E (2010): Automatic parcellation of human cortical gyri and sulci using standard anatomical nomenclature. Neuroimage 53:1–15. [DOI] [PMC free article] [PubMed] [Google Scholar]
- Dewey J, Hana G, Russell T, Price J, McCaffrey D, Harezlak J, Sem E, Anyanwu JC, Guttmann CR, Navia B, Cohen R, Tate DF; HIV Neuroimaging Consortium (2010): Reliability and validity of MRI‐based automated volumetry software relative to auto‐assisted manual measurement of subcortical structures in HIV‐infected patients from a multisite study. Neuroimage 51:1334–1344. [DOI] [PMC free article] [PubMed] [Google Scholar]
- Dice LR (1945): Measurement of the amount of ecological association between species. Ecology 26:761–763. [Google Scholar]
- Dotson VM, Davatzikos C, Kraut MA, Resnick SM (2009): Depressive symptoms and brain volumes in older adults: A longitudinal magnetic resonance imaging study. J Psychiatry Neurosci 34:367–375. [PMC free article] [PubMed] [Google Scholar]
- Ecker C, Marquand A, Mourao‐Miranda J, Johnstone P, Daly EM, Brammer MJ, Maltezos S, Murphy CM, Robertson D, Williams SC, Murphy DGM (2010): Describing the brain in autism in five dimensions—Magnetic resonance imaging‐assisted diagnosis of autism spectrum disorder using a multiparameter classification approach. J Neurosci 30:10612–10623. [DOI] [PMC free article] [PubMed] [Google Scholar]
- Fischl B, Dale AM (2000): Measuring the thickness of the human cerebral cortex using magnetic resonance images. Proc Natl Acad Sci USA 97:11044–11049. [DOI] [PMC free article] [PubMed] [Google Scholar]
- Fischl B, Sereno MI, Dale AM (1999): Cortical surface‐based analysis. II. Inflation, flattening, and a surface‐based coordinate system. Neuroimage 9:195–207. [DOI] [PubMed] [Google Scholar]
- Fischl B, Liu A, Dale AM (2001): Automated manifold surgery: constructing geometrically accurate and topologically correct models of the human cerebral cortex. IEEE Trans Med Imaging 20:70–80. [DOI] [PubMed] [Google Scholar]
- Fischl B, Salat DH, Busa E, Albert M, Dieterich M, Haselgrove C, van der Kouwe A, Killiany R, Kennedy D, Klaveness S, Montillo A, Makris N, Rosen B, Dale AM (2002): Whole brain segmentation: Automated labeling of neuroanatomical structures in the human brain. Neuron 33:341–355. [DOI] [PubMed] [Google Scholar]
- Fischl B, van der Kouwe A, Destrieux C, Halgren E, Ségonne F, Salat DH, Busa E, Seidman LJ, Goldstein J, Kennedy D, Caviness V, Makris N, Rosen B, Dale AM (2004): Automatically parcellating the human cerebral cortex. Cereb Cortex 14:11–22. [DOI] [PubMed] [Google Scholar]
- Fischl B, Rajendran N, Busa E, Augustinack J, Hinds O, Yeo BT, Mohlberg H, Amunts K, Zilles K (2008): Cortical folding patterns and predicting cytoarchitecture. Cereb Cortex 18:1973–1980. [DOI] [PMC free article] [PubMed] [Google Scholar]
- Fleiss JL (1971): Measuring nominal scale agreement among many raters. Psychol Bull 76:378–382. [Google Scholar]
- Fredericksen KA, Cutting LE, Kates WR, Mostofsky SH, Singer HS, Cooper KL, Lanham DC, Denckla MB, Kaufmann WE (2002): Disproportionate increases of white matter in right frontal lobe in Tourette syndrome. Neurology 58:85–89. [DOI] [PubMed] [Google Scholar]
- Fuster JM (1997): The Prefrontal Cortex. New York: Raven Press. [Google Scholar]
- Geschwind N (1979): Specializations of the human brain. Sci Am 241:180–199. [DOI] [PubMed] [Google Scholar]
- Geyer S, Matelli M, Luppino G, Zilles K (2000): Functional neuroanatomy of the primate isocortical motor system. Anat Embryol (Berl) 202:443–474. [DOI] [PubMed] [Google Scholar]
- Giedd JN, Blumenthal J, Jeffries NO, Castellanos FX, Liu H, Zijdenbos A, Paus T, Evans AC, Rapoport JL (1999): Brain development during childhood and adolescence: A longitudinal MRI study. Nat Neurosci 2:861–863. [DOI] [PubMed] [Google Scholar]
- Gothelf D, Furfaro JA, Hoeft F, Eckert MA, Hall SS, O'Hara R, Erba HW, Ringel J, Hayashi KM, Patnaik S, Golianu B, Kraemer HC, Thompson PM, Piven J, Reiss AL (2008): Neuroanatomy of fragile X syndrome is associated with aberrant behavior and the fragile X mental retardation protein (FMRP). Ann Neurol 63:40–51. [DOI] [PMC free article] [PubMed] [Google Scholar]
- Graziano MS, Aflalo TN (2007): Mapping behavioral repertoire onto the cortex. Neuron 56:239–251. [DOI] [PubMed] [Google Scholar]
- Hadjikhani N, Joseph RM, Snyder J, Tager‐Flusberg H (2006): Anatomical differences in the mirror neuron system and social cognition network in autism. Cereb Cortex 16:1276–1282. [DOI] [PubMed] [Google Scholar]
- Han X, Pham DL, Tosun D, Rettmann ME, Xu C, Prince JL (2004): CRUISE: Cortical reconstruction using implicit surface evolution. Neuroimage 23:997–1012. [DOI] [PubMed] [Google Scholar]
- Hasboun D, Chantome M, Zouaoui A, Sahel M, Deladoeuille M, Sourour N, Duyme M, Baulac M, Marsault C, Dormont D (1996): MR determination of hippocampal volume: Comparison of three methods. AJNR Am J Neuroradiol 17:1091–1098. [PMC free article] [PubMed] [Google Scholar]
- Heckemann RA, Keihaninejad S, Aljabar P, Rueckert D, Hajnal JV, Hammers A (2010): Improving intersubject image registration using tissue‐class information benefits robustness and accuracy of multi‐atlas based anatomical segmentation. Neuroimage 51:221–227. [DOI] [PubMed] [Google Scholar]
- Howard MA, Roberts N, Garcia‐Finana M, Cowell PE (2003): Volume estimation of prefrontal cortical subfields using MRI and stereology. Brain Res Brain Res Protoc 10:125–138. [DOI] [PubMed] [Google Scholar]
- Jatzko A, Rothenhofer S, Schmitt A, Gaser C, Demirakca T, Weber‐Fahr W, Wessa M, Magnotta V, Braus DF (2006): Hippocampal volume in chronic posttraumatic stress disorder (PTSD): MRI study using two different evaluation methods. J Affect Disord 94:121–126. [DOI] [PubMed] [Google Scholar]
- John JP, Wang L, Moffitt AJ, Singh HK, Gado MH, Csernansky JG (2006): Inter‐rater reliability of manual segmentation of the superior, inferior and middle frontal gyri. Psychiatry Res 148:151–163. [DOI] [PubMed] [Google Scholar]
- Kates WR, Folley BS, Lanham DC, Capone GT, Kaufmann WE (2002a): Cerebral growth in Fragile X syndrome: review and comparison with Down syndrome. Microsc Res Tech 57:159–167. [DOI] [PubMed] [Google Scholar]
- Kates WR, Frederikse M, Mostofsky SH, Folley BS, Cooper K, Mazur‐Hopkins P, Kofman O, Singer HS, Denckla MB, Pearlson GD, Kaufmann WE (2002b): MRI parcellation of the frontal lobe in boys with attention deficit hyperactivity disorder or Tourette syndrome. Psychiatry Res 116:63–81. [DOI] [PubMed] [Google Scholar]
- Kelly AM, Margulies DS, Castellanos FX (2007): Recent advances in structural and functional brain imaging studies of attention‐deficit/hyperactivity disorder. Curr Psychiatry Rep 9:401–407. [DOI] [PubMed] [Google Scholar]
- Kennedy DN, Lange N, Makris N, Bates J, Meyer J, Caviness V (1998): Gyri of the human neocortex: An MRI‐based analysis of volume and variance. Cerebral Cortex 8:372–384. [DOI] [PubMed] [Google Scholar]
- Kikinis Z, Fallon JH, Niznikiewicz M, Nestor P, Davidson C, Bobrow L, Pelavin PE, Fischl B, Yendiki A, McCarley RW, Kikinis R, Kubicki M, Shenton ME (2010): Gray matter volume reduction in rostral middle frontal gyrus in patients with chronic schizophrenia. Schizophr Res 123:153–159. [DOI] [PMC free article] [PubMed] [Google Scholar]
- Klein A, Andersson J, Ardekani BA, Ashburner J, Avants B, Chiang MC, Christensen GE, Collins DL, Gee J, Hellier P, Song JH, Jenkinson M, Lepage C, Rueckert D, Thompson P, Vercauteren T, Woods RP, Mann JJ, Parsey RV (2009): Evaluation of 14 nonlinear deformation algorithms applied to human brain MRI registration. Neuroimage 46:786–802. [DOI] [PMC free article] [PubMed] [Google Scholar]
- Klein A, Ghosh SS, Avants B, Yeo BT, Fischl B, Ardekani B, Gee JC, Mann JJ, Parsey RV (2010): Evaluation of volume‐based and surface‐based brain image registration methods. Neuroimage 51:214–220. [DOI] [PMC free article] [PubMed] [Google Scholar]
- Kuperberg GR, Broome MR, McGuire PK, David AS, Eddy M, Ozawa F, Goff D, West WC, Williams SC, van der Kouwe AJ, Salat DH, Dale AM, Fischl B (2003): Regionally localized thinning of the cerebral cortex in schizophrenia. Arch Gen Psychiatry 60:878–888. [DOI] [PubMed] [Google Scholar]
- Lacerda AL, Hardan AY, Yorbik O, Keshavan MS (2003): Measurement of the orbitofrontal cortex: A validation study of a new method. Neuroimage 19:665–673. [DOI] [PubMed] [Google Scholar]
- Landis JR, Koch GG (1977): An application of hierarchical kappa‐type statistics in the assessment of majority agreement among multiple observers. Biometrics 33:363–374. [PubMed] [Google Scholar]
- Lehmann M, Douiri A, Kim LG, Modat M, Chan D, Ourselin S, Barnes J, Fox NC (2010): Atrophy patterns in Alzheimer's disease and semantic dementia: a comparison of FreeSurfer and manual volumetric measurements. Neuroimage 49:2264–2274. [DOI] [PubMed] [Google Scholar]
- Lemaitre H, Goldman AL, Sambataro F, Verchinski BA, Meyer‐Lindenberg A, Weinberger DR, Mattay VS (2010): Normal age‐related brain morphometric changes: Nonuniformity across cortical thickness, surface area and gray matter volume? Neurobiol Aging 33:617.e1–617.e9. [DOI] [PMC free article] [PubMed] [Google Scholar]
- Li G, Guo L, Nie J, Liu T (2009): Automatic cortical sulcal parcellation based on surface principal direction flow field tracking. Inf Process Med Imaging 21:202–214. [DOI] [PubMed] [Google Scholar]
- Lopez‐Garcia P, Aizenstein HJ, Snitz BE, Walter RP, Carter CS (2006): Automated ROI‐based brain parcellation analysis of frontal and temporal brain volumes in schizophrenia. Psychiatry Res 147:153–161. [DOI] [PubMed] [Google Scholar]
- Lord C, Rutter M, Le Couteur A (1994): Autism diagnostic interview‐revised: A revised version of a diagnostic interview for caregivers of individuals with possible pervasive developmental disorders. J Autism Dev Disord 24:659–685. [DOI] [PubMed] [Google Scholar]
- Lord C, Risi S, Lambrecht L, Cook EHJ, Leventhal BL, DiLavore PC, Pickles A, Rutter M (2000): The autism diagnostic observation schedule‐generic: A standard measure of social and communication deficits associated with the spectrum of autism. J Autism Dev Disord 30:205–223. [PubMed] [Google Scholar]
- Makris N, Meyer JW, Bates JF, Yeterian EH, Kennedy DN, Caviness VS (1999): MRI‐Based topographic parcellation of human cerebral white matter and nuclei. II. Rationale and applications with systematics of cerebral connectivity. Neuroimage 9:18–45. [DOI] [PubMed] [Google Scholar]
- Makris N, Schlerf JE, Hodge SM, Haselgrove C, Albaugh MD, Seidman LJ, Rauch SL, Harris G, Biederman J, Caviness VS Jr, Kennedy DN, Schmahmann JD (2005): MRI‐based surface‐assisted parcellation of human cerebellar cortex: An anatomically specified method with estimate of reliability. Neuroimage 25:1146–1160. [DOI] [PubMed] [Google Scholar]
- Marsh R, Zhu H, Wang Z, Skudlarski P, Peterson BS (2007): A developmental fMRI study of self‐regulatory control in Tourette's syndrome. Am J Psychiatry 164:955–966. [DOI] [PMC free article] [PubMed] [Google Scholar]
- McAuliffe M, Lalonde E, McGarry D, Gandler W, Csaky K, Trus B (2001): Medical Image Processing, Analysis and Visualization in Clinical Research. Proceedings of the 14th IEEE Symposium on Computer‐Based Medical Systems, Bethesda, Maryland, United States. pp 381–386.
- McGlinchey‐Berroth R, Cermak LS, Carrillo MC, Armfield S, Gabrieli JDE, Disterhoft JF (1995): Impaired delay eyeblink conditioning in amnesic Korsakoff's patients and recovered alcoholics. Alcohol Clin Exp Res 19:1127–1132. [DOI] [PubMed] [Google Scholar]
- Morey RA, Petty CM, Xu Y, Hayes JP, Wagner HR II, Lewis DV, LaBar KS, Styner M, McCarthy G (2009): A comparison of automated segmentation and manual tracing for quantifying hippocampal and amygdala volumes. Neuroimage 45:855–866. [DOI] [PMC free article] [PubMed] [Google Scholar]
- Mostofsky SH, Cooper KL, Kates WR, Denckla MB, Kaufmann WE (2002): Smaller prefrontal and premotor volumes in boys with ADHD. Biol Psychiatry 52:785–794. [DOI] [PubMed] [Google Scholar]
- Mostofsky SH, Burgess MP, Gidley Larson JC (2007): Increased motor cortex white matter volume predicts motor impairment in autism. Brain 130 (Part 8):2117–2122. [DOI] [PubMed] [Google Scholar]
- Nery FG, Chen HH, Hatch JP, Nicoletti MA, Brambilla P, Sassi RB, Mallinger AG, Keshavan MS, Soares JC (2009): Orbitofrontal cortex gray matter volumes in bipolar disorder patients: a region‐of‐interest MRI study. Bipolar Disord 11:145–153. [DOI] [PubMed] [Google Scholar]
- Nesvag R, Lawyer G, Varnas K, Fjell AM, Walhovd KB, Frigessi A, Jonsson EG, Agartz I (2008): Regional thinning of the cerebral cortex in schizophrenia: Effects of diagnosis, age and antipsychotic medication. Schizophr Res 98:16–28. [DOI] [PubMed] [Google Scholar]
- Nifosi F, Toffanin T, Follador H, Zonta F, Padovan G, Pigato G, Carollo C, Ermani M, Amista P, Perini GI (2010): Reduced right posterior hippocampal volume in women with recurrent familial pure depressive disorder. Psychiatry Res 184:23–28. [DOI] [PubMed] [Google Scholar]
- Nigg JT, Casey BJ (2005): An integrative theory of attention‐deficit/ hyperactivity disorder based on the cognitive and affective neurosciences. Dev Psychopathol 17:785–806. [DOI] [PubMed] [Google Scholar]
- Oliveira PP Jr, Nitrini R, Busatto G, Buchpiguel C, Sato JR, Amaro E Jr (2010): Use of SVM methods with surface‐based cortical and volumetric subcortical measurements to detect Alzheimer's disease. J Alzheimers Dis 19:1263–1272. [DOI] [PubMed] [Google Scholar]
- Ongur D, Ferry AT, Price JL (2003): Architectonic subdivision of the human orbital and medial prefrontal cortex. J Comp Neurol 460:425–449. [DOI] [PubMed] [Google Scholar]
- Pardoe HR, Pell GS, Abbott DF, Jackson GD (2009): Hippocampal volume assessment in temporal lobe epilepsy: How good is automated segmentation? Epilepsia 50:2586–2592. [DOI] [PMC free article] [PubMed] [Google Scholar]
- Pinter JD, Eliez S, Schmitt JE, Capone GT, Reiss AL (2001): Neuroanatomy of Down's syndrome: A high‐resolution MRI study. Am J Psychiatry 158:1659–1665. [DOI] [PubMed] [Google Scholar]
- Pitman EJG (1939): A note on normal correlation. Biometricka 31:1–2, 9–12. [Google Scholar]
- Porter MA, Coltheart M, Langdon R (2007): The neuropsychological basis of hypersociability in Williams and Down syndrome. Neuropsychologia 45:2839–2849. [DOI] [PubMed] [Google Scholar]
- Rademacher J, Galaburda AM, Kennedy DN, Filipek PA, Caviness VS (1992): Human cerebral cortex: Localization, parcellation, and morphometry with magnetic resonance imaging. J Cogn Neurosci 4:352–374. [DOI] [PubMed] [Google Scholar]
- Ranta ME, Crocetti D, Clauss JA, Kraut MA, Mostofsky SH, Kaufmann WE (2009): Manual MRI parcellation of the frontal lobe. Psychiatry Res 172:147–154. [DOI] [PMC free article] [PubMed] [Google Scholar]
- Reich W, Welner Z, Herjanic B (1997): The Diagnostic Interview for Children and Adolescents‐IV. North Tonawanda: Multi‐Health Systems. [Google Scholar]
- Rohde GK, Aldroubi A, Dawant BM (2003): The adaptive bases algorithm for intensity‐based nonrigid image registration. IEEE Trans Med Imaging 22:1470–1479. [DOI] [PubMed] [Google Scholar]
- Rushworth MF, Buckley MJ, Behrens TE, Walton ME, Bannerman DM (2007): Functional organization of the medial frontal cortex. Curr Opin Neurobiol 17:220–227. [DOI] [PubMed] [Google Scholar]
- Rypma B (2006): Factors controlling neural activity during delayed‐response task performance: Testing a memory organization hypothesis of prefrontal function. Neuroscience 139:223–235. [DOI] [PubMed] [Google Scholar]
- Sanides F (1972): Representation in the cerebral cortex and its areal lamination patterns In: Bourne GF, editor. The Structure and Function of Nervous Tissue. New York, NY: Academic Press; pp 330–453. [Google Scholar]
- Scheinin NM, Aalto S, Koikkalainen J, Lötjönen J, Karrasch M, Kemppainen N, Viitanen M, Någren K, Helin S, Scheinin M, Rinne JO (2009): Follow‐up of [11C]PIB uptake and brain volume in patients with Alzheimer disease and controls. Neurology 73:1186–1192. [DOI] [PubMed] [Google Scholar]
- Segonne F, Dale AM, Busa E, Glessner M, Salat D, Hahn HK, Fischl B (2004): A hybrid approach to the skull stripping problem in MRI. Neuroimage 22:1060–1075. [DOI] [PubMed] [Google Scholar]
- Segonne F, Grimson E, Fischl B (2005): A genetic algorithm for the topology correction of cortical surfaces. Inf Process Med Imaging 19:393–405. [DOI] [PubMed] [Google Scholar]
- Shad MU, Muddasani S, Keshavan MS (2006): Prefrontal subregions and dimensions of insight in first‐episode schizophrenia—A pilot study. Psychiatry Res 146:35–42. [DOI] [PubMed] [Google Scholar]
- Shaw P, Lerch J, Greenstein D, Sharp W, Clasen L, Evans A, Giedd J, Castellanos FX, Rapoport J (2006): Longitudinal mapping of cortical thickness and clinical outcome in children and adolescents with attention‐deficit/hyperactivity disorder. Arch Gen Psychiatry 63:540–549. [DOI] [PubMed] [Google Scholar]
- Shaw P, Eckstrand K, Sharp W, Blumenthal J, Lerch JP, Greenstein D, Clasen L, Evans A, Giedd J, Rapoport JL (2007): Attention‐deficit/hyperactivity disorder is characterized by a delay in cortical maturation. Proc Natl Acad Sci USA 104:19649–19654. [DOI] [PMC free article] [PubMed] [Google Scholar]
- Sowell ER, Trauner DA, Gamst A, Jernigan TL (2002): Development of cortical and subcortical brain structures in childhood and adolescence: a structural MRI study. Dev Med Child Neurol 44:4–16. [DOI] [PubMed] [Google Scholar]
- Sowell ER, Thompson PM, Welcome SE, Henkenius AL, Toga AW, Peterson BS (2003): Cortical abnormalities in children and adolescents with attention‐deficit hyperactivity disorder. Lancet 362:1699–1707. [DOI] [PubMed] [Google Scholar]
- Suzuki M, Zhou SY, Takahashi T, Hagino H, Kawasaki Y, Niu L, Matsui M, Seto H, Kurachi M (2005): Differential contributions of prefrontal and temporolimbic pathology to mechanisms of psychosis. Brain 128 (Part 9):2109–2122. [DOI] [PubMed] [Google Scholar]
- Tae WS, Kim SS, Lee KU, Nam EC, Kim KW (2008): Validation of hippocampal volumes measured using a manual method and two automated methods (FreeSurfer and IBASPM) in chronic major depressive disorder. Neuroradiology 50:569–581. [DOI] [PubMed] [Google Scholar]
- Tekin S, Cummings JL (2002): Frontal‐subcortical neuronal circuits and clinical neuropsychiatry: An update. J Psychosom Res 53:647–654. [DOI] [PubMed] [Google Scholar]
- Tinaz S, Courtney MG, Stern CE (2010): Focal cortical and subcortical atrophy in early Parkinson's disease. Mov Disord 26:436–441. [DOI] [PMC free article] [PubMed] [Google Scholar]
- Tzourio‐Mazoyer N, Landeau B, Papathanassiou D, Crivello F, Etard O, Delcroix N, Mazoyer B, Joliot M (2002): Automated anatomical labeling of activations in SPM using a macroscopic anatomical parcellation of the MNI MRI single‐subject brain. Neuroimage 15:273–289. [DOI] [PubMed] [Google Scholar]
- Voets NL, Hough MG, Douaud G, Matthews PM, James A, Winmill L, Webster P, Smith S (2008): Evidence for abnormalities of cortical development in adolescent‐onset schizophrenia. Neuroimage 43:665–675. [DOI] [PubMed] [Google Scholar]
- Wan J, Carass A, Resnick SM, Prince JL (2008): Automated Reliable Labeling of the Cortical Surface. Proc IEEE Int Symp Biomed Imaging 2008:440. [DOI] [PMC free article] [PubMed] [Google Scholar]
- Warfield SK, Zou KH, Wells WM (2004): Simultaneous truth and performance level estimation (STAPLE): An algorithm for the validation of image segmentation. IEEE Trans Med Imaging 23:903–921. [DOI] [PMC free article] [PubMed] [Google Scholar]
- Wechsler D (1991): Wechsler Intelligence Scale for Children‐III. San Antonio, TX: The Psychological Corporation. [Google Scholar]
- Wechsler DL (1992): Wechsler Individual Achievement Test. San Antonio, TX: The Psychological Corporation. [Google Scholar]
- Wechsler DL (2002): Wechsler Individual Achievement Test‐II. San Antonio, TX: The Psychological Corporation. [Google Scholar]
- Wechsler DL (2003): Wechsler Intelligence Scale for Children, 4th ed. San Antonio, TX: The Psychological Corporation. [Google Scholar]
- Welner Z, Reich W, Herjanic B, Jung KG, Amado H (1987): Reliability, validity, and parent‐child agreement studies of the Diagnostic Interview for Children and Adolescents (DICA). J Am Acad Child Adolesc Psychiatry 26:649–653. [DOI] [PubMed] [Google Scholar]
- Westman E, Simmons A, Zhang Y, Muehlboeck JS, Tunnard C, Liu Y, Collins L, Evans A, Mecocci P, Vellas B, Tsolaki M, Kłoszewska I, Soininen H, Lovestone S, Spenger C, Wahlund LO; NeuroMed consortium (2011): Multivariate analysis of MRI data for Alzheimer's disease, mild cognitive impairment and healthy controls. Neuroimage 54:1178–1187. [DOI] [PubMed] [Google Scholar]
- Wible CG, Shenton ME, Fischer IA, Allard JE, Kikinis R, Jolesz FA, Iosifescu DV, McCarley RW (1997): Parcellation of the human prefrontal cortex using MRI. Psychiatry Res 76:29–40. [DOI] [PubMed] [Google Scholar]
- Wolosin SM, Richardson ME, Hennessey JG, Denckla MB, Mostofsky SH (2007): Abnormal cerebral cortex structure in children with ADHD. Hum Brain Mapp 30:175–184. [DOI] [PMC free article] [PubMed] [Google Scholar]
- Yamasue H, Iwanami A, Hirayasu Y, Yamada H, Abe O, Kuroki N, Fukuda R, Tsujii K, Aoki S, Ohtomo K, Kato N, Kasai K (2004): Localized volume reduction in prefrontal, temporolimbic, and paralimbic regions in schizophrenia: An MRI parcellation study. Psychiatry Res 131:195–207. [DOI] [PubMed] [Google Scholar]
- Zijdenbos AP, Dawant BM, Margolin RA, Palmer AC (1994): Morphometric analysis of white matter lesions in MR images: Method and validation. IEEE Trans Med Imaging 13:716–724. [DOI] [PubMed] [Google Scholar]
- Zilles K (1990): The Human Nervous System. San Diego, CA: Academic Press; pp 757–802. [Google Scholar]
- Zilles K, Schleicher A, Langermann C, Amunts K, Morosan P, Palomero‐Galagher N (1997): Quantitative analysis of the sluci in the human cerebral cortex: development, regional heterogeneity, gender differences, asymmetry, intersubject variability and cortical architecture. Hum Brain Mapp 5:218–221. [DOI] [PubMed] [Google Scholar]
Associated Data
This section collects any data citations, data availability statements, or supplementary materials included in this article.
Supplementary Materials
Supplementary Figure 1.) Overlap results for the IBSR18 data set. Values were averaged over all regions and then across the 306 brain pairs. Each box has lines at the lower quartile, median, and upper quartile values and the whiskers extend from each end of the box to 1.5 times the interquartile renge. Outliers are indicated by (+).(a.) shows the original comparisons presented in Figure 5 from Klein et al. 2009) and (b.) shows the equivalent results from ABA. The notched box shows the range of significance for the median.