Abstract
The intestinal microbiota compositions of 92 Japanese men were identified following consumption of identical meals for 3 days, and collected feces were analyzed through terminal restriction fragment length polymorphism. The obtained operational taxonomic units and smoking habits of subjects were analyzed by a data mining software. The constructed decision tree was able to identify explicitly the groups of smokers and nonsmokers. In particular, 4 smokers, who smoked 20 cigarettes/day, i.e., heavy smokers, were gathered in the same group of the decision tree and were clearly identified. Related operational taxonomic unit were traced to understand the species of bacteria, but all were found to be uncultured bacteria.
Keywords: human intestinal microbiota, restriction enzyme, operational taxonomic unit, smoking habit, heavy smoker, data mining analysis, decision tree
The human intestinal microbiota (HIM) is closely related to our health, and practical research on the relationship with the human immune systems and diseases is now being performed. Here we tried to apply data mining analysis (DM) to identify or discriminate the relation between the smoking habits of subjects and obtained HIM data from feces.
To avoid the influences of dietary factors, we designed identical meals (1,879 kcal/d), which were fed to 92 healthy male volunteers living in Japan for 3 days. All dietary components were controlled, and beverages were restricted to water, black coffee, or green tea in order to control carbohydrate intake. The ages and body mass indexes (BMI) of the subjects were 21–59 years (average: 36.8) and 17.3–30.1 kg/m2 (average: 22.6), respectively. Fecal samples were analyzed by terminal restriction fragment length polymorphism (T-RFLP) using 3 primer restriction enzyme systems [1, 2].The reason for applying T-RFLP was as follows. First, the numerical data obtained from T-RFLP are reproducible, and second the processing is comparatively easy and reasonable for handling large numbers of subjects. Third, T-RFLP provides appropriate numbers of data for a subsequent numerical analysis, which requires a balance between the field number (horizontal axis) and records number (vertical axis). The studies were performed in accordance with the protocol approved by the RIKEN Research Ethics Committee, and the OTU data were accumulated by the Benno Laboratory, RIKEN.
Bacterial DNA was isolated from 40–100 mg of feces using the modified method described by Matsuki et al. [3]. Amplification of the fecal 16S rDNA, restriction enzyme digestion, size fractionation of the T-RFs and T-RFLP analysis were carried out as previously described [4,5,6]. PCR was performed with FAM-labeled 516f (5′-TGCCAGCAGCCGCGGTA-3′; E. coli positions 516-532) or 27f (5′-AGAGTTTGATCCTGGCTCAG-3′; E. coli positions 8-27) and the reverse primer 1510r (5′-GGTTACCTTGTTACGACTT-3′; E. coli positions 1510–1492). For the PCR products amplified with the 516f primer, the resulting 16S rDNA amplicons were further treated for 1 hr with 2 U of BslI or HaeIII (New England Biolabs, Ipswich, MA, USA), and for those amplified with the 27f primer, the resulting 16S rDNA amplicons were treated for 1 hr with 1 U of MspI (TaKaRa Bio Inc., Otsu, Shiga, Japan). The digestion products were fractionated using an automated sequence analyzer (ABI PRISM 3130xl DNA Sequencer, Applied Biosystems, Carlsbad, CA, USA) and analyzed with the GeneMapper software (Applied Biosystems).
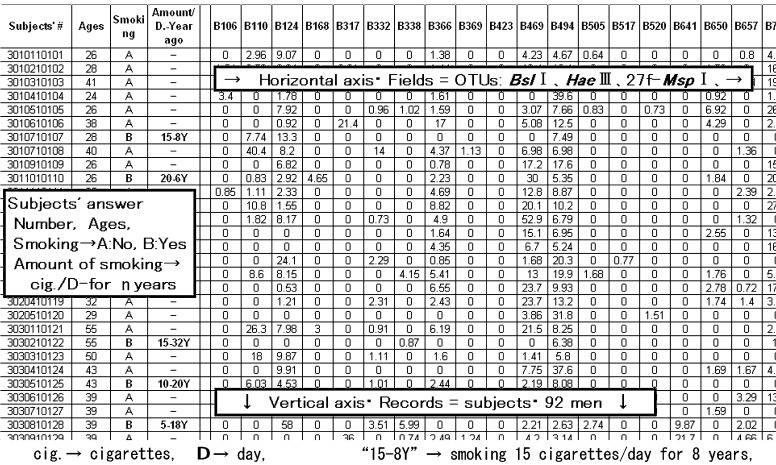
The obtained data for operational taxonomic units (OTUs) were abbreviated as B--- (---: base pair number) for BslI, HA--- for HaeIII and M--- for 27fMspI. The amounts for each OTU represent the fluorescence intensity and then concentrations of each OUT group. These OTU data are reproducible and can be used for further numerical analyses. A total of 80 OTUs were combined with the answers of 92 subjects and analyzed by data mining (DM) software (IBM-SPSS Clementine-14). Due to the large scale of the data, only a portion of the 2-dimensional Excel data is shown in Fig. 1 as an example. The subjects contained 16 smokers, and their smoking habits were abbreviated as number of cigarettes/day-number of years, e.g., “5-2Y” means smoking 5 cigarettes/day for 2 years.
Fig. 1.
A part of the obtained 2 dimensional excel data
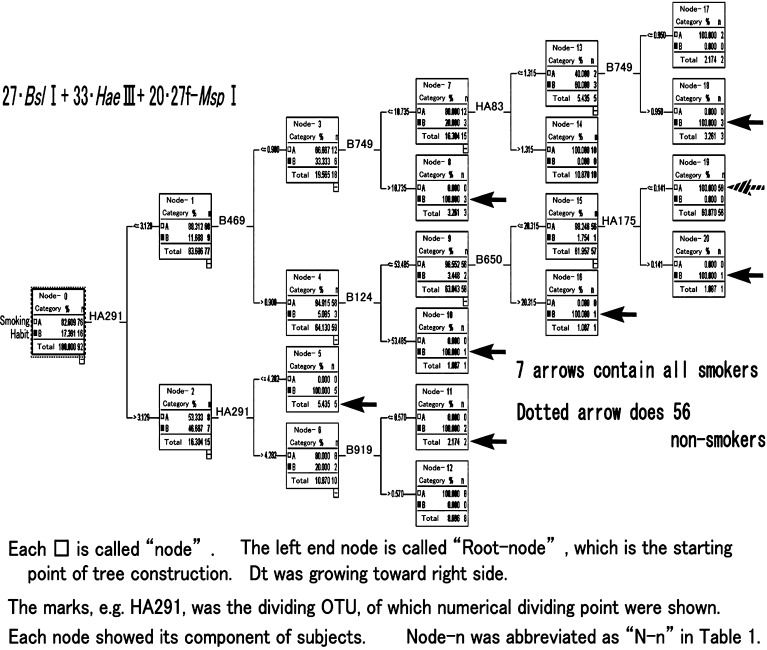
After the analyses, DM provided a decision tree1 (Dt) as shown in Fig. 2, which identified explicitly the various groups of smokers. The left end of Fig. 2 is called the root node, i.e., the starting point of tree construction, and the Dt grew toward the right to divide the subjects. The details of the Dt and the pathway to reach the terminal node2 indicated clearly the species and quantities of OTUs, which played a role in dividing the various smoking groups (i.e., node). We applied a dividing system using the Classification and Regression Tree (C&RT) approach, which is the most typical construction method for Dt, using the Gini coefficient between the smoking status and OTUs data and divided the records into two subsets so that the records within each subset were more homogeneous than in the previous subset. C&RT is quite flexible, and allows unequal misclassification costs to be considered compared with the other growing systems of DM. In Fig. 2, the 7 arrows indicated all the nodes of the 16 smokers (B: yes), and the dotted arrow indicated a node that contained 56 subjects, i.e., 74% of the nonsmokers (A: no) were gathered in the node. A major specialty of this method of DM is that it uses a single selected OUT for each step of Dt construction. In Fig. 2, only 8 OTUs out of 80 were utilized, with 2 OTUs, i.e., HA291 and B749, being applied twice, meaning that the other 72 were not used to construct the tree shape. Therefore, we can accept the fact that a large number of subjects were gathered in a node, i.e., 56 subjects in N-19. In other words, only these 8 OTUs were related in some way with the present smoking habits.
Fig. 2.
Decision-tree (Dt) obtained by DM smoking habit with 80-OTUs
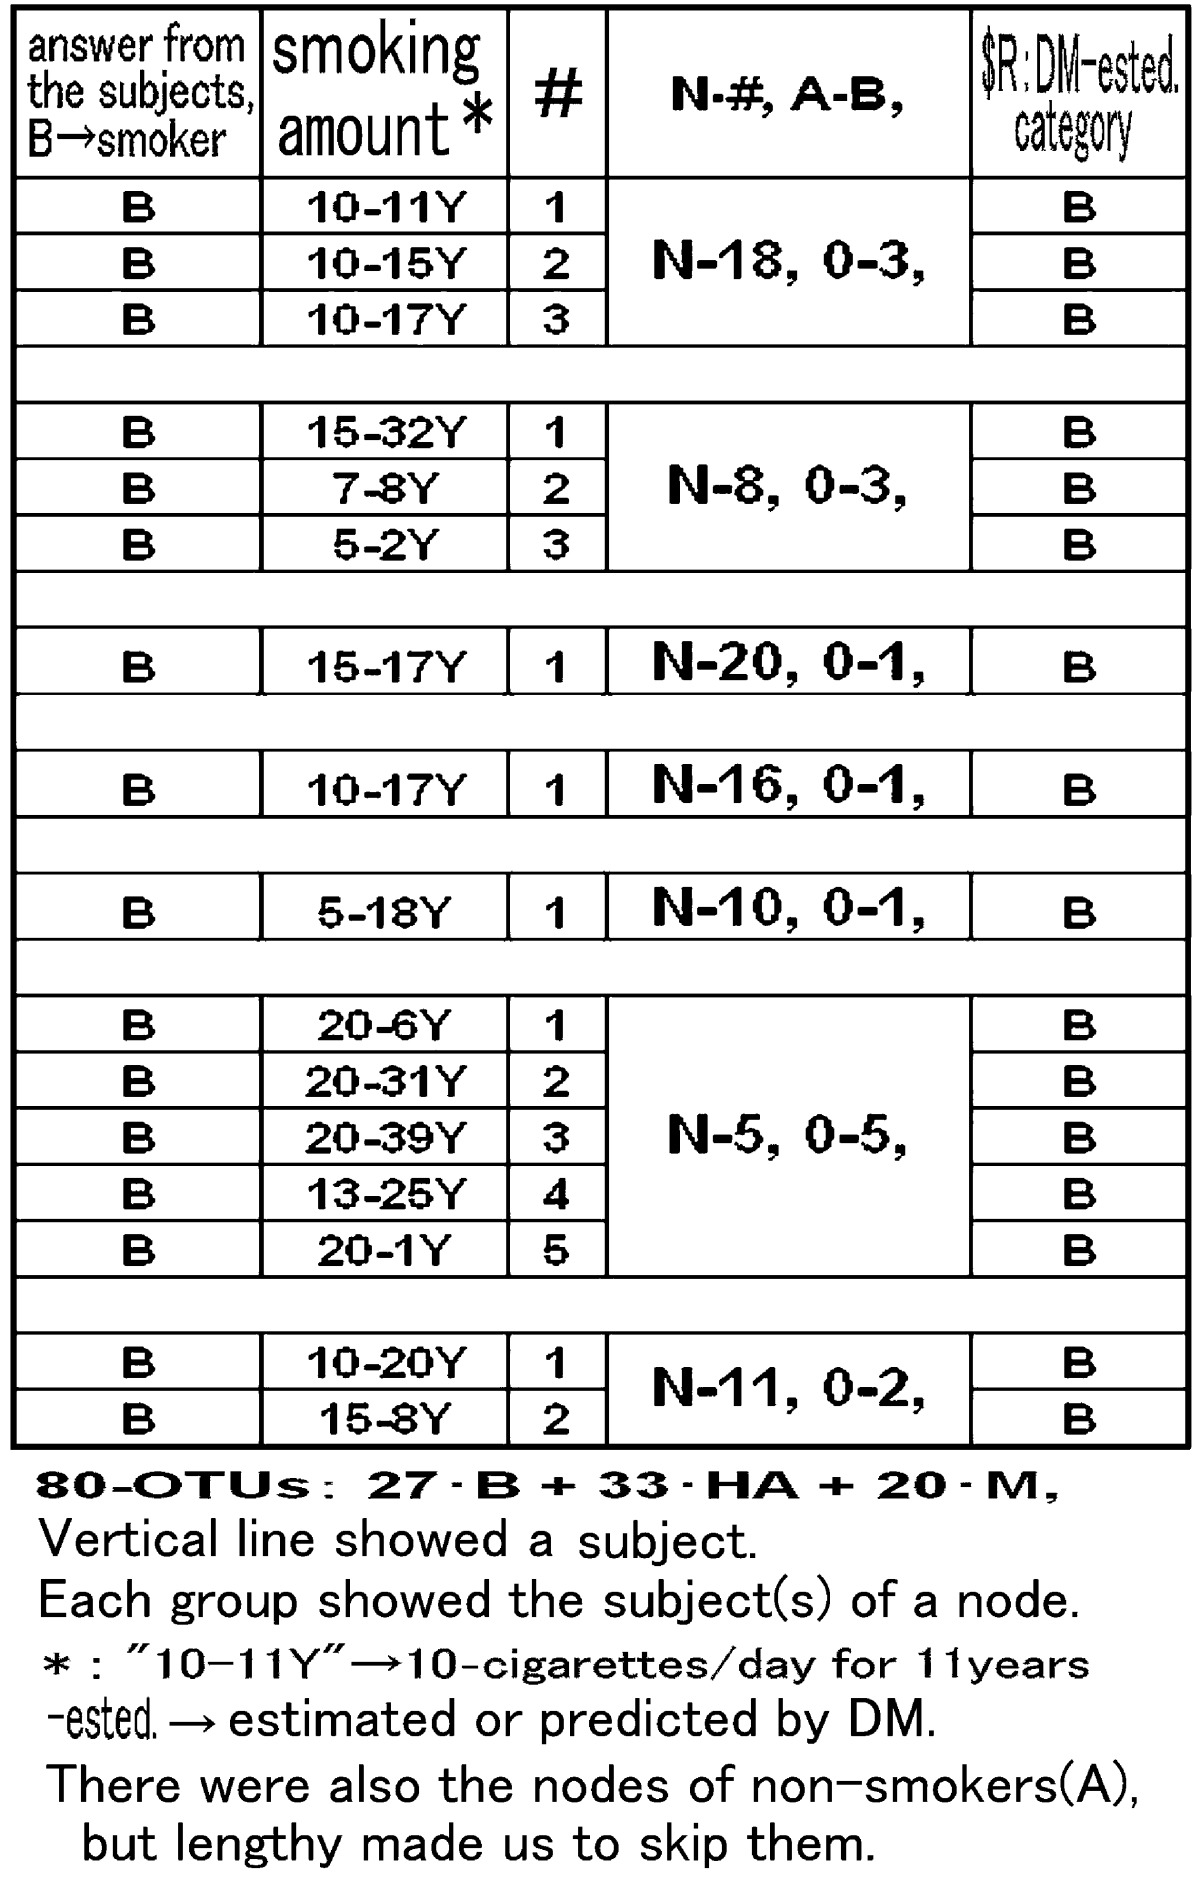
Paying attention to the nodes of smokers with arrows in Fig. 2, Table 1 showed detailed subject records for the 7 nodes, which included all 16 smokers, and compared the subjects’ answers and DM predictions. All of the subjects who were habitual smokers were explicitly identified in the 7 nodes. In addition, in N-5 at the lower part of Table 1, all 4 heavy smokers, who smoked 20 cigarettes/day, e.g., 20-6Y, were gathered together. These facts actually indicated that the selected 8 OTUs were related in some way with the amounts of smoking and that some HIM were sensitive to the habits or characteristics of the individuals.
Table 1. “Smoking Habit with 80-OTUs” comparison between the subject’s answer and the DM-analyses.

As for the pathway to reach N-5 in Fig. 2, utilization of an OTU, HA291 (HaeIII-291), twice indicated a very close relation with heavy smokers, so we traced the species of bacteria. Simple tracing of HA291 with the Microbial Community Analysis III web site and tools of Idaho University [7] revealed 1036 registered bacteria. Then by comparison of 3 other restriction enzymes, BslI, 27f-MspI and 27f-AluI with HA291, over 30,000 of bacteria species were scanned and crosschecked by accession number. Finally 28 bacteria were screened, but all were uncultured species, and some were identified as rumen bacteria and soil bacteria. However, this simplified the possibilities and indicated that not all 28 bacteria existed in the HIM of heavy smokers.
Looking closely at the lower right part of Fig. 2, we realized that there were 10 other subjects who had larger amounts of HA291. This meant that the heavy smokers in N-5 had higher intermediate amounts of HA291. The T-RFLP method contains various bacteria in an OTU, so HA291 was not a single bacterium. Then the lower right part of Fig. 2 showed some different species of bacteria.
Comparing our results with the former classification methods of HIM, the most unique point was the introduction and application of DM identification and predictive analyses. Previously, cluster analyses have been popularly applied for obtained OTUs [8, 9], but they suffered from the following 2 limitations. Namely, the first is that the cluster shows only some classified groups but did not show visible reasons for reaching the groups. Second, the obtained cluster is tightly attributable to the data, meaning that if a slight modification is made to add or subtract data, the next cluster will be very different from the previous one, i.e., each cluster lacks flexibility. On the other hand, according to the Dt, DM showed clear reasons for the tree construction, so sequential rolls of selected OTUs and simple utilization of them were quantitatively comprehensible. Moreover, once the structure of the Dt was constructed, as long as the basic concepts of the data were active, all of the following new records could be run on the same Dt. Only with the OTUs data and without the smoking status, the similar identifications are able to build the next feature or attribution of records, which means prediction. Namely, the Dt shown in Fig. 2, is able to classify new data for men and predict who smokes or not.
The main difference between DM and cluster analyses is in how data noise is handled. DM skips noise for a characteristic, e.g., smoking habit, and selects a series of related fields (OTUs); on the other hand, cluster processing respects all data without consideration of any numerical noise.
So, the HIM is known to be individually very different, sensitive and sustainable for long period of time, and will be a source or reservoir of health information that can be evaluated by the application of DM processing.
Footnotes
decision tree: decision supporting pathway that makes use of a treelike graph
terminal node: tree nodes that do not split further
REFERENCES
- 1.Jin J, Toyama M, Kibe R, Tanaka Y, Benno Y, Kobayashi T, Shimakawa M, Maruo T, Toda T, Matsuda I, Tagami H, Matsumoto M, Seo G, Sato N, Chounan O, Benno Y. Analysis of the human intestinal microbiota from 92 volunteers after ingestion of identical meals. Benef Microbes 4: 187–193 [DOI] [PubMed] [Google Scholar]
- 2.Sato T, Sato M, Matsuyama J, Kalfas S, Sundqvist G, Hoshino E. 1998. Restriction fragment length polymorphism analysis of 16S rDNA from oral asaccharolytic Eubacterium species amplified by polymerase chain reaction. Oral Microbiol Immunol 13: 23–29 [DOI] [PubMed] [Google Scholar]
- 3.Matsuki T, Watanabe K, Fujimoto J, Kado Y, Takada T, Matsumoto K, Tanaka R. 2004. Quantitative PCR with 16S rRNA-gene-targeted species-specific primers for analysis of human intestinal bifidobacteria. Appl Environ Microbiol 70: 167–173 [DOI] [PMC free article] [PubMed] [Google Scholar]
- 4.Nagashima K, Hisada T, Sato M, Mochizuki J. 2003. Application of new primer-enzyme combinations to terminal restriction fragment length polymorphism profiling of bacterial populations in human feces. Appl Environ Microbiol 69: 1251–1262 [DOI] [PMC free article] [PubMed] [Google Scholar]
- 5.Nagashima K, Mochizuki J, Hisada T, Suzuki S, Shimomura K. 2006. Phylogenetic analysis of 16S ribosomal RNA gene sequences from human fecal microbiota and improved utility of terminal restriction fragment length polymorphism profiling. Biosci Microflora 25: 99–107 [Google Scholar]
- 6.Matsumoto M, Sakamoto M, Benno Y. 2009. Dynamics of fecal microbiota in hospitalized elderly fed probiotic LKM512 yogurt. Microbiol Immunol 53: 421–432 [DOI] [PubMed] [Google Scholar]
- 7. http://mica.ibest.uidaho.edu/pat.php
- 8.Sekirov I, Russell SL, Antunes LC, Finlay BB. 2010. Gut microbiota in health and disease. Physiol Rev 90: 859–904 [DOI] [PubMed] [Google Scholar]
- 9.Santacruz A, Collado MC, GarciaValdes L, Segura MT, MartinLagos JA, Anjos T, MartiRomero M, Lopez RM, Florido J, Campoy C, San Y. 2010. Gut microbiota composition is associated with body weight, weight gain and biochemical parameters in pregnant women. Br J Nutr 104: 83–92 [DOI] [PubMed] [Google Scholar]


