

Abstract
Background: Psychopathy is a personality disorder associated with impairments in decision‐making, empathy, and impulsivity. Recent brain imaging studies suggest that psychopathy is associated with abnormalities in limbic/paralimbic brain regions. To date, no studies have examined functional brain connectivity measures using independent component analyses (ICA) in adults with psychopathy. Here, we test hypotheses regarding paralimbic connectivity in adult incarcerated individuals stratified by psychopathy scores. Methods: One hundred and two prison inmates were rated using the Hare Psychopathy Checklist‐Revised (PCL‐R). FMRI data were collected while subjects performed an auditory target detection “oddball” task. FMRI data were analyzed using group ICA to identify functional networks responding to the oddball task correlating with psychopathy scores. Results: Components demonstrating significant correlations with psychopathy included a default mode network, a frontoparietal component, and a visual/posterior cingulate component. Modulation trends correlated strongly with factor 2 (impulsivity) and total PCL‐R scores in the frontoparietal and visual/posterior cingulate networks, and with factor 1 (affective) scores within the default mode network. The posterior cingulate region factored significantly in the modulation trends observed. Conclusion: Consistent with the hypothesis of limbic/paralimbic abnormalities associated with psychopathy, modulation trends correlated strongly with PCL‐R scores. There is strong evidence to implicate the posterior cingulate in aberrant functional connectivity associated with the manifestation of psychopathic symptoms. Future investigations comparing functional trends associated with the posterior cingulate in psychopathic subjects may provide further insight into the manifestation of this disorder. Hum Brain Mapp, 2013. © 2012 Wiley Periodicals Inc.
Keywords: psychopathy, criminal, auditory oddball, fMRI, independent component analysis, functional connectivity, limbic, paralimbic, posterior cingulate
INTRODUCTION
Psychopathy is a personality disorder that affects ∼1% of the general population, but about 20% of the prison population [Hare,2003]. Psychopathy manifests itself through a variety of symptoms, from aggressive narcissism and lack of guilt and remorse to severe patterns of irresponsibility, lifelong delinquency, prolific substance abuse, and socially deviant lifestyles. Diagnosis is currently based upon a thorough review of these symptoms that meet a scaled, diagnostic threshold based on the Hare Psychopathy Checklist‐Revised (PCL‐R) [Hare,1991,2003].
It is widely known that psychopathy is difficult to treat and that the afflicted are at high risk for resuming criminal behavior following release from prison. Given the currently limited options for treatment, there is increasing research into the neurological models of psychopathy. The symptoms that are exhibited in psychopathy may be associated with a disruption in the communication between brain regions, resulting in the diversity of symptoms that present.
Previous studies suggest that individuals who exhibit psychopathic symptoms may differ in affective and cognitive function from healthy populations [Kiehl et al.,1999,2004]. There have been noted affective/cognitive differences observed within the limbic and paralimbic structures in individuals with psychopathy [Kiehl,2006; Kiehl et al.,2001]. These regions include amygdala, hippocampus, and adjacent parahippocampal regions, anterior and posterior cingulate, parahippocampal gyrus, insula, temporal pole, and orbital frontal cortex (see Fig. 1; Kiehl,2006; and Fig. 1, Anderson and Kiehl, in press]. The limbic network, in particular, has been implicated with the existence of psychopathic behaviors [Bechara et al.,1999; Patrick,1994; Patrick et al.,1993; Tranel and Damasio,1994]. However, large‐scale investigations into the neural correlates within these structures in criminal psychopaths have been limited.
Figure 1.
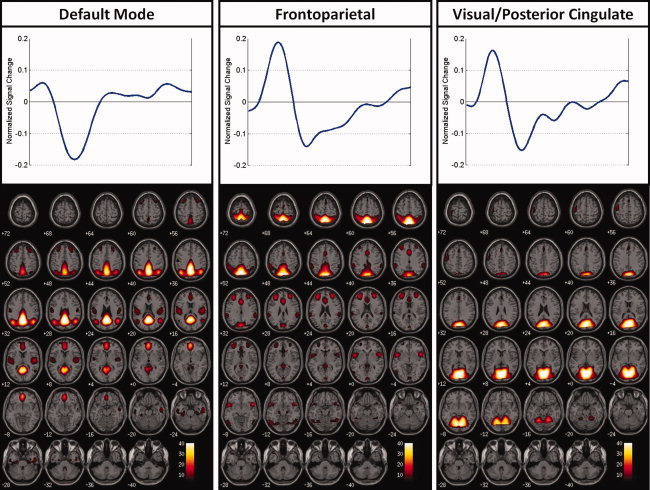
Regions of auditory oddball modulation shown with their associated time courses.
Functional connectivity is defined as the study of the correlations between neuronal activations between spatially remote regions within the brain [Friston,1994]. Advances in applied functional neuroimaging techniques have been shown to quantify functional connections between regions [Calhoun et al.,2001a; McIntosh,1999]. The application of group independent component analysis (ICA) to fMRI data has been used in order to identify spatially distinct and temporally coherent components of brain activity [Calhoun et al.,2001a]. When applied in conjunction with a specific task, ICA provides a measure of both functional connectivity and task‐relatedness. This allows for the identification of brain networks involving multiple brain regions as well as the ability to test for which networks may be implicated by the psychopathology being investigated [Erhardt et al.,2010].
The purpose of this investigation was to document the manner in which functional networks are affected by psychopathy and how the hemodynamic responses occurring within these networks correlate with psychopathic symptoms. Based on prior studies on psychopathy in prison inmates, we hypothesized that we would find evidence of aberrant connectivity within the limbic/paralimbic brain network [Kiehl,2006]. We also hypothesized significant correlations with psychopathy‐induced symptoms and differences in connectivity between inmates who have low PCL‐R scores and those who score high on the PCL‐R scale.
We implemented group ICA to study the collected fMRI data from a large group of inmates serving time in a North American medium‐security prison. We present results collected with the Mind Research Network's Mobile MRI System from 102 prisoners, each of whom performed an auditory oddball task. The auditory oddball task was selected for these analyses, because prior research has shown that abnormal brain electrical responses are observed in individuals with psychopathy during this task [Kiehl et al.,2006].
METHODS
Participants
Blood oxygenation level‐dependent fMRI data were collected from a total of 102 prison inmates. Participants were recruited from North American prison populations and scanned remotely at the prison site using the MRN Mobile MRI System (http://www.mrn.org/mobile-mri-scanning-facility/index.php).
Participants underwent a clinical interview and extensive collateral institutional file review to determine their level of psychopathy. Diagnoses were based on the PCL‐R [Hare,1991]. The PCL‐R is an expert rating scale used to assess the type and degree of severity of psychopathy within an individual. This scale contains 20 items, each of which is scored on a three‐point scale. These 20 items are divided into two groups or “factors,” each factor being further subdivided into two “facets” each [Hare,2003]. The PCL‐R total score provides information on the severity of psychopathy within an individual. Those with a total PCL‐R score of 30 or greater qualify for a diagnosis of psychopathy.
The individual factor scores provide insight into the different components of psychopathy. Factor 1 scores correspond to affective/interpersonal characteristics, whereas factor 2 scores correspond to antisocial characteristics and criminality associated with impulsive violence and socially deviant lifestyles. A complete listing of the 20 items and their breakdown in the PCL‐R are given in Table I.
Table I.
PCL‐R list items broken down by factor
| Factor 1: Personality “Aggressive narcissism” |
| Glibness/superficial charm |
| Grandiose sense of self‐worth |
| Pathological lying |
| Cunning/manipulative |
| Lack of remorse or guilt |
| Emotionally shallow |
| Callous/lack of empathy |
| Failure to accept responsibility for own actions |
| Traits not correlated with either factor |
| Many short‐term marital relationships |
| Criminal versatility |
| Factor 2: Impulsivity/Socially deviant lifestyle |
| Need for stimulation/proneness to boredom |
| Parasitic lifestyle |
| Poor behavioral control |
| Promiscuous sexual behavior |
| Lack of realistic, long‐term goals |
| Impulsiveness |
| Irresponsibility |
| Juvenile delinquency |
| Early behavioral problems |
| Revocation of conditional release |
Measures of the degree of severity of psychopathy symptoms were obtained using the PCL‐R list. There are different views on whether psychopathy should be treated as a continuous or a categorical variable. In this work, we perform both continuous and categorical analyses. For the continuous analysis, a correlation of the fMRI data with the psychopathy measures was performed. For the categorical analysis, we made the assumption that subjects with a PCL‐R total score of 20 or less (low scorers) could be comparably classified as “incarcerated control” subjects for this study, whereas those with a total PCL‐R score of 30 or greater (high scorers), we classified as psychopathy subjects. The low‐scoring PCL‐R group consisted of 48 subjects; the mid‐scoring PCL‐R group consisted of 37 subjects; and the high‐scoring PCL‐R group consisted of 17 subjects. Participants ranged in age from 18 to 61 years of age, with an average age of 34.6 years (standard deviation = 10 years), and had an average IQ of 96.7 (standard deviation = 15.1). All subjects were untreated by medication for at least a month before the scan. Substance use/abuse data were also collected for all study participants. Subjects were rated for the substance use/abuse of nine different types of substances (alcohol, sedative‐hypnotic‐anxiolytic, cannabis, stimulants, opioid, cocaine, hallucinogen/PCP, poly‐drug, and other substances) in their entire life history and for the month before the scan and designated a severity value as follows: “0” for no diagnosis of use/abuse, “1” for basic abuse of a substance/s, and “2” for actual substance dependency, the rating with the highest severity. We verified that almost all subjects had not used/abused any controlled substances for at least a month before the scan (only one subject appeared to have been dependent upon some controlled substances during the month before the scan even though all participants were incarcerated). To better visualize how these subjects compared in their abuse of substances, we summed the values for abuse severity for each participant to reach a total substance abuse severity score. The average substance use/abuse severity for all subjects was 5.2 (standard deviation = 3.2). Also, any subjects who were found unable to correctly perform the task during practice were excluded from participating in the study. All subjects were completely fluent in English. A breakdown of the demographic and clinical data is provided in Table II.
Table II.
Subject demographics and PCL‐R scores
| Age | IQ | Substance abuse | Factor 1 | Factor 2 | Total PCL‐R | |
|---|---|---|---|---|---|---|
| Mean (all subjects) | 34.6 | 96.7 | 5.2 | 6.7 | 12.7 | 21.6 |
| StDev | 10.0 | 15.1 | 3.2 | 3.4 | 4.1 | 7.1 |
| Mean (total PCL‐R ≤ 20) | 35.8 | 96.0 | 5.0 | 4.5 | 9.6 | 15.6 |
| StDev | 10.4 | 15.8 | 3.5 | 2.4 | 3.3 | 3.9 |
| Mean (20 < total PCL‐R < 30) | −34.3 | 94.5 | 5.4 | 7.3 | 14.7 | 24.5 |
| StDev | 9.9 | 14.4 | 3.1 | 2.4 | 2.2 | 2.4 |
| Mean (total PCL‐R ≥ 30) | 32.1 | 103.2 | 5.2 | 11.3 | 17.2 | 32.5 |
| StDev | 8.8 | 13.6 | 3.0 | 2.1 | 1.9 | 2.5 |
Task
This task implemented an event‐related auditory oddball paradigm in which the auditory stimuli were presented to each participant over the course of two runs while undergoing the fMRI scan [Kiehl et al.,2005]. Wearing headphones to shield from the noise of the scanner, each participant was presented with a series of pseudorandom auditory stimuli (tones). Participants were asked to respond only to target stimuli by pressing a single button of the LumiTouch Reply System [Chang et al.,2001], while ignoring (no button press) the standard tones and novel, computer‐generated tones. During a test scan, the volume was calibrated to ensure that all test subjects were able to hear the tones comfortably over the background noise of the actual scanner.
The auditory stimuli consisted of standard, target, and novel tones. In the auditory oddball paradigm, the standard stimuli were presented more frequently (P ≈ 0.80) at a pitch of 1 kHz. The target and novel stimuli were presented more infrequently (P ≈ 0.10). The target stimuli tones were presented at a different pitch from the standard tones (1.5 kHz), whereas the novel stimuli were complex, computer‐generated sounds that varied in pitch during a single presentation. Tones were presented in pseudorandom order, each stimulus lasting 200 ms. Because of the pseudorandom order in which they were presented, the interstimulus interval between tones ranged from 500 to 2,100 ms each time. In this study, there were a total of two sessions per subject. There were two runs of the paradigm during each scanning session, each run consisting of the same number of stimuli (∼100). To ensure that hemodynamic responses were not induced by the type of stimuli presented, the target and novel presentation sequences were exchanged between runs in this study to balance their presentation. Before execution of the task in the scanner, all subjects practiced performing this task to ensure capability in completing it correctly. Participants unable to perform the task correctly were excluded from the study.
Imaging Parameters
Functional data were acquired at the remote site with EPI sequences on a Mobile Siemens Avanto 1.5 Tesla (T) MR scanner with advanced SQ gradient engine. The imaging sequence parameters are as follows: TR = 2,000 ms, TE = 29 ms, FA = 65°, FOV = 24 × 24 cm, 64 × 64 matrix, 3.4 × 3.4 mm in plane resolution, slice thickness = 5 mm, and 27 slices. This sequence covers the entire brain (150 mm) in 1.5 sec.
Data Analysis
Preprocessing
FMRI data were preprocessed using the SPM5 software package. Images were motion‐corrected using INRIalign—an algorithm unbiased by local signal changes [Freire and Mangin,2001; Freire et al.,2002]. Data were spatially normalized into the standard Montreal Neurological Institute space [Friston,1995] and resampled into 3 × 3 × 3 mm, resulting in 53 × 63 × 46 voxels. Next, the data were spatially smoothed with a 10 × 10 × 10 mm full width at half‐maximum Gaussian kernel. The resulting coordinates were converted to the Talairach and Tournoux standard space to assist with anatomical labeling [Talairach and Tournoux,1988]. However, all (x,y,z) coordinates listed in the manuscript are in Montreal Neurological Institute (MNI), the default coordinate system in SPM.
Independent Component Analysis
Following the SPM5 preprocessing, a group independent component analysis (ICA) was performed on the preprocessed data [Calhoun et al.,2001b]. The methods prescribed by these processes were organized in batch scripts and performed via the group ICA of fMRI (GIFT) MATLAB toolbox version 1.3c (http://icatb.sourceforge.net). FMRI time series data for all participants were first compressed through principal component analysis (PCA). There were two PCA data reduction stages, each with a dimensionality of 25, which helped to reduce the impact of noise as well as to make the estimation computationally tractable [Calhoun et al.,2001b,2009; Schmithorst and Holland,2004]. The dimensionality/number of components was determined using the modified minimum description length criteria tool built into GIFT [Li et al.,2007). The data reduction was followed by a group spatial ICA, performed on the participants' aggregate data, resulting in the final estimation of our independent components [ICs; Calhoun et al.,2001c; Erhardt, in press]. The algorithm used in this process was the infomax algorithm, which attempts to minimize the mutual information of network outputs [Bellemann et al.,1995].
From the group spatial ICA, we reconstructed spatial maps and their corresponding ICA time courses that represented both the spatial and temporal characteristics of each component, subject, and session [Erhardt et al.,2010]. In all, this resulted in 5,100 IC spatial maps (102 subjects × 2 sessions × 25 ICs), each with an associated ICA time course of the data. These maps and time courses were then subjected to a second‐level analysis to determine whether the resultant components were task‐related as well as to determine which components reflected plausible nonartifact networks.
Statistical analysis of spatial components
We averaged the spatial maps produced during the spatial ICA across the two sessions. The spatial maps were converted to z‐score maps and then entered into a second‐level one‐sample t‐test to identify voxels that contributed significantly to a given component for the group [Calhoun et al.,2001b]. Next, these components were analyzed statistically and compared to group‐specific thresholds to observe trends in task modulation among the subjects.
Statistical analysis of ICA time courses
We performed a temporal sorting of the ICA time courses using an SPM5 design matrix containing three regressors corresponding to the three auditory oddball stimuli (standards, targets, and novels). Temporal sorting is a method by which we compare the model's time course with the ICA time course. Using a multiple linear regression sorting criteria, the concatenated ICA time courses were fit to the model time course. This resulted in a set of beta weights for each regressor associated with a particular subject and IC. The value of the resulting beta weight indicates the degree to which the component was modulated by the task. We also calculated the event‐related averages of the time courses for all components. Each plot of the event‐related average depicts the level of task‐related functional activity for that particular component over the course of the experimental period.
Statistical Analyses
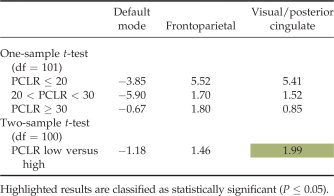
For each IC in this study, we performed a number of statistical analyses on the beta weights resulting from the ICA. These analyses included calculating the mean and standard deviation of the beta weights, one and two‐sample t‐tests on the beta weights, and a correlation of the beta weights with intake demographic data (age, IQ, and substance abuse severity) and with all PCL‐R scores (factor 1, factor 2, and total). The mean and standard deviation for task modulation of the hemodynamic response were calculated for the entire set of subjects and for the score‐related subject subgroups. Next, one and two‐sample t‐tests were performed on the beta values obtained for each component to identify significant differences in modulation within and among the various participant groups. The one‐sample t‐tests (one degree of freedom) provided information on the degree and direction of the task modulation for each subject group within particular brain regions, whereas the two‐sample t‐tests (two degrees of freedom) compared the differences in modulation between the low‐scoring PCL‐R group and the high‐scoring PCL‐R group. The two‐sample t‐tests allowed us the opportunity to compare differences in the degree to which certain brain regions exhibited a hemodynamic response to this task.
The final step in the analysis of the fMRI data collected was to identify any significant correlations of the beta weights with age, IQ, substance abuse severity, and with each of the series of PCL‐R scores (factor 1, factor 2, and total). We also examined the intake data to see if any of these data factors correlated significantly with each other, thus potentially affecting the statistical results using the fMRI data. To accomplish this, we conducted Pearson correlations for the entire set of participants. These comparisons were thresholded and corrected for multiple comparisons based on the false discovery rate (FDR) [Genovese et al.,2002].
RESULTS
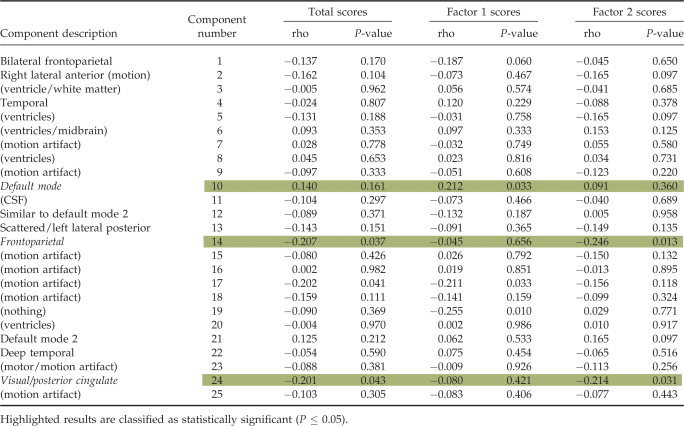
We performed a full statistical analysis on the group ICA results. Twenty‐five ICs were estimated through group ICA. We first eliminated 15 components that were related to motion artifacts or correlated with spatial maps for white matter, cerebral spinal fluid, or the ventricular system [Stevens et al.,2007]. Next, we tested the remaining components for differences in task modulation between low and high‐scoring participants and for significant correlations of the associated target beta weights with psychopathy symptom scores. Please see the Appendix Table A1 for a listing and description of all 25 components along with the results of the correlations of their respective target beta weights with psychopathy symptom scores. Three components met the criteria for statistically significant associations with psychopathy symptom scores (P ≤ 0.05). The ICs and their respective component numbers are a default mode component (10), a frontoparietal component (14), and a visual/posterior cingulate component (24; see Fig. 1). Table III contains the list of MNI coordinates with descriptions of the associated brain regions for the chosen components. A summary of the results is provided in the next section.
Table III.
MNI coordinates for the selected components
| Area | Brodmann area | R/L volume (cc) | R/L random effects: max value (x, y, z) |
|---|---|---|---|
| Default mode | |||
| Precuneus | 7, 18, 19, 23, 31, 39 | 30.6/28.0 | 51.5 (0, −60, 31)/51.1 (3, −57, 30) |
| Cingulate gyrus | 23, 24, 31 | 13.4/10.8 | 49.6 (−3, −45, 33)/50.5 (3, −60, 28) |
| Medial frontal gyrus | 6, 9, 10, 11 | 9.7/10.0 | 27.4 (−3, 49, −8)/27.3 (3, 49, −8) |
| Superior temporal gyrus | 13, 22, 39, 41, 42 | 8.6/4.5 | 23.6 (−48, −57, 28)/18.7 (48, −60, 28) |
| Middle temporal gyrus | 19, 20, 21, 39 | 7.7/6.5 | 23.9 (−50, −60, 28)/21.5 (45, −63, 28) |
| Posterior cingulate | 23, 29, 30, 31 | 7.6/8.3 | 44.7 (−9, −48, 22)/49.6 (6, −51, 25) |
| Anterior cingulate | 10, 24, 32 | 7.0/6.7 | 26.9 (−3, 46, −5)/27.3 (3, 46, −5) |
| Frontoparietal | |||
| Precuneus | 7, 19, 31 | 25.5/24.3 | 48.8 (−9, −70, 50)/50.3 (6, −61, 56) |
| Cingulate gyrus | 23, 24, 31, 32 | 12.4/7.4 | 17.3 (0, 19, 32)/16.1 (3, 22, 27) |
| Inferior parietal lobule | 7, 40 | 9.5/13.4 | 11.7 (−45, −47, 55)/18.0 (45, −44, 55) |
| Superior frontal gyrus | 6, 9, 10, 11 | 9.2/10.4 | 18.5 (−33, 47, 17)/18.6 (33, 45, 17) |
| Middle frontal gyrus | 6, 9, 10, 11, 46 | 8.2/10.5 | 18.9 (−33, 45, 20)/18.9 (30, 45, 20) |
| Superior temporal gyrus | 22, 38, 42 | 7.4/8.7 | 20.6 (−50, 14, −8)/18.5 (53, 9, −3) |
| Superior parietal lobule | 5, 7 | 6.9/7.0 | 51.7 (−3, −64, 56)/52.5 (6, −64, 53) |
| Visual/posterior cingulate | |||
| Cuneus | 7, 17, 18, 19, 23, 30 | 15.6/17.0 | 54.3 (−9, −69, 12)/52.2 (6, −72, 9) |
| Precuneus | 7, 19, 23, 31 | 14.3/10.6 | 47.1 (0, −72, 23)/42.6 (3, −72, 26) |
| Middle occipital gyrus | 18, 19 | 10.8/9.9 | 35.1 (−12, −87, 15)/28.8 (18, −87, 15) |
| Lingual gyrus | 17, 18, 19 | 10.4/10.0 | 48.9 (−12, −67, 1)/49.2 (6, −73, 4) |
| Culmen | * | 8.3/8.2 | 39.7 (−9, −61, −2)/41.3 (6, −67, −2) |
| Posterior cingulate | 23, 29, 30, 31 | 7.4/6.7 | 51.7 (−9, −66, 14)/50.5 (6, −69, 12) |
| Parahippocampal gyrus | 19, 27, 30, 35, 36, 37 | 5.1/3.5 | 36.0 (−18, −56, −5)/31.4 (21, −56, −5) |
Behavioral Results
Only subjects who were capable of correctly performing the task were included in this study. Participants had an average reaction time of 507 ms in response to target stimuli, with a standard deviation of 107 ms (Table IV).
Table IV.
Results from the one and two‐sample t‐tests performed on the target beta weights, broken down by PCL‐R subject group
|
Correlations With Demographic Data and With PCL‐R Scores
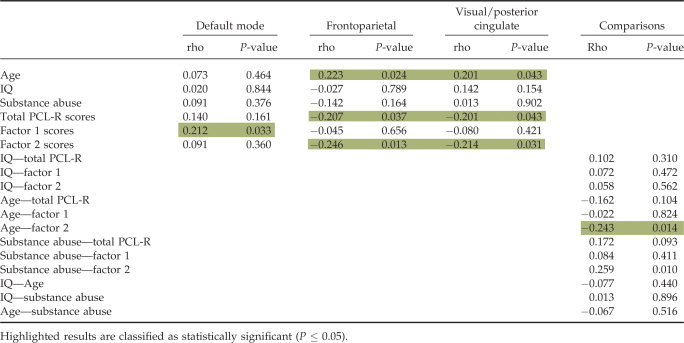
We calculated Pearson correlations of the target beta weights with the following intake data: age, IQ, substance abuse severity, and with all PCL‐R scores (factor 1, factor 2, and total). The purpose of this was to see if we could reveal significant correlations of the modulation trends with any of the PCL‐R symptom factors and/or overall total PCL‐R symptoms, and if any of those results could be moderated by any of the other intake parameters (age, IQ, and substance abuse). Calculations revealed significant (P ≤ 0.05, FDR corrected) negative correlations of the frontoparietal and medial visual component target regressor beta weights with the factor 2 and total PCL‐R scores. We also observed a significant positive correlation of the default mode component and target regressor beta weights with factor 1 scores. Correlations of the intake data parameters with each other revealed a significant negative correlation of age with factor 2 scores as well as a significant positive correlation of substance abuse severity with factor 2 scores. Results of these correlations are provided in Table V.
Table V.
Correlation results of the beta weights with age, IQ, substance abuse severity, and all PCL‐R scores (total, factor 1, and factor 2) as well as correlation results of intake data with each other
|
DISCUSSION
Consistent with our hypotheses, analyses revealed several brain networks (components) that included limbic and paralimbic regions that exhibited task‐related modulation induced by the target stimuli in the auditory oddball task in the prison inmates. Modulation within these networks correlated strongly with psychopathy symptoms and showed differences in connectivity between low and high‐scoring subjects. These observations are consistent with previous results implicating the limbic/paralimbic networks in psychopathy [Kiehl,2006; Kiehl et al.,2001; Laurens et al.,2005].
Default Mode
The default mode network has been associated with the internal monitoring of functional activity and cognitive processing within the brain, for which the anterior and posterior cingulate are key contributors [Greicius et al.,2003]. Within the default mode component, correlations of the beta weights from all subjects with factor 1 PCL‐R scores were significant. For this particular component, the cingulate gyrus and the posterior cingulate, which are regions associated with the limbic network, were significantly associated with this region, along with the precuneus, medial frontal gyrus, superior temporal gyrus, middle temporal gyrus, and anterior cingulate. The cingulate gyrus has been identified as an integral member of the limbic system [Clark et al.,2005] and has been implicated in the cognitive and attentional processing of the brain [Maddock and Buonocore,1997; Mesulam,1999]. The posterior cingulate has also been implicated in the mediation of emotional and memory‐related processes [Maddock et al.,2003]. Its significance in the adaptive reflexive processing of external stimuli has been demonstrated through the observation of the associated hemodynamic response to an auditory oddball task [Kiehl et al.,2005]. Observations of the behavioral and cognitive changes associated with psychopathy have also implicated abnormalities within the posterior cingulate, which is a member of the paralimbic network [Kiehl,2006; Kiehl et al.,2001].
The frontal regions associated with this circuit included the anterior cingulate, which has been shown to be abnormal in psychopathy in fMRI studies [Kiehl et al.,2001,2004]. Also, lesions of the anterior cingulate produce impairments in response inhibition and behavioral disregulation [Degos et al.,1993; Hornak et al.,2003; Mesulam,2000; Tekin and Cummings,2002]. It has been suggested that decreased functional activity within the limbic prefrontal circuit, which includes the anterior cingulate, is associated with psychopathic behavioral characteristics [Veit et al.,2002]. Furthermore, criminal psychopaths demonstrated no significant hemodynamic activity within the limbic prefrontal circuit in response to a fear conditioning paradigm, suggesting a dissociation in emotional and cognitive processing in the condition [Birbaumer et al.,2005]. Our results suggest that abnormalities in functional connectivity in the anterior and posterior cingulate may contribute to deficits in the internal monitoring of cognitive and attentional processes of the brain, which appear to be more strongly linked to the interpersonal and affective symptoms (factor 1) of psychopathy.
Frontoparietal
Correlations of factor 2 and total PCL‐R scores with target beta weights for all subjects revealed significant associations in the frontoparietal component (see Fig. 1). Target beta weights also correlated significantly with age for all subjects. Evidence from auditory oddball fMRI studies on the functional characteristics of attentional processing has demonstrated target‐related modulation trends associated with the frontoparietal brain region [Fichtenholtz et al.,2004; Strobel et al.,2008]. Furthermore, it has been suggested that frontoparietal cortex functionality is associated with the allocation of attentional processes to emotional stimuli [Bentley et al.,2003]. It has been observed that abnormalities in the corticolimbic circuits of the brain, with particular emphasis on the frontoparietal regions, are linked to an increased prevalence in impulsive/reactive aggression [Coccaro et al.,2011]. Factor 2 of psychopathy was more strongly linked to this frontoparietal circuit than factor 1, suggesting that the frontoparietal circuit observed here is more strongly linked to the impulsive dimension of psychopathy than to the affective dimension.
Medial Visual
Correlations between total and factor 2 PCL‐R scores with target beta weights for all subjects revealed significant associations with the medial visual component. Target beta weights also correlated significantly with age for all subjects. The medial visual component includes multiple regions of the visual, parietal, and limbic cortex. We note that limbic contribution to this component was relatively limited and only included tiny aspects of the parahippocampal complex and anterior and posterior cingulate. The paralimbic dysfunction model [Kiehl,2006], as well most other models of psychopathy, does not predict abnormalities in the visual or parietal lobe in psychopathy. Thus, it is unclear how the visual and parietal aspects of this component map onto existing theories of psychopathy.
In a recent study on the aggressive behavior of criminal psychopaths inflicting punishment during a retaliation task, aberrant activity was observed within the posterior cingulate in subjects punished more severely [Veit et al.,2010]. Some of the key behavioral characteristics associated with factor 2 PCL‐R scores are poor behavioral controls and impulsivity. Thus, to the extent that this medial visual component reflects aberrant posterior cingulate connectivity, our results are consistent with the prior work.
Limitations of the Present Study
The purpose of the present study was to test the hypotheses that psychopathy was associated with aberrant functional connectivity in the paralimbic system using ICA [Kiehl,2006]. Consistent with the hypotheses, we found that three ICA‐derived components that included paralimbic regions were abnormal in psychopathy. If an ICA spatial component showed a relationship to psychopathy and that component included regions of the paralimbic system, we interpreted such findings as support for the paralimbic dysfunction model of psychopathy [Kiehl,2006]. However, it must be noted that all the components included regions that also fell outside the paralimbic system. Abnormal functional connectivity between nonparalimbic regions is not predicted by the paralimbic dysfunction model of psychopathy [Kiehl,2006]. Future work such as path analyses need to be conducted in order to help elucidate the role each paralimbic may play in the larger network of brain regions observed to be implicated in psychopathy. Nevertheless, as has been found in other psychopathological conditions, we have found evidence that psychopathy is associated with impairments in functional connectivity and that these abnormalities appear to include numerous aspects of the paralimbic system.
CONCLUSION
Overall, there is strong evidence to implicate abnormal functional connectivity within the limbic and paralimbic networks in the observable manifestations of abnormal personality symptoms characteristic of psychopathy. The three networks implicated in this study demonstrated aberrant modulation trends that significantly correlated with psychopathy symptoms within the posterior cingulate region of the brain, a region that has been functionally associated with the limbic/paralimbic network. Investigations demonstrating aberrant modulation trends in distinguishable functional brain networks of psychopathic subjects using fMRI have been limited. Thus far, this is the first investigation in functional connectivity to demonstrate viable results implicating the limbic and paralimbic networks, with particular emphasis on the frontoparietal region and posterior cingulate, in the manifestation of psychopathic symptoms. Modulation trends within the default mode network correlated significantly with factor 1 symptom scores, suggesting that a possible interaction dysfunction between the anterior and posterior cingulate. The frontoparietal network appears to be most strongly linked to the behavioral/impulsive dimension (factor 2) of psychopathy. Moreover, the trends observed within the posterior cingulate region of the brain, which correlated significantly with PCL‐R total and factor 2 symptom scores, as well as with factor 1 scores within the default mode network, suggest that abnormalities within this particular region may directly contribute to the manifestation of psychopathic symptoms. The results from this study further bolster the hypotheses of limblic/paralimbic abnormalities as being a key contributor in the manifestation of psychopathy, as highlight the relevance of posterior cingulate to the condition. Future investigations into the neural correlates of the posterior cingulate and its possible dynamic interaction with both the anterior cingulate and the frontoparietal component may provide further clues to better understanding trends in the functional network connectivity of psychopathy and should prove to be promising avenue for further clarifying the origin and development of the psychopathy.
Acknowledgements
The authors thank the Mind Research Network staff for their efforts during the data collection processes. Authorship contributions: M. Juárez performed the data analyses, interpretation of results, and wrote the manuscript; K. Kiehl designed and implemented the experiment, collected the data, provided input into the interpretation, and contributed to the composition of the manuscript. V. Calhoun provided input into the data analysis and interpretation and contributed to the composition of the manuscript.
Table AI.
Correlation results of the target beta weights for all components with all PCL‐R scores (total, factor 1, factor 2)
|
REFERENCES
- Anderson N, Kiehl KA (2012): The psychopath magnetized: Insights from neuroimaging. Trends Cogn Sci 16:52–60. [DOI] [PMC free article] [PubMed] [Google Scholar]
- Bechara A, Damasio H, Damasio AR, Lee GP ( 1999): Different contributions of the human amygdala and ventromedial prefrontal cortex to decision‐making. J Neurosci 19: 5473–5481. [DOI] [PMC free article] [PubMed] [Google Scholar]
- Bellemann ME, Spitzer M, Brix G, Kammer T, Loose R, Schwartz A, Guckel F ( 1995): [Neurofunctional MRI imaging of higher cognitive performance of the human brain]. [German]. Radiologe 35: 272–282. [PubMed] [Google Scholar]
- Bentley P, Vuilleumier P, Thiel CM, Driver J, Dolan RJ ( 2003): Cholinergic enhancement modulates neural correlates of selective attention and emotional processing. NeuroImage 20: 58–70. [DOI] [PubMed] [Google Scholar]
- Birbaumer N, Veit R, Lotze M, Erb M, Hermann C, Grodd W, Flor H ( 2005): Deficient fear conditioning in psychopathy: A functional magnetic resonance imaging study. Arch Gen Psychiatry 62: 799–805. [DOI] [PubMed] [Google Scholar]
- Calhoun VD, Adali T, McGinty V, Pekar JJ, Watson T, Pearlson GD ( 2001a): fMRI activation in a visual‐perception task: Network of areas detected using the general linear model and independent component analysis. NeuroImage 14: 1080–1088. [DOI] [PubMed] [Google Scholar]
- Calhoun VD, Adali T, Pearlson GD, Pekar JJ ( 2001b): A method for making group inferences from functional MRI data using independent component analysis. Hum Brain Mapp 14: 140–151. [DOI] [PMC free article] [PubMed] [Google Scholar]
- Calhoun VD, Adali T, Pearlson GD, Pekar JJ ( 2001c): A Method for Making Group Inferences Using Independent Component Analysis of Functional MRI Data: Exploring the Visual System. p S88. [DOI] [PMC free article] [PubMed] [Google Scholar]
- Calhoun VD, Liu J, Adali T ( 2009): A review of group ICA for fMRI data and ICA for joint inference of imaging, genetic, and ERP data. NeuroImage 45: 163–172. [DOI] [PMC free article] [PubMed] [Google Scholar]
- Chang A, Resner B, Koerner B, Wang X, Ishii H ( 2001): LumiTouch: An emotional communication device. CHI 2001 Conference on Human Factors in Computing Systems. Seattle, WA: ACM; pp 313–314. [Google Scholar]
- Clark D, Boutros N, Mendez M ( 2005): Limbic system: Cingulate cortex. The Brain and Behavior, 2nd ed. United Kingdom: Cambridge University Press; pp 201–222. [Google Scholar]
- Coccaro EF, Sripada CS, Yanowitch RN, Phan KL ( 2011): Corticolimbic function in impulsive aggressive behavior. Biol Psychiatry 69: 1153–1159. [DOI] [PubMed] [Google Scholar]
- Degos JD, da Fonseca N, Gray F, Cesaro P ( 1993): Severe frontal syndrome associated with infarcts of the left anterior cingulate gyrus and the head of the right caudate nucleus. A clinico‐pathological case. Brain 116 ( Pt 6): 1541–1548. [DOI] [PubMed] [Google Scholar]
- Erhardt EB, Rachakonda S, Bedrick EJ, Allen EA, Adali T, Calhoun VD ( 2011): Comparison of multi‐subject ICA methods for analysis of fMRI data. Hum Brain Mapp 32: 2075–2095. [DOI] [PMC free article] [PubMed] [Google Scholar]
- Fichtenholtz HM, Dean HL, Dillon DG, Yamasaki H, McCarthy G, LaBar KS ( 2004): Emotion‐attention network interactions during a visual oddball task. Brain Res Cogn Brain Res 20: 67–80. [DOI] [PubMed] [Google Scholar]
- Freire L, Mangin JF ( 2001): Motion correction algorithms may create spurious brain activations in the absence of subject motion. NeuroImage 14: 709–722. [DOI] [PubMed] [Google Scholar]
- Freire L, Roche A, Mangin JF ( 2002): What is the best similarity measure for motion correction in fMRI time series? IEEE Trans Med Imag 21: 470–484. [DOI] [PubMed] [Google Scholar]
- Friston K ( 1994): Functional and effective connectivity in neuroimaging: A synthesis. Hum Brain Mapp 2: 56–78. [Google Scholar]
- Friston K ( 1995): Spatial Normalisation: A new approach. Presented at the BrainMap '95 UTHSC, San Antonio, TX.
- Genovese CR, Lazar NA, Nichols T ( 2002): Thresholding of statistical maps in functional neuroimaging using the false discovery rate. Neuroimage 15: 870–878. [DOI] [PubMed] [Google Scholar]
- Greicius MD, Krasnow B, Reiss AL, Menon V ( 2003): Functional connectivity in the resting brain: A network analysis of the default mode hypothesis. Proc Natl Acad Sci USA 100: 253–258. [DOI] [PMC free article] [PubMed] [Google Scholar]
- Hare RD ( 1991): Manual for the Hare Psychopathy Checklist‐Revised. Toronto: Multi‐Health Systems. [Google Scholar]
- Hare RD ( 2003): Manual for the Hare Psychopathy Checklist‐Revised. Toronto: Multi‐Health Systems. [Google Scholar]
- Hornak J, Bramham J, Rolls ET, Morris RG, O'Doherty J, Bullock PR, Polkey CE ( 2003): Changes in emotion after circumscribed surgical lesions of the orbitofrontal and cingulate cortices. Brain 126 ( Pt 7): 1691–712. [DOI] [PubMed] [Google Scholar]
- Kiehl KA ( 2006): A cognitive neuroscience perspective on psychopathy: Evidence for paralimbic system dysfunction. Psychiatry Res 142: 107–128. [DOI] [PMC free article] [PubMed] [Google Scholar]
- Kiehl KA, Bates AT, Laurens KR, Hare RD, Liddle PF ( 2006): Brain potentials implicate temporal lobe abnormalities in criminal psychopaths. J Abnorm Psychol 115: 443–453. [DOI] [PubMed] [Google Scholar]
- Kiehl KA, Hare RD, McDonald JJ, Brink J ( 1999): Semantic and affective processing in psychopaths: An event‐related potential (ERP) study. Psychophysiology 36: 765–774. [PubMed] [Google Scholar]
- Kiehl KA, Smith AM, Hare RD, Mendrek A, Forster BB, Brink J, Liddle PF ( 2001): Limbic abnormalities in affective processing by criminal psychopaths as revealed by functional magnetic resonance imaging. Biol Psychiatry 50: 677–684. [DOI] [PubMed] [Google Scholar]
- Kiehl KA, Smith AM, Mendrek A, Forster BB, Hare RD, Liddle PF ( 2004): Temporal lobe abnormalities in semantic processing by criminal psychopaths as revealed by functional magnetic resonance imaging. Psychiatry Res 130: 297–312. [DOI] [PubMed] [Google Scholar]
- Kiehl KA, Stevens MC, Laurens KR, Pearlson G, Calhoun VD, Liddle PF ( 2005): An adaptive reflexive processing model of neurocognitive function: Supporting evidence from a large scale (n = 100) fMRI study of an auditory oddball task. NeuroImage 25: 899–915. [DOI] [PubMed] [Google Scholar]
- Laurens KR, Kiehl KA, Liddle PF ( 2005): A supramodal limbic‐paralimbic‐neocortical network supports goal‐directed stimulus processing. Hum Brain Mapp 24: 35–49. [DOI] [PMC free article] [PubMed] [Google Scholar]
- Li Y, Adali T, Calhoun VD ( 2007): Estimating the number of independent components for fMRI data. Hum Brain Mapp 28: 1251–1266. [DOI] [PMC free article] [PubMed] [Google Scholar]
- Maddock RJ, Buonocore MH ( 1997): Activation of left posterior cingulate gyrus by the auditory presentation of threat‐related words: An fMRI study. Psychiatry Res 75: 1–14. [DOI] [PubMed] [Google Scholar]
- Maddock RJ, Garrett AS, Buonocore MH ( 2003): Posterior cingulate cortex activation by emotional words: fMRI evidence from a valence decision task. Hum Brain Mapp 18: 30–41. [DOI] [PMC free article] [PubMed] [Google Scholar]
- McIntosh AR ( 1999): Mapping cognition to the brain through neural interactions. Memory 7: 523–548. [DOI] [PubMed] [Google Scholar]
- Mesulam MM ( 1999): Spatial attention and neglect: Parietal, frontal and cingulate contributions to the mental representation and attentional targeting of salient extrapersonal events. Philos Trans R Soc Lond B Biol Sci 354: 1325–1346. [DOI] [PMC free article] [PubMed] [Google Scholar]
- Mesulam MM, editor ( 2000): Principles of Behavioral and Cognitive Neurology. New York: Oxford University Press. [Google Scholar]
- Patrick CJ ( 1994): Emotion and psychopathy: Startling new insights. Psychophysiology 31: 319–330. [DOI] [PubMed] [Google Scholar]
- Patrick CJ, Bradley MM, Lang PJ ( 1993): Emotion in the criminal psychopath: Startle reflex modulation. J Abnorm Psychol 102: 82–92. [DOI] [PubMed] [Google Scholar]
- Schmithorst VJ, Holland SK ( 2004): Comparison of three methods for generating group statistical inferences from independent component analysis of functional magnetic resonance imaging data. J Magn Reson Imaging 19: 365–368. [DOI] [PMC free article] [PubMed] [Google Scholar]
- Stevens M, Kiehl KA, Pearlson GD, Calhoun VD ( 2007): Functional neural networks underlying response inhibition in adolescents and adults. Behav Brain Sci 181: 12–22. [DOI] [PMC free article] [PubMed] [Google Scholar]
- Strobel A, Debener S, Sorger B, Peters JC, Kranczioch C, Hoechstetter K, Engel AK, Brocke B, Goebel R ( 2008): Novelty and target processing during an auditory novelty oddball: A simultaneous event‐related potential and functional magnetic resonance imaging study. NeuroImage 40: 869–883. [DOI] [PubMed] [Google Scholar]
- Talairach J, Tournoux P ( 1988): A co‐planar sterotaxic atlas of a human brain. Thieme, Stuttgart: Georg Thieme Verlag. [Google Scholar]
- Tekin S, Cummings JL ( 2002): Frontal‐subcortical neuronal circuits and clinical neuropsychiatry: An update. J Psychosom Res 53: 647–654. [DOI] [PubMed] [Google Scholar]
- Tranel D, Damasio H ( 1994): Neuroanatomical correlates of electrodermal skin conductance responses. Psychophysiology 31: 427–438. [DOI] [PubMed] [Google Scholar]
- Veit R, Flor H, Erb M, Hermann C, Lotze M, Grodd W, Birbaumer N ( 2002): Brain circuits involved in emotional learning in antisocial behavior and social phobia in humans. Neurosci Lett 328: 233–236. [DOI] [PubMed] [Google Scholar]
- Veit R, Lotze M, Sewing S, Missenhardt H, Gaber T, Birbaumer N ( 2010): Aberrant social and cerebral responding in a competitive reaction time paradigm in criminal psychopaths. NeuroImage 49: 3365–3372. [DOI] [PubMed] [Google Scholar]