

Abstract
Background
The arrangement of myofibers in the heart is highly complex and must be replicated by injected cells to produce functional myocardium. A novel approach to characterize the microstructural response of the myocardium to ischemia and cell therapy, using serial diffusion tensor MRI (DTI) tractography of the heart in vivo, is presented.
Methods and Results
Validation of the approach was performed in normal (n=6) and infarcted mice (n=6) as well as healthy human volunteers. Mice (n=12) were then injected with bone marrow mononuclear cells (BMMCs) 3 weeks after coronary ligation. In half the mice the donor and recipient strains were identical and in half the strains were different. A positive response to cell injection was defined by a decrease in mean diffusivity, an increase in fractional anisotropy, and the appearance of new myofiber tracts with the correct orientation. A positive response to BMMC injection was seen in one mouse. The response of the majority of mice to BMMC injection was neutral (9/12) or negative (2/12). The in vivo tractography findings were confirmed with histology.
Conclusions
DTI-tractography was able to directly resolve the ability of injected cells to generate new myofiber tracts and provided a fundamental readout of their regenerative capacity. A highly novel and translatable approach to assess the efficacy of cell therapy in the heart is thus presented.
Keywords: Tractography, Diffusion Tensor MRI, Myocardium, Ischemia, Cell Therapy
Myocardial regeneration remains one of the central goals of cardiovascular research.1 The myocardium, however, has a complex three-dimensional microstructure. Fibers in the subendocardium and subepicardium form an array of crossing helices, while those in the midmyocardium are circumferential.2, 3 This 3D architecture plays a crucial role in the mechanical function of the heart and is perturbed in a range of diseases including myocardial infarction and heart failure.4–7 The regeneration of functional myocardium thus requires not only the ability to generate functional cardiomyocytes (CMs), but also the ability to restore normal 3D myofiber architecture. New techniques to better characterize the microstructural impact of ischemia as well as the ability of injected cells to restore normal 3D myofiber architecture are therefore sorely needed.8
Diffusion tensor MRI (DTI) has the unique ability to resolve 3D tissue microstructure in intact organs.9, 10 In the myocardium, however, DTI is extremely challenging to perform due to the motion of the heart.11–13 Consequently, while numerous valuable studies have been performed ex vivo,4–7, 14–18 only a handful of in vivo studies have been performed.12, 13, 19–22 Moreover, these in vivo studies have been limited to 2D measures of myocardial microstructure,23 or have involved 3D tractography in healthy human volunteers.24
Here, we present the ability to perform DTI-tractography of the mouse heart in vivo. The technique is used to image mice following coronary ligation and cell injection, and is validated by comparison with ex vivo imaging and histology. To the best of our knowledge this study involves the first use of 3D-tractography to study ischemic myocardium in vivo, the first use of DTI or tractography to assess the impact of cell therapy in the heart, and the first demonstration of DTI in the mouse heart in vivo.
Methods
All procedures were performed in accordance with an approved research protocol at our institution. Additional details and a selected list of abbreviations are provided in the methods supplement.
In Vivo DTI and Tractography
A motion-compensated version of the Stejskal-Tanner diffusion sequence was implemented to perform DTI-tractography of the mouse heart in vivo.13 Rather than the monopolar gradients used in conventional brain DTI sequences, a pair of bipolar diffusion-encoding gradients was used (Figure 1A–B). Validation and testing of the approach was performed in healthy C57BL6 mice (n=6). Imaging was performed on a 9.4T horizontal bore scanner (Biospec, Bruker, Billerica MA) with a 1500 mT/m gradient insert (Resonance Research, Billerica MA).
Figure 1.

In vivo DTI of the mouse heart with motion compensated diffusion-encoding gradients. (A) Classic Stejskal-Tanner spin echo sequence with monopolar diffusion-encoding gradients on either side of the 180° refocusing pulse. (B) Motion compensated sequence with velocity-compensated bipolar diffusion-encoding gradients. A trigger delay (TD) is applied to acquire the images in midsystole. (C, D) Diffusion-encoded images of a normal mouse in vivo with (C) the uncompensated sequence and (D) the motion compensated sequence. Severe image degradation is present in the uncompensated sequence, while image quality in the motion compensated sequence is high. (E, F) DTI with the velocity compensated sequence at different phases of the cardiac cycle. Velocity compensation is inadequate at phases of the cardiac cycle with a high proportion of higher order motion coefficients (E) but works robustly in midsystole (F). (G) 2D HA map in a normal mouse in vivo. The expected transmural gradient in HA in the LV is well seen. (H) Diffusion tensor field in the LV, represented by superquadric glyphs and color-coded by HA, demonstrating that the anisotropic nature of the myocardium has been accurately resolved with in vivo DTI.
3D DTI of the heart was performed with ECG and respiratory gating (SA Instruments, Stonybrook NY) using a fat-suppressed single-shot spin echo sequence with an echoplanar imaging (EPI) readout. First order motion compensated diffusion-encoding gradients were placed on either of the 180° refocusing pulse (Figure 1B). Typical sequence parameters included: Field of view (FOV) 20×20×8mm3, matrix 70×70×28 interpolated to 128×128×51, resolution 156 µm (isotropic), repetition time (TR) 1000ms, echo time (TE) 14 ms, b-value of 500–650 s/mm2, 24 diffusion encoding directions plus one b0 (no diffusion encoding) image, 2 averages. Scan duration was approximately 35 minutes.
In each animal, 2D DTI was also performed to compute mean diffusivity (MD) and fractional anisotropy (FA) maps. Three 2D slices were acquired in the short axis from the mid left ventricle (LV) to the apex. Parameters included: FOV 20×20mm2, slice thickness 1mm, matrix 70×70 interpolated to 128×128, in-plane resolution 156×156 µm2, TR 2000ms, TE 14 ms, b-value of 500–650 s/mm2, 6 diffusion encoding directions plus one b0 image, 16 averages.
Image analysis was performed using software developed in our center. In each voxel, diagonalization of the diffusion tensor was performed to yield its eigenvectors and eigenvalues. 2D maps of MD and FA were computed as previously described.5 2D maps of fiber helix angle (HA) were created by projecting the primary eigenvector onto the radial plane of the LV.3 In addition, the diffusion tensor field was modeled using superquadric glyphs,14 where the orientation and color of the glyphs reflected HA and their shape was determined by the diffusion eigenvalues.
Tractography was performed by numerically integrating the primary eigenvector fields into coherent streamlines. To standardize the analysis only those tracts intersecting a cuboid region-of-interest (ROI), placed in the lateral wall of the mid-LV, were displayed and evaluated. The dimensions and location of the ROI were kept constant in all the mice imaged in the study. Tract length was limited to half the circumference of the LV to aid visualization. A propagation angle greater than 35° was a criterion for tract termination. The resolved tracts were color-coded by HA at each point along the tract. Histograms of tract HA were constructed by assigning a single HA value to the tract based on the HA at its midpoint. The HA range was defined by the furthest points in the histogram with an amplitude >10% of the maximum amplitude.
Diffusion Spectrum Imaging (DSI) Tractography
DSI-tractography of normal mouse hearts (n=5) was performed ex vivo. The excised hearts were immersed in a fluorocarbon magnetic susceptibility-matching medium (Fomblin, Ausimont NJ) and imaged with a 3D diffusion encoded Stejkal-Tanner sequence. The FOV (10.5–14mm2), matrix (96–128) and image parameters were adjusted in each heart to minimize N/2 ghosts and optimize signal-to-noise. Typical parameters included: spatial resolution 110 µm (isotropic), TR 700–1200ms, TE 18–20ms, b-value of 5000–10000 s/mm2, 514 diffusion-encoding directions plus one b=0 s/mm2 image, 1–2 averages.
Tractography of the DSI datasets was performed as previously described.6, 9 The size and location of the ROI used to analyze the tracts was identical to that used for the in vivo DTI data. Likewise, HA histograms of fibers passing through the ROI were derived and analyzed in an identical manner for both the DSI and DTI datasets.
In Vivo DTI-Tractography in Ischemic Injury
In vivo DTI-tractography was performed in mice with acute myocardial infarction (n=6) and ischemia-reperfusion (n=12) 24 hours after coronary ligation. In addition, ex vivo DTI-tractography was performed in a separate cohort of mice (n=6) 3 weeks after myocardial infarction. In all mice ligation of the left coronary artery was performed to injure the anterior and lateral walls of the LV. In the ischemia-reperfusion (IR) group, the ligation was released after 30 minutes.
In the acutely infarcted mice, in vivo MD maps and T2-weighted MRI were used to delineate the area-at-risk (AAR),25 and late gadolinium enhancement (LGE) was performed to assess myocardial viability. Following MRI, ex vivo measurements of the AAR and infarct size were made using fluorescent microspheres and tetrazolium-chloride (TTC). The impact of myocardial edema on DTI-tractography was assessed by serial in vivo imaging of the mice with IR 24 hours and 3 weeks after injury. At the 3-week time point the mice in the IR group entered the cell therapy arm of the study.
DTI-Tractography of Cell Therapy
The impact of cell therapy was assessed with serial in vivo imaging in two groups of mice. Group 1 (n=6) consisted of donor FVB and recipient C57BL6 mice and was designed to assess the ability of DTI-tractography to detect a potentially deleterious response. Group 2 (n=6) consisted of C57BL6 donor and C57BL6 recipient mice. In both groups, 105 bone marrow mononuclear cells (BMMCs) were harvested from the donor mice and injected directly into the myocardium of the recipient mice 3 weeks after IR.
The BMMCs were isolated from the femurs of the donor mice. The marrow was flushed with sterile saline and passed through a 70 µm filter to remove debris. The filtrate was centrifuged at 1600 rpm for 10 minutes and the pellet was suspended in alpha-MEM with 20% fetal bovine serum. The concentration of BMMCs was counted manually with a hemocytometer and 105 BMMCs were resuspended in 12 µl of alpha-MEM with 20% bovine serum and 10% matrigel. The cells were maintained on ice and then injected in two passes (6 µl each) into the anterolateral wall of the LV at the border of the normal and injured myocardium.
The recipient mice (C57BL6, 3 weeks post-IR, n=12) were imaged with in vivo DTI-tractography one day before injection and then on days 3, 7 and 10 after BMMC injection. The mice were then euthanized and the hearts were fixed, sectioned in their short axis in 8µm thick sections and stained with Masson’s Trichrome. BMMC injection was performed in a third group of mice to assess cell survival. The cells were harvested from a line of luciferase expressing transgenic mice (L2G), courtesy of Dr. Ronglih Liao. The BMMCs from these mice were prepared as described above and injected into mice of the same strain (FVB, n=6) 3 weeks after IR. Serial bioluminescence imaging was performed to assess cell survival.
DTI in Normal Human Volunteers
Normal volunteers were imaged on a 3T clinical system (Achieva, Phillips, Best Netherlands) with a maximum gradient strength of 80mT/m per axis. A motion-compensated 2D diffusion-encoded single shot spin echo EPI sequence, identical to the sequence used to image the mice, was used. Data acquisition was ECG triggered and performed in mid-systole during free breathing utilizing a respiratory gating navigator. Imaging parameters were as follows: Field-of-view 230×104mm2, slice thickness 4mm (reconstructed to 6mm), matrix 115×52, in-plane resolution 2×2mm2 (reconstructed to 1.4×1.4mm2), number of slices 7, TR 1 RR interval, TE 58ms, b-value 500s/mm2, 18 diffusion-encoding directions plus one b=0 s/mm2 image, and 15 averages.
Analysis of the human DTI datasets was performed with software developed in our center. The diffusion-weighted images were spatially registered and the dyadic diffusion tensor was calculated in each voxel. Numerical integration of the primary eigenvector field into diffusion streamlines was performed using a 4th order Runge-Kutta approach. A propagation angle greater than 35° served as a criterion for tract termination.
Statistical Methods
Comparison of the HA slope and histogram values between DTI and DSI-tractography was performed using an unpaired t-test. Comparison of the healing scores in the BL6-BL6 and FVB-BL6 mice was performed with a Mann-Whitney test. The correlation between AAR by MD and T2-weighted MRI was performed using Pearson correlation. Comparison of MD and FA values in control mice, mice 24 hours after IR and mice 3 weeks after IR was performed using ANOVA with a Tukey’s post-test comparison. Likewise, ANOVA with a Tukey’s post-test comparison was used to compare serial MD and FA values before and after BMMC implantation. Gaussian data are reported as mean ± standard deviation. Non-Gaussian data are reported as median values with the interquartile range in parenthesis. Transmural HA plots are of mean ± standard deviation at each point. Bar graphs are of mean ± standard error.
Results
Accuracy of In Vivo DTI-Tractography in Mice
Diffusion-encoding with the conventional Stejskal-Tanner sequence produced severe signal degradation of the moving heart (Figure 1C). In contrast, image quality with the motion-compensated version of the Stejskal-Tanner sequence was routinely high (Figure 1D). As predicted by Gamper and colleagues,13 image quality was highest when the data were acquired in mid-systole (Figure 1E–F).
In all mice the transmural evolution of myofiber orientation was robustly resolved with in vivo DTI-tractography. This is shown in Figure 2A with the heart viewed from its lateral wall and in Figure 2B with the same heart viewed from its base. Myofibers in the subendocardium have a positive HA (pink-dark blue), those in the subepicardium have a negative HA (yellow-green) and fibers in the midmyocardium are circumferential (cyan). In Figure 2C, small ROIs have been placed in the subepicardium and subendocardium, allowing the crossing helical fiber pattern in the heart to be easily perceived.
Figure 2.

(A–C) DTI-tractography of a normal mouse heart in vivo. (A, B) Fibers intersecting a ROI (panel A inset) in the lateral wall of the LV are shown and color-coded by HA. (A) Lateral view of fiber architecture in the LV. The characteristic crossing helical pattern of the subendocardial (pink to dark blue) and subepicardial (green-yellow) fibers is well seen. (B) The same heart viewed from the base. The midmyocardial fibers (light blue) are circumferential while the subendocardial and subepicardial fibers are highly oblique. (C) Small ROIs have been placed in the subendocardium and subepicardium of the lateral wall. The crossing helical myofiber pattern in the LV is well resolved with in vivo DTI-tractography. (D) DSI-tractography of a mouse heart ex vivo. (E) Plots of HA vs. transmural depth in normal mice imaged with in vivo DTI (red) and ex vivo DSI. (F, G) Histograms of myofiber HA in the lateral wall obtained with DTI-tractography in vivo (F, gray) and DSI-tractography ex vivo (G, blue). (H–K) No significant differences are seen in the transmural slope, mean, standard deviation (SD) or range of myofiber HA between the DSI and in vivo DTI-tractography datasets.
A high degree of concordance was seen between myofiber architecture with in vivo DTI-tractography (Figure 2A–C) and ex vivo DSI-tractography (Figure 2D). Quantitative comparison of the datasets was performed by generating transmural plots and histograms of HA in the lateral LV wall (Figure 2E–G). No significant differences were seen between the transmural slope of HA (15.5 ± 1.5 vs. 15.8 ± 2.2 degrees/voxel, p=0.81) in the DTI and DSI datasets (Figure 2E, H). Likewise, no significant differences were seen in the mean HA (8.2 ± 5.3° vs. 7.7 ± 6.1°, p=0.89), standard deviation (37.1 ± 5.4° vs. 40.9 ± 4.8°, p=0.26) or range of tract HA (146.9 ± 27.6° vs. 158.3 ± 11.6°, p=0.41) between the in vivo DTI and ex vivo DSI datasets (Figure 2I–K).
DTI-Tractography in Myocardial Infarction
Signal intensity in the T2-weighted images was significantly elevated in the AAR 24 hours after myocardial infarction (Figure 3A–C). Likewise, a corresponding increase in MD (Figure 3D) was seen in the AAR (Figure 3E). A strong correlation was seen between the AAR measured by MD elevation and the AAR defined by T2-weighted MRI (R2 = 0.88).
Figure 3.

Measurement of the AAR in mice 24 hours after myocardial infarction. (A) Gradient echo with no T2-preparation applied, (B) same slice with T2-preparation, (C) pseudocolor map of the T2-prepared image. (D) In vivo MD map. (C, D) Both MD and signal intensity in the T2-prepared image are increased in the anterior, lateral and infero-lateral walls of the infarcted mouse. (E) The AAR measured after MRI through the injection of fluorescent microspheres correlates well with the elevation of MD. (F) A strong correlation (R2 = 0.88) was seen between the %AAR by MD and T2-weighted MRI.
Fiber architecture in the uninjured septum (Figure 4A) was normal in the infarcted mice. In contrast, in most cases a profound loss of fiber tracts (Figure 4B) was seen in the AAR. LGE and TTC staining (Figure 4C–F), however, showed that tract coherence was lost in both nonviable myocardium and viable areas with large local elevations in MD (Figure 4G–K). In the mice imaged 3 weeks after infarction a profound loss of fiber tracts was seen (Figure 4L). The presence of collagen fibers in the healed infarct scar thus did not restrict diffusion adequately to produce tracts resolvable with DTI.
Figure 4.

(A–K) In vivo DTI-tractography of two mice 24 hours after myocardial infarction. (A) Tractography of fibers in the uninjured septum (viewed from the right ventricle). (B) Lateral view of the LV: A profound loss of fibers (arrows) is seen in the infarcted anterior and lateral walls. (C) LGE and (D–F) TTC staining of the infarct zone, however, show that the subendocardium remains largely viable. (G) Second infarcted mouse also showing a profound loss of tracts in the apical half of the heart. (H–K) In vivo MD map, AAR after fluorescent microsphere injection, and TTC staining of the same mouse heart. No tracts are seen in the infarcted (nonviable) segments of the heart. The subendocardium, which has very few tracts, remains viable but shows a marked elevation in MD (H). The loss of tracts at 24 hours was thus seen in both infarcted myocardium and viable segments with large elevations in MD. (L) Ex vivo DTI-tractography 3 weeks after infarction. The infarct zone is sharply demarcated, thinned, aneurysmal and contains few tracts.
DTI-Tractography in Ischemia-Reperfusion
In normal mice (Figure 5A) MD in the myocardium was fairly uniform and averaged 1.20 ± 0.06×10⁻³ mm2/s. In the mice imaged 24 hours after IR (Figure 5B) MD was significantly elevated in the territory of the occluded left coronary artery (1.27 ± 0.06×10⁻³ mm2/s, p<0.05 versus control). However, when imaged 3 weeks later, MD in these mice (Figure 5C–D) had returned almost fully back to baseline (1.22 ± 0.04×10⁻³ mm2/s). As shown in Figure 5E, a corresponding decrease in FA was seen at 24 hours (0.25 ± 0.03 vs. 0.29 ± 0.02 in controls, p<0.05), which likewise resolved by 3 weeks (0.29 ± 0.04 vs. 0.25 ± 0.03 at 24 hours, p<0.05). Acute myocardial injury was thus characterized by an increase in MD and a decrease in FA.
Figure 5.

Serial DTI and tractography in mice with IR. (A) In vivo MD map of the LV in a normal control mouse. (B, C) Serial MD maps of the LV in a mouse (B) 24 hours and (C) 3 weeks after IR. MD in the injured anterior and lateral walls rises acutely but by 3 weeks has returned towards baseline (C, arrow). (D, E) Acute injury is characterized by an increase in MD and a decrease in FA at 24 hours. Within 3 weeks of IR, MD and FA have returned back towards their normal values. (F) Tractography of the LV 3 weeks after IR. Moderate disruption of fiber architecture is present but, unlike infarcted mice, resolvable tracts are present in the healed myocardium. (G, H) Serial in vivo DTI-tractography of a mouse (G) 24 hours and (H) 3 weeks after IR. (G) At 24 hours few tracts can be resolved in the apical half of the LV. (H) 3 weeks later MD has returned to baseline and substantially more tracts, particularly in the subendocardium and midmyocardium, can now be resolved. Fiber architecture, however, remains significantly perturbed. C = control, * p < 0.05.
Fiber architecture in the mice with IR remained highly abnormal at 3 weeks (Figure 5F) but was more preserved than in the infarcted mice (Figure 4L). Marked differences, however, were seen between tractography in these mice 24 hours and 3 weeks after IR. At the 24-hour time point a profound loss of tracts was seen, particularly in the subendocardium. However, 3 weeks after IR, the loss of tracts was less pronounced. This is well demonstrated in Figure 5G–H, where serial tractography in a mouse with IR shows a marked recovery of subendocardial fiber tracts (pink-dark blue) between the 24-hour and 3-week time points. The resolution of edema in IR was thus characterized by a reduction in MD, an increase in FA and an increase in the number of coherent fiber tracts.
DTI-Tractography of Cell Therapy
In the BL6-BL6 group a small (non-significant) reduction in MD and increase in FA was seen on day 3 after cell injection (Figure 6A). However, the converse response (increased MD, reduced FA) was seen in both groups of mice at day 7 (Figure 6B and supplement Table 1). In a given mouse, accelerated healing in response to cell injection was defined by a sustained decrease in MD, a sustained increase in FA, and the appearance of new myofiber tracts with the correct orientation. Increased MD, reduced FA and the loss of myofiber tracts defined an impaired healing response (see supplement). In the BL6-BL6 group a neutral response to BMCC injection was seen in 4/6 mice, accelerated healing in 1/6 and impaired healing in 1/6 (Figure 6C). In the FVB-BL6 group a neutral response was seen in 5/6 mice and impaired healing in 1/6. None of the mice in the FVB-BL6 group showed accelerated healing. A scoring system (accelerated = 2, neutral =1, impaired = 0) was used to compare the FVB-BL6 and BL6-BL6 groups (Figure 6D), and showed no significant differences between the two groups: (mean score 0.83 ± 0.41 in FVB-BL6 and 1.00 ± 0.63 in BL6-BL6, p=0.6; median score 1.0 (0.5–1.0) in FVB-BL6 and 1.0 (0.5–1.5) in BL6-BL6, p=0.7).
Figure 6.

Serial DTI-tractography of mice injected with BMMCs 3 weeks after IR. (A, B) Percent change (∆) in MD and FA from their pre-injection values. On day 3 the BL6-BL6 mice show a positive response (reduced MD, increased FA). However, by day 7 both groups show a deleterious response (increased MD, reduced FA). Green bars = MD, red bars = FA, patterned bars = FVB-BL6. (C) A neutral response to BMMC injection was seen in most mice. (D) No difference in the healing score was seen between the BL6-BL6 and FVB-BL6 groups. (E) DTI-tractography of a mouse in the BL6-BL6 cohort with a neutral response to BMMC injection. A severe loss of fiber tracts persists in the apical half of the LV. The white lines mark the planes of the HA maps (F, G) and histological sections (I, J). The white arrows in the HA maps demarcate the upper/lower edges of the histological sections (10× magnification, scale bar = 100 µm, * = anterolateral epicardium). At the midventricular level (F, I), fiber architecture remains well preserved except in the anterolateral subepicardium. In the more apical plane (G, J) fiber architecture is severely perturbed. (H) Transmural HA plots confirm the progressive loss of myofiber organization from the mid LV to the apex. (K, L) Bioluminescence imaging (identical donor and recipient strains) shows that BMMCs injected into mice 3 weeks after IR survived well.
DTI-tractography of a mouse with a neutral response to BMMC injection is shown in Figure 6E. The loss of myofibers in the apical half of the LV remained extremely profound despite the injection of BMMCs over 7 days prior. This was confirmed by HA maps, HA plots and by histology (Figure 6F–J). Strong agreement was observed in all mice between the in vivo DTI-tractography findings and histology. Bioluminescence imaging (Figure 6K–L) showed that the survival of BMMCs injected 3 weeks after IR was high (82.0 ± 15.9 % at 13 days) and could not account for the low healing scores.
DTI-tractography of the two mice in the BL6-BL6 group with a non-neutral response to BMMC injection is shown in Figure 7. In one of the mice (Figure 7A–C) the injected cells produced a decrease in MD and an increase in FA consistent with accelerated healing. Serial tractography in this mouse (Figure 7A–B) showed a profound increase in the number of subendocardial and subepicardial tracts after BMMC injection. In the other mouse shown (Figure 7D–F), the MD and FA values suggested impaired healing following BMMC injection. Tractography in this mouse revealed a profound loss of subepicardial myofibers, and a reduction in the number of subendocardial fibers, following cell injection (Figure 7D–E). Histology on day 10 (Figures 7C, 7F) confirmed the in vivo tractography findings. HA maps and transmural HA plots (Figure 7G–I) were consistent with the tractography findings in all cases.
Figure 7.

Serial DTI-tractography in BL6-BL6 mice showing (A–C) an accelerated healing response following BMMC injection and (D–F) an impaired response. (A) Only a few subendocardial and subepicardial tracts are seen in the apical half of the LV pre-injection. (B) Post-injection, coherent tracts (arrows) are seen in both the subepicardium and subendocardium. (C) Masson’s trichrome (short axis plane, 10×) at the level of the white line in panel B confirms the presence of correctly oriented myofibers in the subendocardium and subepicardium. (D) Pre-injection image showing coherent tracts in the subendocardium and subepicardium (arrows). (E) Following BMMC injection fewer tracts are present in the anterolateral subendocardium and tracts in the subepicardium of the inferolateral wall have been completely lost. (F) Masson’s trichrome (10×, short axis section at level of white line in Panel E) confirms the disorganization of fibers in the subendocardium and the complete loss of fibers in the subepicardium. Scale bar = 100 µm. (G–I) HA maps of the heart shown in panels D–F. Before injection HA transitions smoothly from the endocardium to epicardium (white box, G). After injection HA, particularly in the subendocardium and subepicardium (arrows, H), is highly disordered. (I) The transmural evolution of HA in the inferolateral (ILat) wall is relatively normal pre-injection (blue) but severely perturbed at day 7 (D7) post-injection (black). The plot of HA in the septum at D7 (red) is shown for comparison.
DTI-Tractography of the Human Heart In Vivo
Tractography of a human volunteer, imaged with a true resolution of 2×2×4mm3, is shown in Figure 8. The expected transmural evolution in tract HA can be well resolved. Fibers in the subepicardium have a highly negative HA (yellow-red) and those in the subendocardium (dark blue) have a highly positive HA. The tracts are correctly oriented and highly coherent except over the papillary muscles, where a high degree of HA dispersion is a normal finding. Tracts intersecting a transmural ROI avoiding the papillary muscles are shown in Figure 8C. The tracts are highly organized and clearly demonstrate the crossing pattern of myofiber tracts in the subepicardium and subendocardium.
Figure 8.
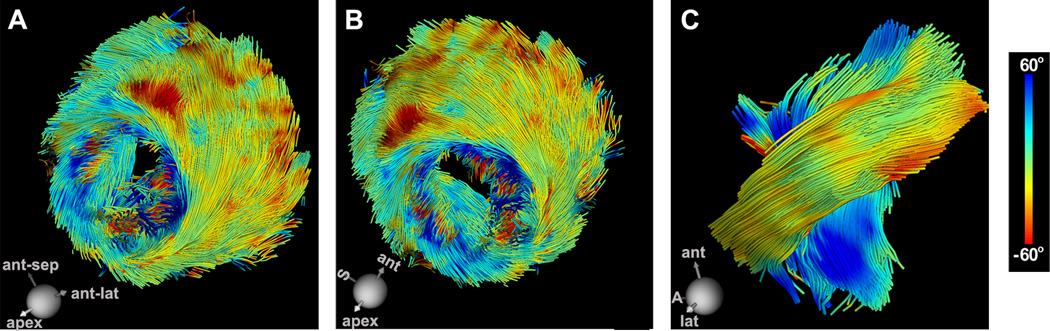
In vivo DTI-tractography of the LV in a normal human volunteer. The tracts are color-coded by HA. (A, B) Coherent tracts with the correct orientation can be resolved in all regions of the myocardium. (Dispersion of HA over the papillary muscles and trabeculations of the LV is a normal finding). (C) Magnified view of fibers crossing a ROI in the midlateral wall of the LV. The characteristic crossing pattern of myofibers in the subendocardium and subepicardium can be clearly seen. S = septum, A = apex.
Discussion
The arrangement of myofibers in the heart has a major impact on its mechanical and electrical function.7, 26 Current techniques to characterize 3D myofiber architecture, however, have been limited largely to ex vivo application.9, 10 Here, for the first time, we show that DTI and tractography of the mouse heart can be successfully performed in vivo. We further show, for the first time, that serial DTI-tractography of the heart in vivo can be used to characterize the response of the myocardium to injury and to assess the ability of injected cells to regenerate new myocardium. A novel approach that advances the understanding of cardiovascular disease and has the potential to guide the development of regenerative therapies in the heart is thus presented.
DTI-tractography in the heart is extremely challenging since its bulk motion is 4–5 orders of magnitude greater than the mean displacement of water molecules due to self-diffusion. This is particularly the case in mouse hearts, which beat up to 600 times per minute and require a high spatial resolution. Here, by using an ultra-high (1500 mT/m) gradient insert and a motion-compensated version the Stejskal-Tanner spin echo diffusion sequence,13 we were able to successfully perform DTI of the mouse heart in vivo. Furthermore, we were able to perform 3D DTI-tractography of the entire heart in vivo with isotropic spatial resolution. This has hitherto not been achieved in any species, where only highly anisotropic imaging of a portion of the heart has been feasible.19–21 These technical advances allowed the microstructure of the heart to be robustly imaged and important insights to be gained into the nature of myocardial injury and regeneration.
DTI-Tractography and the Assessment of Myocardial Regeneration
Efforts to regenerate the myocardium have generally been evaluated by the changes they produce in LV volume, ejection fraction and LGE.8 While of considerable value, these measures are indirect indicators of myocardial regeneration and can be affected by loading conditions and the integrity of the microvascular network. DTI-tractography, in contrast, provides a direct readout of myofiber organization and architecture. The technique allows the generation of new myofibers to be detected, characterized and followed over time. DTI-tractography can assess the ability of newly generated CMs to assume the correct 3D orientation and integrate appropriately with other myofibers in the heart. The technique thus assays the ability of a given therapy to regenerate organized and functional myocardium and not simply isolated new CMs.
The optimal cell type for cardiac regeneration continues to be actively debated.1, 27 Many of the clinical trials (FOCUS, TIME, Late-Time) recently performed by the NIH-sponsored Cardiovascular Cell Therapy Research Network have used BMMCs.27, 28 The results of our study, however, suggest that BMMCs may not be the optimal cell to regenerate new myocardium. Only 1 mouse injected with BMMCs showed evidence of accelerated healing and myocardial regeneration. In addition, no significant differences were seen between the BL6-BL6 group and the control FVB-BL6 group. These data are consistent with the results of the TIME, Late-Time and FOCUS trials, in which the injection of BMMCs showed no benefit.27, 28 DTI-tractography may thus provide a uniquely powerful tool to assess the efficacy of novel stem/progenitor cells in preclinical models and subsequently in clinical trials.
Role of DTI-Tractography in Ischemic Injury
DTI-tractography could play a valuable role in the assessment of myocardial viability, particularly in those in whom gadolinium is contra-indicated. Prior studies of DTI in subacute infarction have shown have shown increased dispersion,4 and significant reorientation,21 of fiber architecture in the infarct zone. The interpretation of DTI-tractography during the first 24 hours after acute injury, however, is complex. The presence of coherent tracts is highly suggestive of persistent myocardial viability. However, slow disintegration and removal of injured CMs, which may take more than 24 hours in acute infarction,29 can mask the presence of injury. Imaging 48–72 hours after injury overcomes this limitation. The use of a lower tract termination angle would likely also increase the sensitivity to injury but could reduce the ability to resolve residual, damaged and regenerated myofibers in the infarct and border zone. Further study of this parameter will thus be needed.
The loss of tract coherence in acute injury can be seen in nonviable myocardium as well as viable myocardium with high levels of edema. Myocardial edema, however, resolves within 2–3 weeks of injury at which time DTI-tractography provides an accurate and specific readout of microstructural damage in the heart. DTI-tractography 3 weeks after injury can thus be used to assess the impact of novel cardioprotective therapies. In the chronic setting (>3 weeks after injury) stable maps of myocardial microstructure can be obtained both before and after the initiation of therapy. Mice in this study were injected with BMMCs 3 weeks post-IR for this reason.
Clinical Translation and Conclusion
DTI-tractography provides an integrated and comprehensive assessment of 3D microstructure. The optimal reconstruction of 3D datasets, however, requires isotropic spatial resolution. This has not been achieved hitherto with in vivo tractography of the heart but was achieved in the murine arm of this study. In contrast, in vivo DTI of the human heart has been performed to date with highly anisotropic resolution and covering only a small portion of the heart.19–21 Here we demonstrate that a gradient system providing 80 mT/m per axis allows DTI-tractography in humans to be performed with near-isotropic whole heart coverage. The matrix used to image the volunteers in our study produced a true resolution of 2×2×4mm3, which results in a signal-to-noise ratio (SNR) very similar to an isotropic resolution of 2.5mm. In addition, ongoing improvements in gradient strength, shimming and spatiotemporal image registration will likely result in significantly improved image quality in the near future.
In conclusion, we present an innovative approach, using DTI-tractography of the mouse heart in vivo, to assess the degree of microstructural alteration in the myocardium in response to ischemia and cell therapy. The MRI-based tractography approach we describe is fully translatable and does not require the injection of contrast agents or radioactive tracers. DTI-tractography has the potential to become a valuable tool in both the clinical and preclinical settings and provide important insights into the pathogenesis and treatment of a broad range of cardiovascular diseases.
Supplementary Material
Acknowledgments
Funding Sources: This research was supported by the following National Institutes of Health grants: R01 HL093038 (D.E.S.), R01HL112831 (D.E.S.), P41RR14075 (Martinos Center for Biomedical Imaging) and R01HL099073 (R.L.)
Conflict of Interest Disclosures: DES receives research support from Siemens Medical. SK receives support from Philips Healthcare.
References
- 1.Rosenzweig A. Medicine. Cardiac regeneration. Science. 2012;338:1549–1550. doi: 10.1126/science.1228951. [DOI] [PubMed] [Google Scholar]
- 2.Streeter DD, Jr, Spotnitz HM, Patel DP, Ross J, Jr, Sonnenblick EH. Fiber orientation in the canine left ventricle during diastole and systole. Circ Res. 1969;24:339–347. doi: 10.1161/01.res.24.3.339. [DOI] [PubMed] [Google Scholar]
- 3.Scollan DF, Holmes A, Winslow R, Forder J. Histological validation of myocardial microstructure obtained from diffusion tensor magnetic resonance imaging. Am J Physiol. 1998;275:H2308–H2318. doi: 10.1152/ajpheart.1998.275.6.H2308. [DOI] [PubMed] [Google Scholar]
- 4.Chen J, Song SK, Liu W, McLean M, Allen JS, Tan J, Wickline SA, Yu X. Remodeling of cardiac fiber structure after infarction in rats quantified with diffusion tensor MRI. Am J Physiol Heart Circ Physiol. 2003;285:H946–H954. doi: 10.1152/ajpheart.00889.2002. [DOI] [PubMed] [Google Scholar]
- 5.Wu EX, Wu Y, Nicholls JM, Wang J, Liao S, Zhu S, Lau CP, Tse HF. MR diffusion tensor imaging study of postinfarct myocardium structural remodeling in a porcine model. Magn Reson Med. 2007;58:687–695. doi: 10.1002/mrm.21350. [DOI] [PubMed] [Google Scholar]
- 6.Sosnovik DE, Wang R, Dai G, Wang T, Aikawa E, Novikov M, Rosenzweig A, Gilbert RJ, Wedeen VJ. Diffusion spectrum MRI tractography reveals the presence of a complex network of residual myofibers in infarcted myocardium. Circ Cardiovasc Imaging. 2009;2:206–212. doi: 10.1161/CIRCIMAGING.108.815050. [DOI] [PMC free article] [PubMed] [Google Scholar]
- 7.Helm PA, Younes L, Beg MF, Ennis DB, Leclercq C, Faris OP, McVeigh E, Kass D, Miller MI, Winslow RL. Evidence of structural remodeling in the dyssynchronous failing heart. Circ Res. 2006;98:125–132. doi: 10.1161/01.RES.0000199396.30688.eb. [DOI] [PubMed] [Google Scholar]
- 8.Nguyen PK, Lan F, Wang Y, Wu JC. Imaging: guiding the clinical translation of cardiac stem cell therapy. Circ Res. 2011;109:962–979. doi: 10.1161/CIRCRESAHA.111.242909. [DOI] [PMC free article] [PubMed] [Google Scholar]
- 9.Sosnovik DE, Wang R, Dai G, Reese TG, Wedeen VJ. Diffusion MR tractography of the heart. J Cardiovasc Magn Reson. 2009;11:47. doi: 10.1186/1532-429X-11-47. [DOI] [PMC free article] [PubMed] [Google Scholar]
- 10.Mekkaoui C, Huang S, Chen HH, Dai G, Reese TG, Kostis WJ, Thiagalingam A, Maurovich-Horvat P, Ruskin JN, Hoffmann U, Jackowski MP, Sosnovik DE. Fiber architecture in remodeled myocardium revealed with a quantitative diffusion CMR tractography framework and histological validation. J Cardiovasc Magn Reson. 2012;14:70. doi: 10.1186/1532-429X-14-70. [DOI] [PMC free article] [PubMed] [Google Scholar]
- 11.Reese TG, Weisskoff RM, Smith RN, Rosen BR, Dinsmore RE, Wedeen VJ. Imaging myocardial fiber architecture in vivo with magnetic resonance. Magn Reson Med. 1995;34:786–791. doi: 10.1002/mrm.1910340603. [DOI] [PubMed] [Google Scholar]
- 12.Dou J, Reese TG, Tseng WY, Wedeen VJ. Cardiac diffusion MRI without motion effects. Magn Reson Med. 2002;48:105–114. doi: 10.1002/mrm.10188. [DOI] [PubMed] [Google Scholar]
- 13.Gamper U, Boesiger P, Kozerke S. Diffusion imaging of the in vivo heart using spin echoes--considerations on bulk motion sensitivity. Magn Reson Med. 2007;57:331–337. doi: 10.1002/mrm.21127. [DOI] [PubMed] [Google Scholar]
- 14.Ennis DB, Kindlman G, Rodriguez I, Helm PA, McVeigh ER. Visualization of tensor fields using superquadric glyphs. Magn Reson Med. 2005;53:169–176. doi: 10.1002/mrm.20318. [DOI] [PMC free article] [PubMed] [Google Scholar]
- 15.Jiang Y, Guccione JM, Ratcliffe MB, Hsu EW. Transmural heterogeneity of diffusion anisotropy in the sheep myocardium characterized by MR diffusion tensor imaging. Am J Physiol Heart Circ Physiol. 2007;293:H2377–H2384. doi: 10.1152/ajpheart.00337.2007. [DOI] [PubMed] [Google Scholar]
- 16.Ripplinger CM, Li W, Hadley J, Chen J, Rothenberg F, Lombardi R, Wickline SA, Marian AJ, Efimov IR. Enhanced transmural fiber rotation and connexin 43 heterogeneity are associated with an increased upper limit of vulnerability in a transgenic rabbit model of human hypertrophic cardiomyopathy. Circ Res. 2007;101:1049–1057. doi: 10.1161/CIRCRESAHA.107.161240. [DOI] [PMC free article] [PubMed] [Google Scholar]
- 17.Wu Y, Chan CW, Nicholls JM, Liao S, Tse HF, Wu EX. MR study of the effect of infarct size and location on left ventricular functional and microstructural alterations in porcine models. J Magn Reson Imaging. 2009;29:305–312. doi: 10.1002/jmri.21598. [DOI] [PubMed] [Google Scholar]
- 18.Strijkers GJ, Bouts A, Blankesteijn WM, Peeters TH, Vilanova A, van Prooijen MC, Sanders HM, Heijman E, Nicolay K. Diffusion tensor imaging of left ventricular remodeling in response to myocardial infarction in the mouse. NMR Biomed. 2009;22:182–190. doi: 10.1002/nbm.1299. [DOI] [PubMed] [Google Scholar]
- 19.Nielles-Vallespin S, Mekkaoui C, Gatehouse P, Reese TG, Keegan J, Ferreira PF, Collins S, Speier P, Feiweier T, de Silva R, Jackowski MP, Pennell DJ, Sosnovik DE, Firmin D. In vivo diffusion tensor MRI of the human heart: Reproducibility of breath-hold and navigator-based approaches. Magn Reson Med. 2013;70:454–465. doi: 10.1002/mrm.24488. [DOI] [PMC free article] [PubMed] [Google Scholar]
- 20.Tseng WY, Dou J, Reese TG, Wedeen VJ. Imaging myocardial fiber disarray and intramural strain hypokinesis in hypertrophic cardiomyopathy with MRI. J Magn Reson Imaging. 2006;23:1–8. doi: 10.1002/jmri.20473. [DOI] [PubMed] [Google Scholar]
- 21.Wu MT, Tseng WY, Su MY, Liu CP, Chiou KR, Wedeen VJ, Reese TG, Yang CF. Diffusion tensor magnetic resonance imaging mapping the fiber architecture remodeling in human myocardium after infarction: correlation with viability and wall motion. Circulation. 2006;114:1036–1045. doi: 10.1161/CIRCULATIONAHA.105.545863. [DOI] [PubMed] [Google Scholar]
- 22.Delattre BM, Viallon M, Wei H, Zhu YM, Feiweier T, Pai VM, Wen H, Croisille P. In vivo cardiac diffusion-weighted magnetic resonance imaging: quantification of normal perfusion and diffusion coefficients with intravoxel incoherent motion imaging. Invest Radiol. 2012;47:662–670. doi: 10.1097/RLI.0b013e31826ef901. [DOI] [PMC free article] [PubMed] [Google Scholar]
- 23.Wu MT, Su MY, Huang YL, Chiou KR, Yang P, Pan HB, Reese TG, Wedeen VJ, Tseng WY. Sequential changes of myocardial microstructure in patients postmyocardial infarction by diffusion-tensor cardiac MR: correlation with left ventricular structure and function. Circ Cardiovasc Imaging. 2009;2:32–40. doi: 10.1161/CIRCIMAGING.108.778902. [DOI] [PubMed] [Google Scholar]
- 24.Toussaint N, Sermesant M, Stoeck CT, Kozerke S, Batchelor PG. In vivo human 3D cardiac fibre architecture: reconstruction using curvilinear interpolation of diffusion tensor images. Med Image Comput Comput Assist Interv. 2010;13:418–425. doi: 10.1007/978-3-642-15705-9_51. [DOI] [PubMed] [Google Scholar]
- 25.Beyers RJ, Smith RS, Xu Y, Piras BA, Salerno M, Berr SS, Meyer CH, Kramer CM, French BA, Epstein FH. T(2) -weighted MRI of post-infarct myocardial edema in mice. Magn Reson Med. 2012;67:201–209. doi: 10.1002/mrm.22975. [DOI] [PMC free article] [PubMed] [Google Scholar]
- 26.Trayanova NA. Whole-heart modeling: applications to cardiac electrophysiology and electromechanics. Circ Res. 2011;108:113–128. doi: 10.1161/CIRCRESAHA.110.223610. [DOI] [PMC free article] [PubMed] [Google Scholar]
- 27.Marban E, Malliaras K. Mixed results for bone marrow-derived cell therapy for ischemic heart disease. Jama. 2012;308:2405–2406. doi: 10.1001/jama.2012.64751. [DOI] [PubMed] [Google Scholar]
- 28.Traverse JH, Henry TD, Pepine CJ, Willerson JT, Zhao DX, Ellis SG, Forder JR, Anderson RD, Hatzopoulos AK, Penn MS, Perin EC, Chambers J, Baran KW, Raveendran G, Lambert C, Lerman A, Simon DI, Vaughan DE, Lai D, Gee AP, Taylor DA, Cogle CR, Thomas JD, Olson RE, Bowman S, Francescon J, Geither C, Handberg E, Kappenman C, Westbrook L, Piller LB, Simpson LM, Baraniuk S, Loghin C, Aguilar D, Richman S, Zierold C, Spoon DB, Bettencourt J, Sayre SL, Vojvodic RW, Skarlatos SI, Gordon DJ, Ebert RF, Kwak M, Moye LA, Simari RD. Effect of the use and timing of bone marrow mononuclear cell delivery on left ventricular function after acute myocardial infarction: the TIME randomized trial. Jama. 2012;308:2380–2389. doi: 10.1001/jama.2012.28726. [DOI] [PMC free article] [PubMed] [Google Scholar]
- 29.Huang S, Chen HH, Yuan H, Dai G, Schuhle DT, Mekkaoui C, Ngoy S, Liao R, Caravan P, Josephson L, Sosnovik DE. Molecular MRI of acute necrosis with a novel DNA-binding gadolinium chelate: kinetics of cell death and clearance in infarcted myocardium. Circ Cardiovasc Imaging. 2011;4:729–737. doi: 10.1161/CIRCIMAGING.111.966374. [DOI] [PMC free article] [PubMed] [Google Scholar]
Associated Data
This section collects any data citations, data availability statements, or supplementary materials included in this article.