

Abstract
Microsaccades are tiny saccades that occur during gaze fixation. While these movements have traditionally been viewed as random, it was recently discovered that microsaccade directions can be significantly biased by covertly attended visual stimuli. The detailed mechanisms mediating such a bias are neither known nor immediately obvious, especially because the amplitudes of the movements influenced by attentional cueing could be up to two orders of magnitude smaller than the eccentricity of the attended location. Here we tested whether activity in the peripheral superior colliculus (SC) is necessary for this correlation between attentional cueing and microsaccades. We reversibly and focally inactivated SC neurons representing peripheral regions of visual space while rhesus monkeys performed a demanding covert visual attention task. The normal bias of microsaccade directions observed in each monkey before SC inactivation was eliminated when a cue was placed in the visual region affected by the inactivation; microsaccade directions were instead biased away from the affected visual space. When the cue was placed at another location unaffected by SC inactivation, the baseline cue-induced bias of microsaccade directions remained mostly intact, because the cue was in unaffected visual space, and any remaining changes were again explained by a repulsion of microsaccade directions away from the inactivated region. Our results indicate that peripheral SC activity is required for the link between microsaccades and the cueing of covert visual attention, and that it could do so by altering the probability of triggering microsaccades without necessarily affecting the motor generation of these movements.
Keywords: Fixational eye movements, attention, perceptual processing, muscimol, rhesus macaque
Introduction
Microsaccades are tiny eye movements that occur during gaze fixation. Even though microsaccades have long been thought to be random and spontaneous, recent evidence has shown that these movements, like larger saccades, are influenced by visual and cognitive factors. The first explicit demonstration of this was the finding that putative covert visual attention shifts affect microsaccades (Hafed & Clark, 2002; Engbert & Kliegl, 2003). In these first studies on this phenomenon, cueing attention to the periphery biased microsaccades toward the cued location. The detailed mechanisms mediating such a bias are not immediately obvious, especially because the amplitudes of the movements influenced by cueing could be up to two orders of magnitude smaller than the eccentricity of the attended location. Thus, unlike the classic coupling between saccades and attention, which involve shifts to the same spatial endpoint (Rizzolatti et al., 1994; Sheliga et al., 1994), the coupling between microsaccades and attention involves shifts that could be in the same direction but of very different amplitudes.
The existence of similar behavioral correlations between attention and microsaccades in monkeys (Hafed et al., 2011) provides an ideal model for investigating the neural basis of this phenomenon. This topic is important for at least two reasons. First, clarifying the neural mechanisms linking microsaccades and cueing is imperative for fully understanding the functional role of these eye movements in vision and whether or not they are an adaptive behavior. Second, because many, if not most, cognitive neuroscience experiments employ gaze fixation, it is crucial to understand the influence exerted by microsaccades during fixation on neural and behavioral data (Martinez-Conde, 2006; Hafed, 2011; Kuang et al., 2012).
Our approach to this topic is guided by a simple model of how activity in the superior colliculus (SC) supports gaze fixation (Hafed et al., 2008; Hafed & Krauzlis, 2008) and microsaccade generation (Hafed et al., 2009; Hafed, 2011; Goffart et al., 2012; Hafed & Krauzlis, 2012). In this model, fixation is maintained through a balance of activity in a bilateral retinotopic map of behavioral goals (Hafed et al., 2008). When the center of mass of activity in this map is biased sufficiently away from bilateral balance, an eye movement (including microsaccades) may be generated (Hafed et al., 2009; Hafed & Krauzlis, 2012). According to this view, peripheral spatial cues, which are much more eccentric than the actual microsaccade endpoints, may alter the likelihood of microsaccades toward a specific direction because such cues asymmetrically alter SC activity (Ignashchenkova et al., 2004). Thus, activity in the SC related to peripheral attended locations, and not necessarily to the foveal locations associated with the small microsaccade endpoints, could be part of the neural mechanism responsible for the correlation between microsaccade directions and covert attention.
In this study, we tested this idea by analyzing the relationship between microsaccades and cueing after reversible inactivation of focal regions in the peripheral SC. We specifically analyzed data from the same set of experiments described earlier (Lovejoy & Krauzlis, 2010), in which a robust alteration of perceptual performance after SC inactivation was observed, and we asked whether such alteration was also accompanied by a concomitant alteration of microsaccades. Our results demonstrate that SC inactivation, in addition to changing perceptual performance (Lovejoy & Krauzlis, 2010), also modifies the influence of attentional cues on microsaccades. These results indicate, perhaps unexpectedly, that modulation of SC activity at peripheral locations much more eccentric than the actual microsaccade endpoints can nonetheless contribute to determining these movements’ directions.
Materials and Methods
The data presented here consist of a new set of analyses on fixational eye movements from the same experimental sessions collected for (Lovejoy & Krauzlis, 2010). Thus, many of the methods we employed here were described previously, but we include them again here, in brief form, for clarity and completeness. Our laboratory setup was identical to that described in detail recently (Hafed et al., 2008; Hafed & Krauzlis, 2008; Hafed et al., 2009; Lovejoy & Krauzlis, 2010; Hafed et al., 2011).
Animal preparation
We collected data from two (J and M) adult, male rhesus macaque monkeys (Macaca mulatta) that were 10–15 years of age and weighed 12–15 kg. The monkeys were prepared using standard surgical techniques that have been described in detail previously, and all experimental protocols for the monkeys were approved by the Institutional Animal Care and Use Committee (of the Salk Institute) and complied with United States Public Health Service policy on the humane care and use of laboratory animals. Note that monkey J was referred to as monkey F in (Lovejoy & Krauzlis, 2010).
Behavioral tasks
Monkeys performed the selective attention tasks described in (Lovejoy & Krauzlis, 2010; Hafed et al., 2011) (also see Fig. 1A). Briefly, every trial began with the onset of a small white fixation spot (9x9 min arc dimensions) similar to that in (Hafed et al., 2009) and presented on a CRT display. Monkeys were allowed 500 ms to bring their gaze to within ~1–1.5 deg around this spot, after which four rings appeared in each visual quadrant in the periphery, alongside the fixation spot. Each ring was 4.4 deg in radius, with its center being at an eccentricity of 8.2 deg relative to the central spot. The rings were 0.25 deg thick, and their luminance was 25 cd/m2. Background luminance was 14 cd/m2, and the white fixation spot was of luminance 50 cd/m2. One of the rings was a different color from the remaining three, serving as the cue to attend to the ring’s quadrant, but it had the same luminance as the other three rings. Random dot motion patches (0% coherence) appeared inside each ring after trial onset (radius of the motion patches: 4.25 deg), and after some random delay, a brief coherent motion pulse appeared in the cued quadrant as well as in the diametrically opposite one (called the ‘foil’). The monkeys’ task was to indicate the direction of the brief motion pulse in the cued quadrant, irrespective of the direction of the distracting motion pulse that appeared simultaneously in the diametrically opposite quadrant. In one variant of the task, the monkeys generated a saccade in the direction of the cued motion pulse to indicate their response; in the other variant, they pressed one of four buttons arranged spatially in the four possible directions of motion in the cued pulse.
Figure 1.
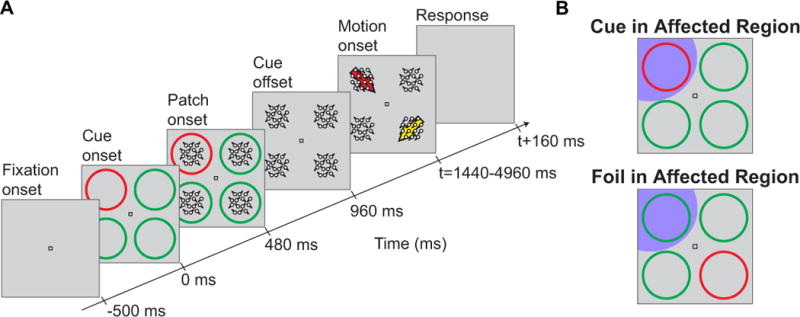
Covert visual attention task. (A) Sequence of events in the covert visual attention task of (Lovejoy & Krauzlis, 2010). Monkeys maintained fixation while covertly attending to a cued quadrant. After several seconds of fixation, a brief motion pulse appeared in both the cued quadrant and the diametrically opposite quadrant (the foil). The monkeys were required to indicate the direction of the brief motion pulse in the cued quadrant, irrespective of the foil pulse. (B) SC inactivation was performed such that peripheral regions corresponding to either the cued quadrant or the foil quadrant were affected by the muscimol injections (the affected regions are shown schematically as dark magenta regions over the stimulus display). This allowed us to study the influence of inactivation of either cued or uncued locations on microsaccadic eye movements.
Reversible inactivation and estimation of the spatial extent of muscimol spread
We inactivated the intermediate and deep layers of the SC, as described in detail in (Lovejoy & Krauzlis, 2010). Briefly, we injected GABA agonist muscimol (0.3–0.5 μl, 5 μg/μl) into the intermediate and deep layers of the SC using an injection cannula like that described in (Chen et al., 2001); supplementary table 1 of (Lovejoy & Krauzlis, 2010) provides a complete list of injection volumes for each experiment. We aimed the cannula in the SC retinotopic map such that we could inactivate a population of neurons representing one of the visual quadrants used in the behavioral task of Fig. 1. We were particularly interested in inactivating peripheral regions associated with the peripheral stimuli in our task, as opposed to central regions associated with the fixation spot. This allowed us to configure the stimulus such that a peripheral cued location was either placed in the affected region of visual space during SC inactivation or diametrically opposite it (see Fig. 1B and Results).
We localized the cannula tip within the SC before injection using several methods. First, we targeted a depth of 1.5–3 mm below the SC surface, corresponding to the intermediate and deep layers of this structure. Second, we recorded activity during saccades consistent with known responses in the SC, which allowed us to confirm both the depth in the SC as well as our placement within the SC retinotopic map. Third, we used electrical microstimulation to evoke saccades. The current needed to evoke such saccades (typically 10 μA) provided further evidence of depth in the SC, and the metrics of the evoked saccades indicated the position of our cannula within the retinotopic map. We also oriented the bevel in our injection cannula to aim it toward the caudal SC rather than the rostral SC, a strategy similar to that described in (Zenon & Krauzlis, 2012). This allowed us to direct drug spread toward the peripheral SC as much as possible, in order to avoid inactivating the rostral SC where the motor control of microsaccades might be more directly affected.
We injected the entire 0.3–0.5 μl volume of muscimol into the SC slowly, over an interval of ~20–30 minutes (one pulse of solution every ~2 minutes until our entire volume was injected). Based on previous experience, this strategy helped stabilize the behavioral effects of the injections and minimize tissue damage. We then took several measures to confirm that our injections affected the peripheral eccentricities that we were interested in. First, we estimated the extent of drug spread in the SC for each injection by measuring the peak velocities of visually-guided saccades (Lovejoy & Krauzlis, 2010; Zenon & Krauzlis, 2012), and estimating the regions of space for which these peak velocities were reduced relative to pre-injection levels. Examples of such analysis are shown in Fig. 2A for several injections from each monkey, where each shaded region in the figure shows the area with reduced peak velocities (Lovejoy & Krauzlis, 2010). As can be seen, saccades smaller than ~3–4 deg in amplitude (often much larger) were not affected, suggesting that muscimol did not dramatically spread toward the rostral SC. Second, we performed several analyses to help confirm that our results in this paper were not fully explained only by a rostral spread of muscimol toward the foveal representation in the SC. We did this by analyzing the characteristics of microsaccades that occurred within 50 ms from cue onset in our main task of Fig. 1. These microsaccades are movements that putatively occurred under similar stimulus conditions to those used previously in studies inactivating the rostral SC (Hafed et al., 2009; Goffart et al., 2012), and so would be expected to get affected by rostral spread of muscimol in the SC. As shown in Fig. 2B, these microsaccades were not consistently reduced in frequency (upper left panel), as might be expected from a rostral spread of muscimol in the SC (Hafed et al., 2009; Goffart et al., 2012), and any changes in their amplitudes or peak velocities were correlated such that the “main sequence” relationship (lower right panel) was not affected by the injections. We took one final measure to exclude rostral spread of muscimol as the primary determinant of our results: we repeated all analyses in this paper but now without the outlier injection in Fig. 2B (upper left panel), in which microsaccade frequency was dramatically reduced compared to pre-injection levels, and confirming that the results we describe in this paper remained the same.
Figure 2.
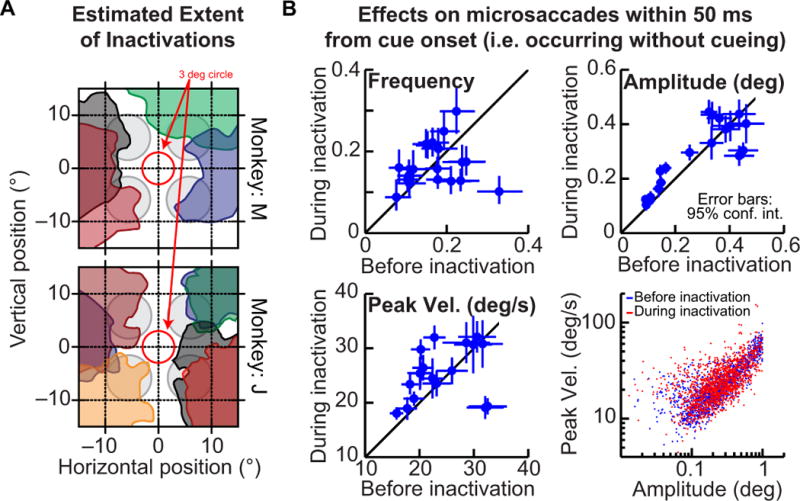
Assessing the spatial extent of inactivations. (A) Each colored region in the figure shows our estimate of the affected region of visual space after a given muscimol injection into the SC. This estimate was obtained based on measured reductions in peak velocities of visually guided saccades (Lovejoy & Krauzlis, 2010; Zenon & Krauzlis, 2012). The shown sessions are from the saccade version of the task, and they were also shown previously in (Lovejoy & Krauzlis, 2010). For reference, the gray circles show the locations of the cue rings in the task of Fig. 1 and the red circle shows a 3-deg radius, indicating that none of our injections extended into the rostral (or foveal) region of the SC. (B) To check for a possible rostral spread of muscimol, which would impair microsaccade generation, we analyzed several microsaccade characteristics before and during SC injections: the fraction of trials containing microsaccades (upper left panel), the amplitude of movements (upper right panel), their peak velocity (lower left panel), and their ‘main sequence’ relationship (lower right panel). In all panels, we performed these analyses for movements occurring within 50 ms from cue onset (i.e. during a baseline, pre-cue fixation interval), and in all panels but the lower right one, each symbol indicates an individual experiment (the lower right panel combines the sessions). Error bars denote 95% confidence intervals.
Our data collection procedures consisted of two conceptually similar steps. Before inactivation, we collected “pre-injection” data from the attention task of Fig. 1 in which cue location was blocked for 40 trials at a time, either at the visual location corresponding to the SC site about to be inactivated or at the opposite location. Thus, in the pre-injection data, we collected trials in which either the cue or the foil was in the region to be affected by the upcoming SC inactivation. As detailed in supplementary table 1 of (Lovejoy & Krauzlis, 2010), this data was collected over a period of ~45–90 minutes (including the collection of “pre-injection” visually-guided saccades to later assess the extent of inactivation). After muscimol injection, we then repeated the data collection exactly as in the pre-injection phase. This second “post-injection” data set was collected over a period of ~60–90 minutes. We always flipped cue and foil locations every 40 trials (Fig. 1B), ensuring that comparisons between trials in which the cue was in the affected region of space and trials in which the foil was in the affected region were counterbalanced as a function of time. Thus, differences in behavioral results between these two groups of trials could not be explained by differences in the effectiveness of the drug as a function of time progression during the experiments.
Across sessions, we collected ~4980 pre-injection trials in 11 sessions from the saccade variant of the selective attention task, and we collected ~5344 inactivation trials. From the button press variant of the task, we collected ~2807 pre-injection trials in 8 sessions and ~3334 inactivation trials. By carefully selecting the inactivated SC site across experimental sessions, we ensured that the combined data from all sessions had trials that were approximately uniformly distributed across all four possible cue locations in the display.
Finally, we performed a saline control injection in one monkey (M) to confirm that our results with muscimol were not due to mechanical effects associated with fluid injections into the SC. In this control session, we injected saline into a region visited earlier with muscimol while the monkey performed the button press version of our task. We used the exact same pre-injection and post-injection data collection procedures as described above.
Data analysis
Eye movement detection and classification
Eye movements were sampled at 1 kHz. Saccades and microsaccades were detected using velocity and acceleration thresholds as described in (Krauzlis & Miles, 1996; Hafed et al., 2009; Hafed & Krauzlis, 2010; Hafed et al., 2011). Specifically, our saccade detection algorithm identified the point of peak radial eye velocity (above a threshold parameter, which we initially set to 8 deg/s) and flagged it as part of a saccade. Then, flanking regions around this point during which eye velocity remained higher than the velocity threshold were included as part of the same saccade. To refine the identification of the start and end points of the saccade, we added further adjoining time points for which eye acceleration in the direction of the saccade exceeded (for saccade start) or went below (for saccade end) a second, acceleration threshold parameter (typically set to 550 deg/s2). Our choice of velocity and acceleration thresholds was made empirically in order to avoid erroneous flagging of drifts/noise while at the same time accounting for the fact that microsaccades are generally slower than larger voluntary saccades. After running the saccade detection algorithm, we visually inspected every trial and each individual microsaccade, and we manually verified that the algorithm did not erroneously miss a microsaccade or falsely detect one. In all of our analyses, we considered as microsaccades all fixational saccades that were smaller than or equal to 1 deg in amplitude. However, the great majority of these movements were much smaller, consistent with previous results (Hafed et al., 2009; Martinez-Conde et al., 2009). For example, the median microsaccade amplitude before SC inactivation was 0.18 deg in monkey M and 0.27 deg in monkey J.
We classified microsaccade directions according to which ‘functional’ quadrant of the stimulus display that they were directed towards (i.e. towards the ‘cued quadrant’, or the ‘foil quadrant’, or ‘neither’). For example, if a microsaccade was directed to the upper right quadrant and this quadrant contained the cued location, then this microsaccade was classified as being directed toward the cued quadrant, and so on for other cue/microsaccade direction combinations.
Time course of microsaccade frequency and direction
We analyzed microsaccade frequency and direction, as described in detail in (Hafed et al., 2011), before and during SC inactivation (these analyses are described again below in brief form, for clarity and completeness). For the data during SC inactivation, we first divided the trials based on whether the cue was inside the region of visual space affected by the inactivation or outside (in which case the foil was in the affected region; also see Fig. 1B). Thus, we performed every analysis presented in this paper three times: once for pre-injection data, once for data with cue in the affected region, and once for data with foil in the affected region. Because the physical cue location was different for the “cue in” and “foil in” conditions (Fig. 1B), and because monkeys could exhibit some small idiosyncrasies in microsaccade directions regardless of cueing (Hafed et al., 2011), we also separated the pre-injection data into two groups: data when the cue was in the region to be affected by inactivation, and data when the foil was in the region to be affected by inactivation (see for example Fig. 6). This allowed us to compare the effects of inactivation to pre-injection effects for identical stimulus conditions, and regardless of small idiosyncrasies in the monkeys’ microsaccade behavior.
Figure 6.
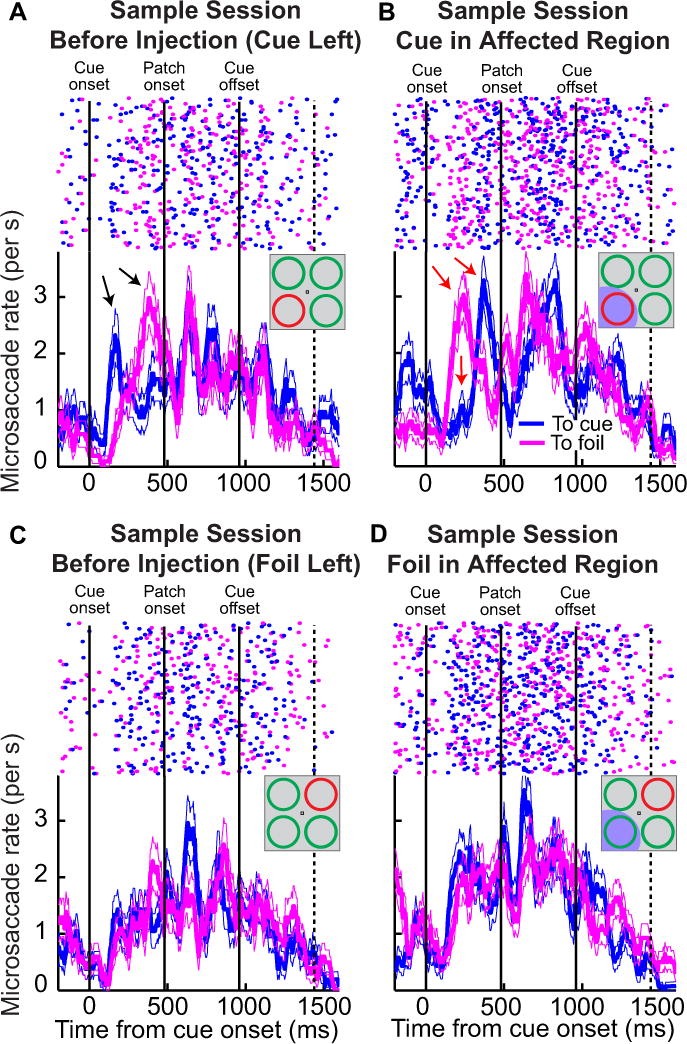
A demonstration of how SC inactivation altered microsaccade directional distributions in the covert attention task without necessarily altering microsaccade rate. For the same sample experiment of Fig. 3, we plotted in the bottom panels microsaccade rate as a function of time from cue onset (as in Fig. 3). However, in this figure, we separated movements as either being directed toward the cue (blue) or being directed toward the foil (magenta). To reduce clutter, we did not plot microsaccade rate for movements directed toward the other two quadrants (but see Figs. 8–10 for summaries of these). In the top panels, we show raster plots where each dot indicates the onset time of a microsaccade (x-axis) in a given trial (sorted on the y-axis). (A) Pre-injection data before SC inactivation of the lower left quadrant, and with the cue placed in the same quadrant. Cue onset induced a strong bias in microsaccade direction toward the cue followed by a bias in the opposite direction (black arrows). (B) During inactivation of the cued location, microsaccades after cue onset were biased away from the cued location (red arrows). Thus, even though microsaccades occurred at similar rates before and during inactivation (Fig. 3), the directional influence of the cue onset on microsaccades during inactivation was removed and there was instead a bias in favor of the opposite unaffected location. (C) With the foil in the region soon to be affected by SC inactivation, and the cue outside, pre-injection data showed that cue onset induced microsaccades in the direction of both cue and foil. This could reflect idiosyncracies for this particular visual quadrant compared to the stimulus configuration of A. (D) Importantly, this pattern was unaltered after SC inactivation with the foil in the affected region (i.e. the large directional redistribution seen in B relative to before injection was not present). Most notably, the blue curve shows that the cue, when it was in an unaffected region of space, was still effective in inducing microsaccades toward its location. Error bars denote s.e.m.
For analyzing microsaccade frequency, we obtained ‘rate’ curves estimating the instantaneous frequency of microsaccades as a function of time. To obtain such rates, we employed a running temporal bin of width 80 ms. In each such bin, we estimated the instantaneous rate, and we successively moved the bin center in 5-ms steps.
For analyzing microsaccade directions, we repeated the rate evolution analyses but on the ‘differential fraction of microsaccades’ that were directed toward a given quadrant. We obtained such differential fraction curves as described in (Hafed et al., 2011), but we repeat the description of this analysis here for clarity. Specifically, for each quadrant, we first obtained the frequency of microsaccades that were directed toward that quadrant as a function of time, regardless of cue location. We then measured the same frequency of movements but when the cue was either in the same quadrant, the opposite quadrant (meaning that the foil was in the same quadrant), or neither. The differential fraction curve was plotted as the difference between the two curves (with positive indicating a bias toward the quadrant caused by cueing and negative indicating a bias away from it). 95% confidence intervals for these directional evolution curves were estimated across all quadrants and all cue locations using a bootstrap of the entire array of detected microsaccades (1000 iterations, with replacement). This approach of obtaining a differential fraction of microsaccades directed toward a given quadrant (cued, foil, or neither) allowed us to isolate the directional modulations of microsaccades caused by attentional factors from possible inherent biases in direction that were sometimes idiosyncratically present in each monkey. For other analyses of microsaccade directions (e.g. Fig. 10), we also plotted the absolute frequency of microsaccades that were directed toward a given quadrant (cued, foil, or neither) within a given interval (i.e. not a differential fraction), and similar conclusions to those obtained with our differential fraction method were reached (Hafed et al., 2011).
Figure 10.
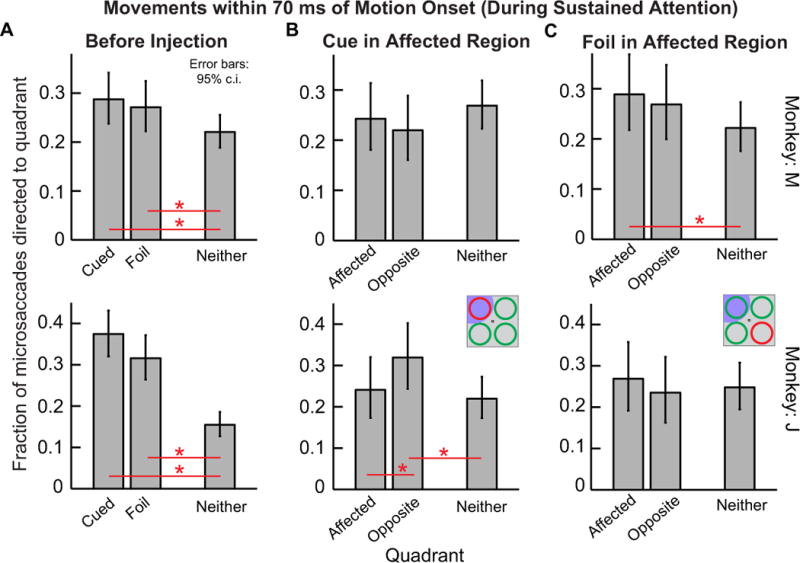
(A) Late microsaccades occurring near motion pulse onset had directions that reflected the behavioral relevance of the cued and foil locations (Hafed et al., 2011). Each panel shows that for movements temporally proximal to motion pulse onset (i.e. late in the trials after early stimulus-induced transients have subsided but before any other influence of motion pulses on the motor generation of microsaccades), the likelihood of observing a microsaccade in a given direction was significantly increased if this direction corresponded to the behaviorally relevant locations where motion stimuli were expected (cued and foil). For neither cued nor foil directions, the likelihood of microsaccades was less. (B) This effect was disrupted in both monkeys during SC inactivation with the cue placed in the affected region. Note how movements to the affected region were not more frequent than movements to ‘neither’ locations in both monkeys, and this was also true for the opposite location in monkey M. This elimination of behavioral biases to the cued and foil locations occurred as a result of a combination of reducing the movements toward the affected region of visual space as well as increasing movements to ‘neither’ quadrant, especially in monkey J. (C) The same analyses but now for the trials in which the foil was placed in the affected region. The data look more similar to the pre-injection results of A, especially in monkey M. Error bars indicate 95% confidence intervals. In each panel, the asterisk (*) identifies for which pair of conditions the difference between proportions was significantly different from zero (P<0.05).
We combined data from the saccade and button-press variants of the selective attention task when analyzing the influence of SC inactivation on microsaccades. Two main reasons justified doing this. First, the pre-injection behavior of microsaccades in both variants of the task (from trial onset and leading up to the response of the subject) was very similar. We confirmed this earlier by analyzing thousands of behavioral training trials from both tasks (Hafed et al., 2011), as well as by analyzing the pre-injection data from each of the 19 sessions of the present study. Second, the main effect of inactivation was hypothesized to be the disruption of directional biases in microsaccades caused by attentional allocation (see Results). Thus, to avoid the possibility that a lack of significant directional modulation of microsaccades during SC inactivation was due to small numbers of repetitions in a given analysis (rather than due to the effect of inactivation), we opted to include as large a data set as possible in the analysis. This increased our confidence in interpreting the effect of SC inactivation on microsaccade characteristics. This strategy was also justified given the extremely repeatable patterns of inactivation on behavioral performance observed in (Lovejoy & Krauzlis, 2010). For example, the analyses from that previous paper show that every single inactivation session resulted in a consistent pattern of changes to perceptual performance of the two monkeys.
Results
We trained two monkeys to perform a demanding covert visual attention task (Lovejoy & Krauzlis, 2010) (Figure 1A). In this task, a cue appeared at trial onset to indicate the location at which a perceptual discrimination target would appear sometime later during the trial. The monkeys’ instruction was to maintain fixation throughout the trial while covertly attending to the cued quadrant of visual space in anticipation of the perceptual discrimination stimulus. The discrimination stimulus consisted of a brief pulse of motion (160 ms) in one of four possible directions, with the coherence of the motion adjusted to titrate the difficulty of the discrimination. In addition, the onset of the perceptual discrimination stimulus was accompanied by a second ‘foil’ stimulus at the visual location diametrically opposite the cue. The foil also contained motion in one of the four eligible directions, at the same coherence as the cued stimulus, but because it was not at the cued location, it was irrelevant for correct performance in the task. As described in detail previously (Lovejoy & Krauzlis, 2010; Hafed et al., 2011), monkeys performed this task very well, correctly discriminating the cued stimulus on approximately 64% of trials. Moreover, the errors were not purely random but instead predominantly consisted of choices matching the ‘foil’ stimulus. Thus, the cued quadrant and the opposite one (containing the ‘foil’ stimulus) were the most relevant locations for the animals during the task.
Two previously published observations about the attention task of Fig. 1 provided critical motivation for using it in our current study. First, and as described in detail previously for tens of thousands of behavioral training trials from the same animals and task (Hafed et al., 2011), microsaccades during this task were correlated with the allocation of both transient and sustained covert attention required for successful behavioral performance (Hafed et al., 2011). Thus, the animals’ microsaccade behavior in the task exhibited the exact phenomenon for which we were investigating neurophysiological mechanisms. Second, we also showed recently that during SC inactivation, attentional performance in the same task, and with the same animals, was severely disrupted (Lovejoy & Krauzlis, 2010). Specifically, during SC inactivation, whenever the cue was placed in the affected region of visual space, the monkeys exhibited a deficit in allocating attention to that region. Instead, these monkeys tended to erroneously “attend” to the foil stimulus at the diametrically opposite location. Thus, SC inactivation altered the allocation of covert visual attention in the two monkeys, allowing us to ask in the current paper whether such alteration was also necessarily observed in the pattern of microsaccade directions.
In the remainder of this paper, we show that the normal pre-inactivation pattern of microsaccade directions observed in each monkey during our task was significantly altered when the peripheral SC region specifying the cued location of the display was reversibly inactivated. By also analyzing microsaccades when we inactivated a region other than the cued location, we also show that such influence of inactivation on microsaccades could be characterized as consisting of a general repulsion of the movements away from the region affected by the inactivation. Moreover, we show that these results were not accompanied by a concomitant reduction in microsaccade frequency, as might be expected from a motor impairment of microsaccade generation.
Microsaccade rate before and during SC inactivation
SC inactivation (at the peripheral eccentricities used for our stimuli) did not change the overall microsaccade rate or the distinctive time-varying pattern of microsaccade generation after cue onset. Before inactivation, microsaccade rate in each of the 19 experiments described in this study was similar to that observed in our earlier behavioral study (Hafed et al., 2011). Figure 3A, C shows microsaccade rate as a function of time from cue onset in one sample session (before inactivation) from monkey M. In these data, we plotted microsaccade rate separately for when the cue was in the lower left quadrant (panel A) or when it was in the upper right quadrant (panel C). For both of these locations, cue onset and the subsequent onset of a random dot motion stimulus 480 ms later each induced populations of microsaccades ~200–300 ms after the corresponding event. This is evident in the figure by the increase in microsaccade rate at 200–300 ms and again at 680–780 ms after trial onset (black arrows in panels A, C). In later epochs of the trials, microsaccade rate decreased in anticipation of the perceptual discrimination target, whose earliest possible time of appearance is indicated in Fig. 3A, C by the dashed vertical line. These results are similar to those obtained from the same monkey when analyzing many more behavioral training trials (Hafed et al., 2011), and they are also consistent across the experimental sessions specific to this study (pre-inactivation data from all experiments in this monkey) as well as in the pre-inactivation data of this study from the second monkey (J) (Fig. 5A, D, “before muscimol injection”, for each monkey). Thus, before inactivation, cue onset resulted in a stereotypical pattern of microsaccade occurrences in each monkey.
Figure 3.
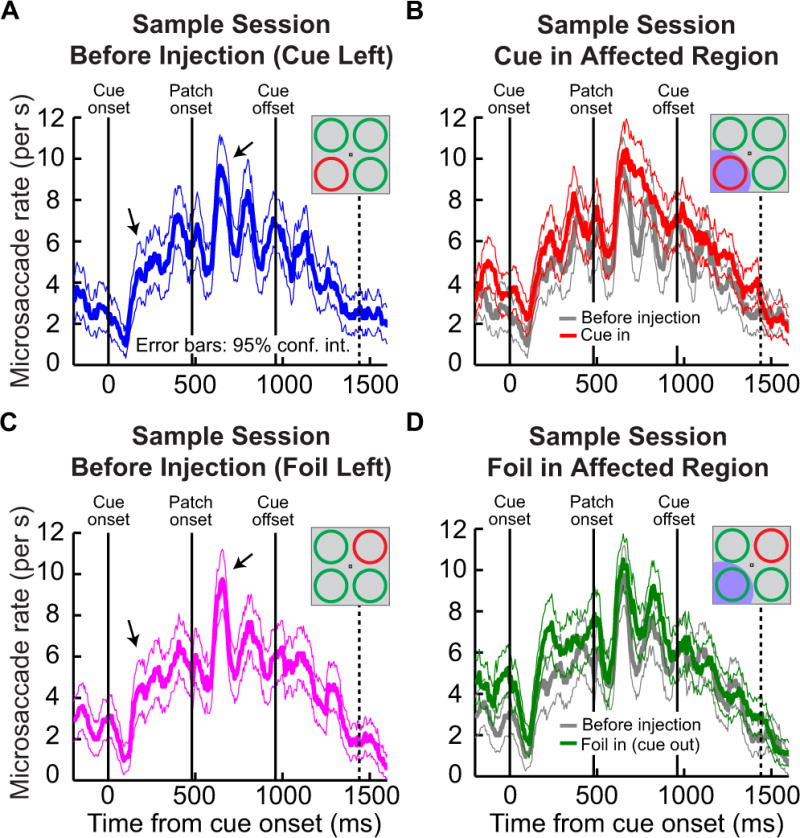
Microsaccade rate as a function of time from trial onset for a sample experimental session from monkey M. (A) Frequency of microsaccades before SC inactivation during the sample session when the cue was placed in the lower left quadrant. A stereotypical pattern of frequency modulation of microsaccades was observed, consistent with behavioral studies in humans and monkeys. Specifically, cue onset (time 0) and motion patch onset (time 480 ms) both induced subsequent populations of microsaccades ~200–300 ms later (black arrows). By the time the cues were removed (time 960) and the earliest possible onset of the brief motion pulse (dashed vertical line), microsaccade rate dropped as was found in this task with many more trials (Hafed et al., 2011). (B) Microsaccade rates observed during SC inactivation from the same sample session. The red curve shows the data during SC inactivation when the cue was in the affected region, and the gray curve is a replica of the data in panel A but included here to facilitate comparison. In both cases, microsaccade rate appeared similar to pre-injection rate. In this sample session, there were sporadic intervals in which microsaccade rate curves were higher during SC inactivation than before, but there was never a reduction in rate caused by the inactivation. (C) Similar to A but for the case when the cue was in the upper right quadrant (i.e. the foil was in the region soon to be affected by SC inactivation). (D) Similar to B except that now we plot in dark green the microsaccade rate when the cue was outside the affected region by SC inactivation (the foil stimulus was in the affected region). The gray curve is identical to that in panel C. Error bars indicate 95% confidence intervals.
Figure 5.
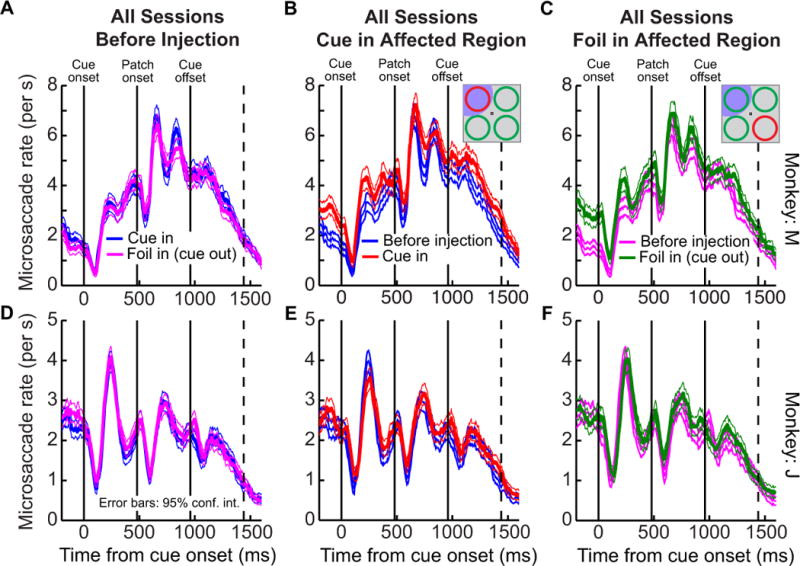
Summary of the effect of SC inactivation on microsaccade rate across experiments. The conventions of each panel are similar to those in Fig. 3. The top row shows microsaccade rate as a function of time from cue onset from all sessions in monkey M, and the bottom row shows data from all sessions in monkey J. In both monkeys, microsaccade rate appeared very similar, and exhibited similar time courses, to data without muscimol injection regardless of whether the SC region affected by inactivation represented the cue or the foil in the task. In monkey M, there was a modest increase in microsaccade rate during inactivation, consistent with the sample session of Fig. 3, but this increase was the same regardless of whether the cue or the foil was in the affected region, and the temporal dynamics of microsaccade rate were the same as those without muscimol injection. Thus, SC inactivation did not reduce microsaccade rate in the task, and otherwise had very minimal effects on such rate. Error bars indicate 95% confidence intervals. Note that in A, D, we separated pre-injection data according to whether the cue or foil was in the region soon to be affected by SC inactivation.
The distinctive temporal pattern of microsaccade generation observed in the pre-injection data from the sample session described above was largely unaffected by SC inactivation for our paradigm (at the peripheral eccentricities associated with our stimuli). For the sample experiment of Fig. 3A, C we injected muscimol (a GABA-A agonist) solution into the deep layers of the right SC, at a region corresponding to the lower-left quadrant of the visual stimulus of Fig. 1A. We then collected two sets of data after the injection. In the first set, we placed the cue in the lower-left quadrant – in the region of visual space affected by the SC inactivation – and placed the foil stimulus in the diagonally opposite, unaffected region of visual space. In the second data set, we switched locations, placing the foil in the affected region and placing the cue in the unaffected space (see Fig. 1B for an illustration of the stimulus layout relative to the inactivated site). As can be seen from Fig. 3B, D, microsaccade rate (and its time course after cue onset) when either the cue (red curve; Fig. 3B) or the foil (dark green curve; Fig. 3D) was in the affected region was similar to the corresponding pre-injection condition prior to the SC inactivation (gray curves in each panel, which are copied from the corresponding curves in panels A, C to facilitate comparisons). In fact, if anything, there may have been a subtle increase in microsaccade frequency during inactivation, but this effect was only sometimes observed. Thus, peripheral SC inactivation of either the cued or foil locations in this stimulus configuration did not reduce microsaccade rate, and it also caused no large changes in the temporal dynamics of this rate in relation to task events such as cue and motion patch onset.
For comparison, we also injected sterile saline solution, in a separate control experiment, in the same animal (this time in the region of the SC representing the upper-right quadrant of visual space). As can be seen from Fig. 4, which is presented in an identical format to that in Fig. 3 above, when saline solution was injected into the SC instead of muscimol, microsaccade rate exhibited the same temporal patterns as those seen in Fig. 3. This confirms that, under our task’s stimulus conditions, SC inactivation with muscimol did not dramatically alter the temporal patterns of microsaccades commonly observed after the cue. Also note that the saline injection was not associated with the small increase in microsaccade rate observed before cue onset in Fig. 3. This suggests that muscimol in that figure did not spread rostrally in the SC, which would be expected to reduce microsaccade rate rather than increase it (Hafed et al., 2009; Goffart et al., 2012).
Figure 4.
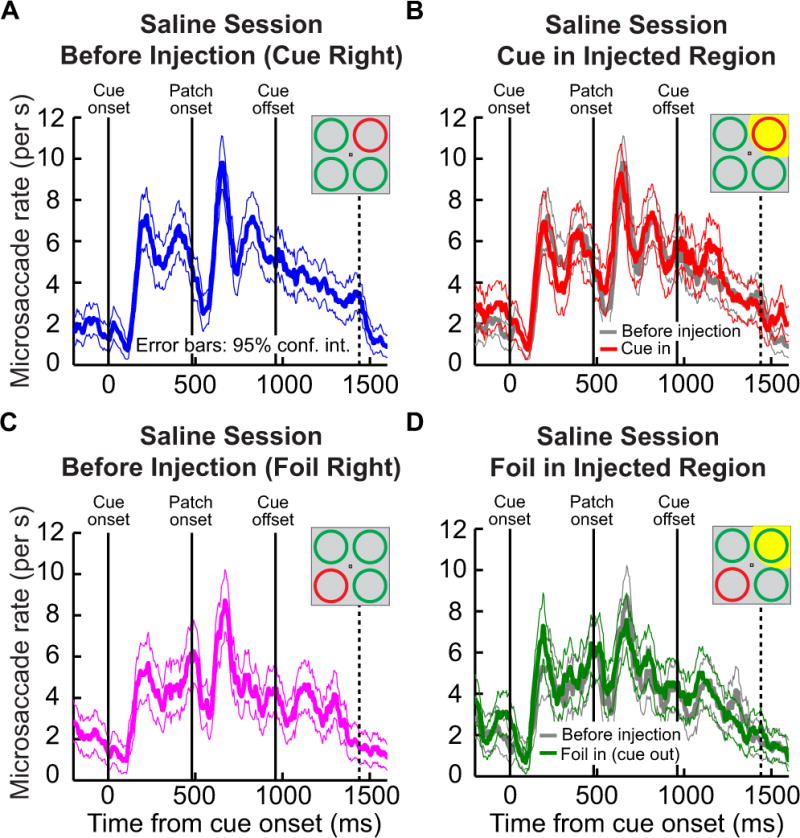
Microsaccade rate from the same monkey as in Fig. 3, but in our saline control experimental session. The figure shows data in an identical format to Fig. 3. Note that the saline injection was made in the upper right quadrant (indicated schematically in the insets of B, D). As can be seen, microsaccade rate was not affected by the saline injection. All conventions are identical to those in Fig. 3.
Finally, when we combined all muscimol injection sessions in the same monkey, we observed a similar pattern of results (Fig. 5A–C): the time course of microsaccades after cue onset was similar to the pre-inactivation time course, and there was a subtle increase in microsaccade frequency during some epochs. Critically, no evidence for a reduction of microsaccades was observed in all sessions (even before cue onset with only a single fixation spot on the display), as might be expected from a motor deficit in microsaccade generation if the inactivation had spread to more rostral regions implicated in the motor control of microsaccades (Hafed et al., 2009; Goffart et al., 2012). Similar analyses of the sessions collected from the second monkey (J) again revealed similar observations (Fig. 5D–F). Thus, for the stimulus configuration of our task, peripheral SC inactivation did not reduced microsaccade rate, and it did not change the temporal pattern of microsaccades after cue and motion patch onset.
Cue-induced biases in microsaccade direction before and during SC inactivation
Although there was a minimal change in the overall rate of microsaccades, SC inactivation at the peripheral eccentricities associated with our stimuli had a clear effect on the well-known directional biases in microsaccades caused by attentional cueing (Hafed & Clark, 2002; Hafed et al., 2011). We first illustrate this result for the sample session shown in Fig. 3 by separating movements based on whether they were directed toward the cued location (Fig. 6A, blue rate curves) or toward the foil location (Fig. 6A, magenta rate curves). This figure also includes ‘raster’ plots of microsaccade onset times, in which the horizontal position of each dot in the raster (x-axis) represents the onset time of a microsaccade and the vertical position (y-axis) represents trial number. The rasters are color-coded to match the rate curves below them and identify microsaccades either toward the cued quadrant (blue) or toward the foil quadrant (magenta). For clarity, we did not plot microsaccades directed toward neither the cue nor the foil (the remaining two quadrants of space) in this sample analysis, but we did include these movements in the summary figures described shortly.
Before SC inactivation and with the cue placed in the region soon to be affected by muscimol injection (Fig. 6A), the onset of the spatial cue first elicited an increase in movements toward the cue followed by an increase in movements away from the cue and toward the foil (black arrows). Thus, cue onset introduced a large bias in microsaccade direction during this session, as documented previously (Hafed et al., 2011). During SC inactivation, and with the cued location in the same, but now affected, region (Fig. 6B), this pattern was completely reversed – the initial bias of microsaccade directions after cue onset was now toward the foil and not the cue (red arrows). This finding demonstrates that even though inactivation of the peripheral SC in this sample experiment did not reduce overall microsaccade rate or change the overall temporal pattern of microsaccade generation (Fig. 3), it did cause a large redistribution in the directions of microsaccades (Fig. 6B). When the stimulus configuration was altered such that the foil was placed in the affected region of this sample SC inactivation instead of the cue, this large redistribution of microsaccade directions caused by inactivation did not occur (compare Fig. 6C and 6D), because the cue in the unaffected region of space was as effective in inducing microsaccades toward its location (Fig. 6D) as it was before the inactivation (Fig. 6C). The results from this sample session therefore indicate that cue-induced changes in microsaccade directions were mediated by cue-related activity in the peripheral SC; elimination of such activity through muscimol-induced inactivation altered the influence of the peripheral spatial cue on microsaccade directions.
We next confirmed that this effect was not a mechanical effect due to fluid injection into the neural tissue by repeating the exact same analysis but for our saline control injection of Fig. 4. The results were very different from those in Fig. 6, because the saline injection did not cause the massive reversal of microsaccade directions seen above with muscimol. This result is illustrated in Fig. 7 and is presented in a format identical to that of Fig. 6 above. Thus, the results of the two sample sessions of Figs. 6 and 7 combined suggest that muscimol inactivation of the peripheral SC in our task caused a significant alteration in cue-induced microsaccade directions.
Figure 7.
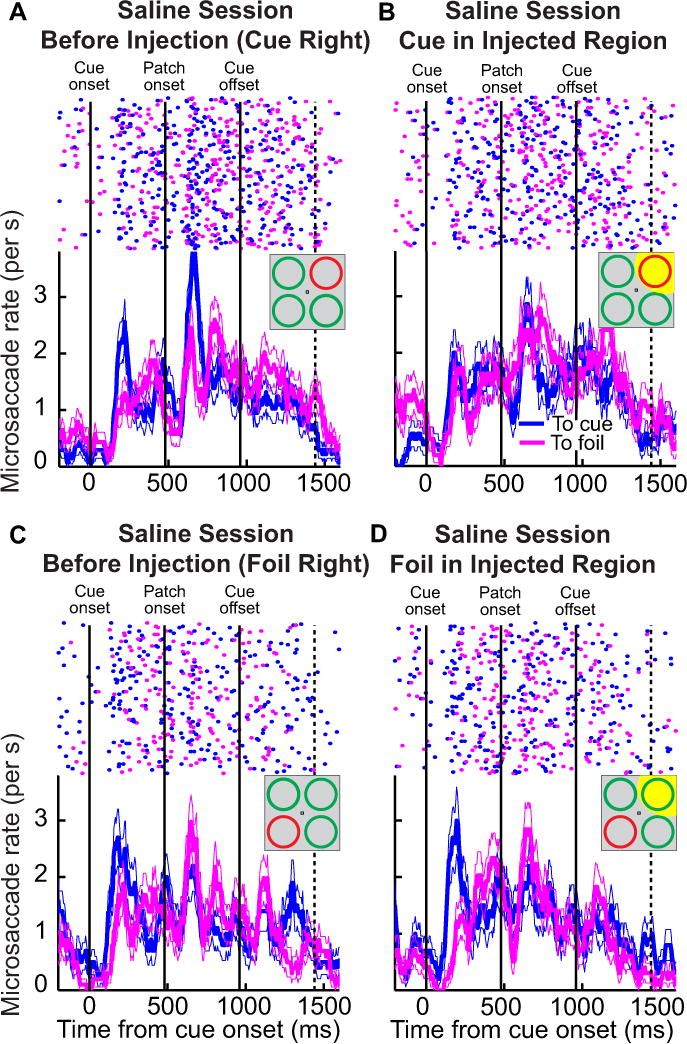
A demonstration of how saline injection did not redistribute microsaccade directions. This figure shows data in an identical format to Fig. 6, but for the experiment in the same animal with saline injection into the SC (same experiment as in Fig. 4). As can be seen, saline injection in either the cued or foil quadrant did not cause a major redistribution of microsaccade directions as that seen in Fig. 6B. All conventions in this figure are identical to those in Fig. 6.
The effect of peripheral SC inactivation on cue-induced changes in microsaccade directions was also observed consistently across sessions from this monkey. Figure 8 shows the results of analyzing microsaccade directions before and during SC inactivation for all experimental sessions involving monkey M. This analysis follows the approach from our previous behavioral study of microsaccades during this covert attention task (Hafed et al., 2011). Fig. 8A shows the data prior to SC inactivation for monkey M when the cue was placed in the region soon to be affected by SC inactivation. As can be seen, this panel illustrates how cue onset systematically biased microsaccades, first in the direction of the cue (blue peak) and then away from it (red peak). Movements toward neither the cued nor the foil locations (black curves) were not modulated by the cue, suggesting that microsaccade directions were mostly biased by the behaviorally relevant locations (Hafed et al., 2011). When the SC was inactivated and the cue was placed in the affected region (same as for the data shown in panel A), these directional oscillations of microsaccades were abolished (Fig. 8B), and specifically, there was no evident increase in microsaccades directed toward the cued location (compare blue curves in pre-injection and inactivation; Fig. 8A and Fig. 8B, left). Instead, there was an increase in movements toward the foil location after cue onset (Fig. 8B, middle, red curve), consistent with the sample session of Fig. 6. Moreover, this bias toward the foil peaked ~110 ms earlier than before injection (red peak in pre-injection data: 370 ms; red peak with cue in affected region: 260 ms). Thus, SC inactivation eliminated the normal directional bias when the cued stimulus was placed in the affected region, and in this monkey, shifted the directional bias away from the affected region in favor of the foil stimulus.
Figure 8.
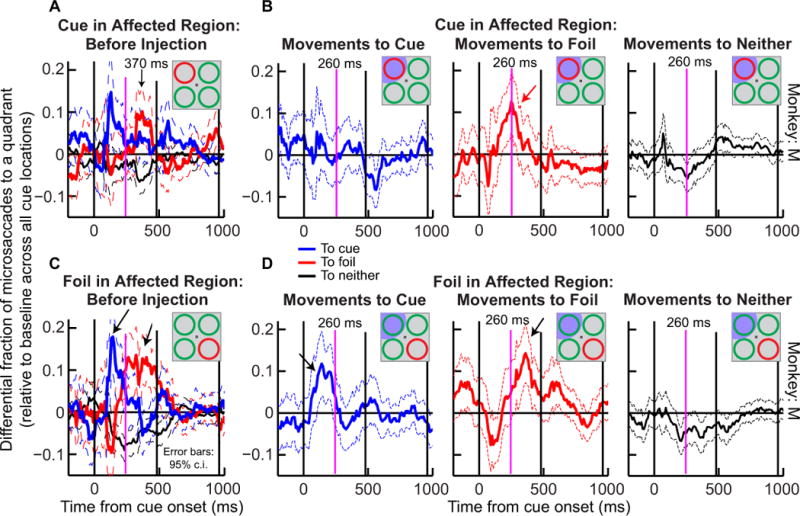
SC inactivation in monkey M disrupted the nominal influence of the cueing on microsaccade directions when the cue was in the affected region of space; it caused little change in microsaccades when the cue was in an unaffected region of space. For monkey M, we plotted the differential fraction of microsaccades that were directed toward a given quadrant when the quadrant was cued (blue), a foil (red), or completely irrelevant (black). Positive indicates a bias toward the indicated location. All panels show results from all sessions in the same monkey combined. Before muscimol injection (A), microsaccade directions preferentially switched between cued and foil locations and showed no particular bias toward the two irrelevant quadrants in the display. However, when the cue was in the affected region (B, left), this effect disappeared: the blue curve never showed a bias toward the cued quadrant during inactivation. Instead, movements to the foil increased (B, red curve, red arrow), and they did so earlier by ~110 ms (compare red peaks in A and B). When the foil was placed in the affected region instead of the cue (D), the general pattern of microsaccade direction oscillations was similar to that before injection (compare C and D). Error bars indicate 95% confidence intervals, and the red arrow highlights the key changes caused by SC inactivation. The three black vertical lines in each panel indicate cue onset, patch onset, and cue offset, respectively. In all panels, the magenta vertical lines identify the peak time of 260 ms in B and are shown to facilitate comparison of the timing changes in microsaccade biases caused by SC inactivation in the different conditions.
We repeated this analysis for the trials in which the foil was placed in the affected region of space instead of the cue. In these data, we reconfigured our stimulus such that the cued location was in a region of space unaffected by SC inactivation and the foil was in the region affected by it (Fig. 1B). Under these conditions, the monkey was fully able to allocate covert visual attention to the cued location (Lovejoy & Krauzlis, 2010). Consistent with the monkey’s behavioral performance, the correlation between microsaccade directions and the cued location showed a similar directional bias as in the pre-injection data (Fig. 8C, D). For example, the peak directional bias toward the cue occurred at ~140 ms after cue onset in Fig. 8D (left, blue curve) and at ~130 ms for the data collected before muscimol injections (Fig. 8C, blue curve). Similarly, the peak directional bias toward the foil occurred at ~360 ms after cue onset during inactivation (Fig. 8D, middle, red curve) and at ~370 ms during the pre-injection data (Fig. 8C, red curve). In addition, the durations of significant directional biases toward the cue and foil were similar in the two cases (compare Fig. 8C and 8D). This pattern of results is consistent with the changes observed in Fig. 8B when the cue was placed in the affected region by SC inactivation – when the foil was in the affected region of space, the inactivation-induced bias of microsaccade directions was again away from the inactivated region containing the foil and toward the unaffected region containing the cue.
In our earlier analysis of microsaccade directions in the second monkey (Hafed et al., 2011), we documented that this monkey exhibited behavioral differences from monkey M. For example, we noticed that in this second monkey, the initial bias in microsaccade directions after cue onset was first toward the foil and then back toward the cue (also shown in Fig. 9A, C from the present data set before SC inactivation). Despite this difference between the two monkeys, we found that SC inactivation again strongly disrupted microsaccade directions in monkey J during the attention task. Moreover, such disruption was consistent with a repulsion of microsaccade directions away from the inactivated region, as we observed in monkey M. To illustrate this, Fig. 9A, B plots the results from monkey J for the pre-injection (A) and post-injection (B) cases when the cue was placed in the affected region of SC inactivation, and Fig. 9C, D shows these results for when the foil was in the affected region. As just mentioned, pre-injection data in this monkey revealed that the initial cue-induced bias in microsaccade directions was first toward the foil (Fig. 9A, C, red curve) and then toward the cue (Fig. 9A, C, blue curve). During SC inactivation and when the cue was in the affected region, this modulation was again abolished (Fig. 9B, left, blue curve); there was instead a strong and rapid (~140 ms after cue onset) initial bias away from the cued location (red arrow) and an increase in movements toward neither the cue nor foil (Fig. 9B, right, black curve). This initial ‘bias away’ from the cued location and towards ‘neither’ locations occurred ~110 ms earlier than the earliest directional modulation peak observed in any direction without SC inactivation in this monkey (referenced by the magenta lines). When the foil was in the affected region (Fig. 9D), microsaccade directions were very similar to the pre-injection case (Fig. 9C), as in monkey M above, except that there was again a strong and rapid (~110 ms) bias away from the affected region, which in this case corresponded to the foil location (Fig. 9D, middle, red arrow). In addition, unlike monkey M, monkey J exhibited a stronger repulsion away from the affected region to the ‘neither’ stimulus locations than toward the diametrically opposite stimulus location, and he did so for both cue and foil in the affected region. Thus, the net effect of SC inactivation in this monkey was to reduce movements toward the affected region in favor of movements away from it (in this case, including the ‘neither’ locations and not just the diametrically opposite location as was the case in monkey M).
Figure 9.
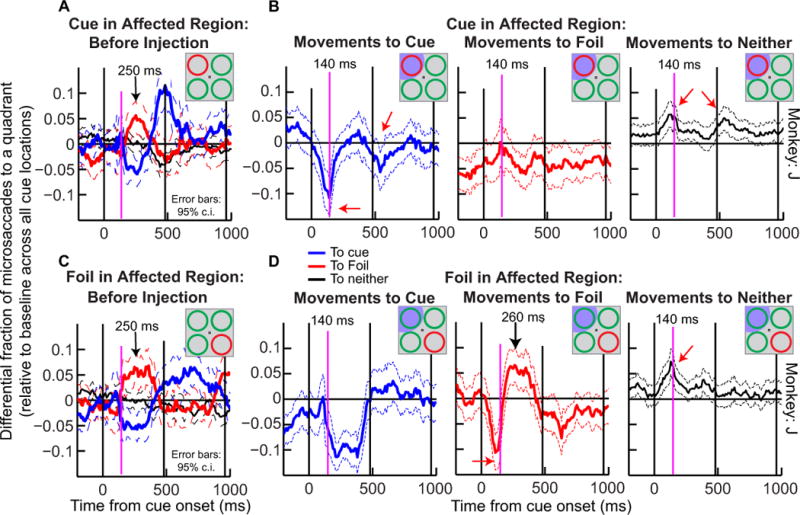
Similar results as in Fig. 8 were obtained for monkey J despite idiosyncratic differences in the pre-injection pattern of microsaccades in this monkey. We repeated the analysis of Fig. 8 but for monkey J. (A) Pre-injection behavior of microsaccades in this monkey when the cue was in the region soon to be affected by SC inactivation. The data showed an initial bias to the foil followed by a bias to the cue. During SC inactivation and with the cue in the affected region (B), there was never a microsaccade bias toward the cue. Instead, there was a rapid increase in movements to neither quadrant (black curve, right) and a concomitant rapid decrease in movements toward the cued quadrant (red arrow and magenta line in B, left). Thus, inactivating the SC at the cued location altered the influence of the cue on microsaccade directions, in a manner consistent with a ‘bias away’ from the affected region in favor of other locations (in this case, most notably the ‘neither’ locations). For the case in which the foil was placed in the affected region of SC inactivation (D) (the cue was thus in an unaffected region), the general pattern of microsaccade direction oscillations was similar to that before injection (shown in the C for the same cue location), suggesting that the cue’s influence on microsaccade directions was somewhat restored when the cue was placed in an unaffected region during SC inactivation. In addition, there was a stronger reduction in movements to the foil when it was placed in the affected region (red arrow in D, middle) associated with a concomitant increase in ‘neither’ movements at approximately the same time (magenta vertical line). All conventions are like in Fig. 8.
The directional time course analyses of Figs. 8 and 9 also revealed that in both monkeys, microsaccades at other times relative to cue onset could still be directed toward the affected region of space after SC inactivation. In particular, microsaccades with longer latencies after cue onset, when the expected effects of attention shifts would have subsided, were not impaired. For example, in Fig. 8D (middle) for monkey M, microsaccades with latencies of ~300–500 ms after cue onset were strongly biased toward the foil despite the inactivation of the foil stimulus location. Similarly, in Fig. 9D (middle) for monkey J, microsaccades with similar latencies after cue onset were also biased toward the foil location despite the inactivation at that location. Thus, consistent with the lack of reduction in microsaccade rate in both monkeys (Figs. 3–5), these results indicate that peripheral SC inactivation disrupted cue-induced microsaccade directions, but not necessarily the motor ability to generate microsaccades toward the affected region of visual space.
The above results in both monkeys may therefore be summarized as follows. In both animals, SC inactivation caused a net bias of microsaccade directions away from the visual quadrant affected by the inactivation. In monkey M, when the cue was placed in the inactivated region, this ‘bias away from the affected region’ acted to eliminate the original pre-injection bias towards the cue (Fig. 8B); when the foil was placed in the affected region instead, this same ‘bias away from the affected region’ acted to maintain the original pre-injection bias away from the foil (and towards the cue) (Fig. 8D). For monkey J, placing the cue in the affected region during inactivation caused a bias away from the cued location and toward the irrelevant ‘neither’ locations (Fig. 9B). When the foil was in the affected region, there was also a bias away from the foil location (Fig. 9D, middle, red arrow), and again toward the ‘neither’ locations. In both monkeys, muscimol-induced biases away from the inactivated region emerged ~110 ms earlier than the normal latencies of directional microsaccade biases that we observed without SC inactivation.
Peripheral SC inactivation and the correlation between sustained attention and microsaccade directions
The attention task required the monkeys to sustain attention for a prolonged interval prior to the presentation of the pulse of coherent motion. The normal behavioral patterns of errors without SC inactivation reveals that the monkeys paid particular attention to the cued and foil locations and less attention to the remaining two quadrants prior to the onset of the motion pulse (Lovejoy & Krauzlis, 2010). By analyzing microsaccade directions just around the onset of the motion pulse, we were able to document the potential influence of such sustained covert attentional allocation on microsaccade directions. Fig. 10A shows the results of this analysis in the pre-injection condition before inactivation. In this figure, we analyzed only microsaccades occurring within 70 ms from the onset of the motion pulse. Because this analysis interval was short and synchronized to trial end, it all but eliminated the inclusion of any cue- or stimulus-induced microsaccades like those described in earlier figures of this paper. Thus, the microsaccades in this analysis are not the same as those presented in Figs. 8, 9. Moreover, these microsaccades were not affected by the motion pulse itself, because they occurred too early (relative to motion pulse onset) for any potential influence of visual motion to affect their motor generation. Thus, these were microsaccades that occurred during the late “sustained attention” epochs in our trials and without any other stimulus or motor transients affecting them. Nonetheless, in both monkeys, these movements were again not randomly distributed, but were instead modulated by the behavioral relevance of the cue and foil: there was a higher frequency of microsaccades directed toward either the cued or foil locations at trial end than to neither location (Fig. 10A). This result is consistent with previous observations from the same two monkeys, albeit with many more behavioral trials (Hafed et al., 2011).
During peripheral SC inactivation, this bias of late microsaccades toward the behaviorally relevant cued and foil locations was disrupted. Figure 10B shows the distribution of microsaccade directions for movements occurring within 70 ms from motion pulse onset, but now during SC inactivation, and with the cue placed in the affected region. In this figure, we classified movements as being directed either toward the region affected by SC inactivation (cue), toward the quadrant diametrically opposite that region (foil), or toward ‘neither’ location. In both monkeys, the normal biases toward the cued and foil quadrants at the expense of ‘neither’ quadrants was all but eliminated after SC inactivation. Moreover, the individual monkey effects looked similar to the effects earlier in the early post-cue intervals of Figs. 8 and 9. For example, monkey J showed a pronounced increase in ‘neither’ movements relative to the case without muscimol injection, as was the case in Fig. 9, whereas monkey M did not show this effect so strongly. When the cue was in the unaffected region (Fig. 10C), microsaccade directions were more similar to the pre-injection data of Fig. 10A, especially in monkey M, although the rarity of movements near trial end (Hafed et al., 2011) meant that this observation did not always reach statistical significance. Thus, the results of Fig. 10 combined indicate that in both monkeys, inactivation disrupted the normal bias of late microsaccades, which was in favor of the behaviorally relevant stimulus locations (cue and foil) and against the irrelevant ones (‘neither’). Instead, the microsaccades that did occur near trial end in the task seemed to have equal likelihood of being directed toward the behaviorally relevant quadrants and toward the remaining two locations. These results, combined with our earlier observations in Figs. 8 and 9, indicate that peripheral SC inactivation had the effect of disrupting the correlations between microsaccades and both cue-induced (Figs. 8, 9) as well as sustained (Fig. 10) attentional allocation.
Discussion
Microsaccades in man and monkey have been recently found to exhibit predictable changes in rate and direction during a variety of experiments involving different aspects of cognition (Martinez-Conde et al., 2009; Rolfs, 2009; Hafed, 2011). However, the neural bases for these effects are so far unknown. In this paper, we investigated whether the primate SC plays a causal role in mediating the biases in microsaccade distribution seen with both exogenously driven and sustained attentional allocation. We analyzed the distribution and timing of microsaccades in a demanding covert attention task (Lovejoy & Krauzlis, 2010). We confirmed that microsaccades in this task were not randomly distributed, but exhibited modulations consistent with the interpretation that these movements reflect the influence of cues that guide covert attention (Hafed & Clark, 2002; Hafed et al., 2011). After focal muscimol injection at regions of the intermediate and deep layers of the SC corresponding to peripheral spatial locations, we found that inactivation did not reduce overall microsaccade rate with our stimulus configuration. Instead, inactivation had a significant impact on the distribution of microsaccade directions. Specifically, when attention was cued to the peripheral region of space affected by SC inactivation, the bias in microsaccade directions normally observed with spatial cues was disrupted. When attention was cued to another peripheral location, which was not affected by the SC inactivation, its effect on microsaccade direction dynamics was less dramatically impaired, and the observed changes in microsaccades relative to pre-injection behavior were explained by a disruption of microsaccade directions away from the inactivated region. These results indicate that the SC is at least partly responsible for the correlation between covert visual attention and microsaccades. In what follows, we discuss a possible mechanism for this observation, as well as its implications for the function of microsaccades during attentional cueing tasks.
A model explaining the influence of spatial cueing on microsaccades
Low-level modulations in SC activity during attention shifts are consistent with a model in which asymmetries in microsaccade directions (as seen in attentional cueing; see for example Figs. 8–10) can arise because of imbalances in SC activity across this structure’s two bilateral spatial maps. This idea is supported by two observations from a recent set of experiments in which we inactivated the rostral SC, representing foveal regions of space. First, rostral SC inactivation caused a reduction in microsaccade rate, suggesting that neurons exhibiting microsaccade-related activity recorded from the same SC region played a causal role in microsaccade generation (Hafed et al., 2009; Hafed & Krauzlis, 2012). Second, rostral SC inactivation caused a stable offset in eye position, supporting a model of gaze stabilization that is mediated at the level of the SC through balance in a bilateral retinotopic map of behaviorally-relevant goal locations (Hafed et al., 2008; 2009; Goffart et al., 2012). These two observations led us to hypothesize that microsaccades may be generated at the level of the SC as a result of imbalances in this structure’s entire bilateral retinotopic map during fixation (Hafed et al., 2009). Such imbalances are exactly what might be expected during the allocation of covert attention to the periphery, which is known to cause increases in low-frequency SC activity at attended locations relative to unattended ones (Kustov & Robinson, 1996; Ignashchenkova et al., 2004). With such asymmetry in the spatial pattern of activity across the SC, the center of mass of foveal SC activity may shift sufficiently away from bilateral balance that it exceeds the threshold to trigger a microsaccade (Hafed et al., 2009). Because these microsaccades directed toward the attended location shift the representation of the entire visual field, including the fixation stimulus, they could precipitate subsequent imbalances in the opposite direction, promoting a sequence of microsaccades toward and away from the attended location. When the SC is inactivated, the asymmetry caused by attentional allocation is eliminated or even reversed (Lovejoy & Krauzlis, 2010), explaining the directional redistribution of microsaccades that we observed. Thus, unlike inactivation of the rostral (or foveal) SC, which reduces microsaccade rate, the results from our current study demonstrate another way that SC activity contributes to microsaccade generation – by influencing the probability of triggering microsaccades, without necessarily affecting the motor generation of these movements.
For early cue-induced influences on microsaccades (Figs. 6–9), cue-induced visual bursts in the peripheral SC can also transiently modify activity patterns in the above-mentioned model to also explain why microsaccades are modulated during exogenously driven covert attention shifts (as in the initial microsaccade biases in Figs. 8–9). Specifically, in addition to the nominal goal representation of the fixated target in the above model, when a peripheral stimulus appears on the display, a strong visual burst is induced in the SC at the anatomical site in this structure representing the stimulus location. Moreover, the strength of this burst may be modulated by attention among other factors (Boehnke & Munoz, 2008). One possible mechanism for how abruptly appearing attentional cues can give rise to an initial bias in microsaccade directions is, thus, again through biasing the population average activity in the entire SC map – this time by introducing a transient increase in activity at the SC site corresponding to the peripheral cue location (and other possible transient changes in activity in other locations in the SC retinotopic map). Thus, the model of (Hafed et al., 2008; 2009), along with the transient changes in SC neurons that are expected to occur across the map as a result of cue and foil onset, can explain the patterns of results we obtained both with and without inactivation.
Independently of how peripheral SC activity can influence microsaccade directions, our results from the two monkeys, and their individual differences, may help further refine our understanding of the links between microsaccades and attention in general. For example, and as we documented earlier (Hafed et al., 2011), our two monkeys showed different patterns of microsaccades in the early cue-induced analysis intervals of Figs. 8 and 9. The fact that the monkeys behaved similarly later in the trials (Fig. 10) might hint at some possible reasons for the earlier differences. One such reason could be related to the task design, in which the monkeys knew with 100% certainty that no perceptual discrimination stimuli could appear before ~1500 ms after cue onset. Thus, it may be the case that each monkey adopted a different strategy of ‘covertly’ inspecting the stimulus array at the beginning of a trial, and that the patterns of microsaccades we observed in this epoch revealed this difference. Since a particular strategy was not reinforced this early in the trials, individual differences between the two monkeys in the initial stages of the trial are conceivable. In contrast, at the ends of the trials (Fig. 10), when paying attention to the relevant locations was behaviorally reinforced in both animals, both monkeys showed similar patterns of microsaccade directions, and this was true for both the normal behavior without SC inactivation (Fig. 10A) (Hafed et al., 2011) as well as during SC inactivation (Fig. 10B).
More importantly, the fact that SC inactivation resulted in a repulsion of microsaccade directions away from the affected region in both monkeys, despite their individual differences, supports the view that it is activity modulations in the peripheral SC that may be sufficient to bias the overall representation in the SC map and alter the triggering of microsaccades. This result may be interesting in light of recent behavioral observations of a clear dissociation between microsaccade rate and microsaccade directions during covert visual attention tasks (Pastukhov & Braun, 2010; Pastukhov et al., 2012). It would be interesting to further test such dissociation in light of our results, especially because we also saw clear differences between the effects of peripheral SC inactivation on microsaccade rate and microsaccade direction.
Implications for the role of microsaccades in vision
Finally, our results indicate that the multi-faceted role of the SC in vision, cognition, and oculomotor control contributes to the correlations between attentional cueing and microsaccades. In addition, these results can help explain the reproducible, almost machine-like, manner in which stimulus transients, such as attentional cues, induce microsaccades (Hafed et al., 2011): it arises because of the sensitivity of the SC to such transients as well as its proximity to the motor output. However, these results also raise the question of why such a relationship exists in the first place. Given that microsaccades cause transient extra-retinal changes in vision (Zuber & Stark, 1966; Beeler, 1967; Hafed & Krauzlis, 2010) and concomitant changes in visual responses in the brain, including at the level of the SC (Martinez-Conde et al., 2000; 2002; Martinez-Conde et al., 2006; Kagan et al., 2008; Bosman et al., 2009; Herrington et al., 2009; Hafed & Krauzlis, 2010), it may be the case that a system that biases when and where microsaccades are generated may provide optimum processing of peripheral visual locations during fixation. It would be interesting to explore whether and how individual microsaccades that are triggered in covert attention tasks may help ‘regularize’ the pattern of neuronal activity in different brain areas, and how that ultimately influences behavior in the task.
Acknowledgments
Z.M.H. was funded by the Werner Reichardt Centre for Integrative Neuroscience. L.P.L. was funded by the Institute for Neural Computation and the Aginsky Scholars Award Program. R.J.K. was funded by the National Institutes of Health (Grant EY12212) and the National Eye Institute Intramural Research Program at the National Institutes of Health.
References
- Beeler GW., Jr Visual threshold changes resulting from spontaneous saccadic eye movements. Vision Res. 1967;7:769–775. doi: 10.1016/0042-6989(67)90039-9. [DOI] [PubMed] [Google Scholar]
- Boehnke SE, Munoz DP. On the importance of the transient visual response in the superior colliculus. Curr Opin Neurobiol. 2008;18:544–551. doi: 10.1016/j.conb.2008.11.004. [DOI] [PubMed] [Google Scholar]
- Bosman CA, Womelsdorf T, Desimone R, Fries P. A microsaccadic rhythm modulates gamma-band synchronization and behavior. J Neurosci. 2009;29:9471–9480. doi: 10.1523/JNEUROSCI.1193-09.2009. [DOI] [PMC free article] [PubMed] [Google Scholar]
- Chen LL, Goffart L, Sparks DL. A simple method for constructing microinjectrodes for reversible inactivation in behaving monkeys. Journal of neuroscience methods. 2001;107:81–85. doi: 10.1016/s0165-0270(01)00354-5. [DOI] [PubMed] [Google Scholar]
- Engbert R, Kliegl R. Microsaccades uncover the orientation of covert attention. Vision Res. 2003;43:1035–1045. doi: 10.1016/s0042-6989(03)00084-1. [DOI] [PubMed] [Google Scholar]
- Goffart L, Hafed ZM, Krauzlis RJ. Visual fixation as equilibrium: evidence from superior colliculus inactivation. Journal of Neuroscience. 2012;32:10627–10636. doi: 10.1523/JNEUROSCI.0696-12.2012. [DOI] [PMC free article] [PubMed] [Google Scholar]
- Hafed ZM. Mechanisms for generating and compensating for the smallest possible saccades. Eur J Neurosci. 2011;33:2101–2113. doi: 10.1111/j.1460-9568.2011.07694.x. [DOI] [PubMed] [Google Scholar]
- Hafed ZM, Clark JJ. Microsaccades as an overt measure of covert attention shifts. Vision Res. 2002;42:2533–2545. doi: 10.1016/s0042-6989(02)00263-8. [DOI] [PubMed] [Google Scholar]
- Hafed ZM, Goffart L, Krauzlis RJ. Superior colliculus inactivation causes stable offsets in eye position during tracking. J Neurosci. 2008;28:8124–8137. doi: 10.1523/JNEUROSCI.1317-08.2008. [DOI] [PMC free article] [PubMed] [Google Scholar]
- Hafed ZM, Goffart L, Krauzlis RJ. A neural mechanism for microsaccade generation in the primate superior colliculus. Science. 2009;323:940–943. doi: 10.1126/science.1166112. [DOI] [PMC free article] [PubMed] [Google Scholar]
- Hafed ZM, Krauzlis RJ. Goal representations dominate superior colliculus activity during extrafoveal tracking. J Neurosci. 2008;28:9426–9439. doi: 10.1523/JNEUROSCI.1313-08.2008. [DOI] [PMC free article] [PubMed] [Google Scholar]
- Hafed ZM, Krauzlis RJ. Microsaccadic suppression of visual bursts in the primate superior colliculus. J Neurosci. 2010;30:9542–9547. doi: 10.1523/JNEUROSCI.1137-10.2010. [DOI] [PMC free article] [PubMed] [Google Scholar]
- Hafed ZM, Krauzlis RJ. Similarity of superior colliculus involvement in microsaccade and saccade generation. J Neurophysiol. 2012;107:1904–1916. doi: 10.1152/jn.01125.2011. [DOI] [PMC free article] [PubMed] [Google Scholar]
- Hafed ZM, Lovejoy LP, Krauzlis RJ. Modulation of microsaccades in monkey during a covert visual attention task. Journal of Neuroscience. 2011;31:15219–15230. doi: 10.1523/JNEUROSCI.3106-11.2011. [DOI] [PMC free article] [PubMed] [Google Scholar]
- Herrington TM, Masse NY, Hachmeh KJ, Smith JE, Assad JA, Cook EP. The effect of microsaccades on the correlation between neural activity and behavior in middle temporal, ventral intraparietal, and lateral intraparietal areas. J Neurosci. 2009;29:5793–5805. doi: 10.1523/JNEUROSCI.4412-08.2009. [DOI] [PMC free article] [PubMed] [Google Scholar]
- Ignashchenkova A, Dicke PW, Haarmeier T, Thier P. Neuron-specific contribution of the superior colliculus to overt and covert shifts of attention. Nat Neurosci. 2004;7:56–64. doi: 10.1038/nn1169. [DOI] [PubMed] [Google Scholar]
- Kagan I, Gur M, Snodderly DM. Saccades and drifts differentially modulate neuronal activity in V1: effects of retinal image motion, position, and extraretinal influences. J Vis. 2008;8:19, 11–25. doi: 10.1167/8.14.19. [DOI] [PubMed] [Google Scholar]
- Krauzlis RJ, Miles FA. Release of fixation for pursuit and saccades in humans: evidence for shared inputs acting on different neural substrates. J Neurophysiol. 1996;76:2822–2833. doi: 10.1152/jn.1996.76.5.2822. [DOI] [PubMed] [Google Scholar]
- Kuang X, Poletti M, Victor JD, Rucci M. Temporal encoding of spatial information during active visual fixation. Current biology: CB. 2012;22:510–514. doi: 10.1016/j.cub.2012.01.050. [DOI] [PMC free article] [PubMed] [Google Scholar]
- Kustov AA, Robinson DL. Shared neural control of attentional shifts and eye movements. Nature. 1996;384:74–77. doi: 10.1038/384074a0. [DOI] [PubMed] [Google Scholar]
- Lovejoy LP, Krauzlis RJ. Inactivation of primate superior colliculus impairs covert selection of signals for perceptual judgments. Nat Neurosci. 2010;13:261–266. doi: 10.1038/nn.2470. [DOI] [PMC free article] [PubMed] [Google Scholar]
- Martinez-Conde S. Fixational eye movements in normal and pathological vision. Prog Brain Res. 2006;154:151–176. doi: 10.1016/S0079-6123(06)54008-7. [DOI] [PubMed] [Google Scholar]
- Martinez-Conde S, Macknik SL, Hubel DH. Microsaccadic eye movements and firing of single cells in the striate cortex of macaque monkeys. Nat Neurosci. 2000;3:251–258. doi: 10.1038/72961. [DOI] [PubMed] [Google Scholar]
- Martinez-Conde S, Macknik SL, Hubel DH. The function of bursts of spikes during visual fixation in the awake primate lateral geniculate nucleus and primary visual cortex. Proc Natl Acad Sci U S A. 2002;99:13920–13925. doi: 10.1073/pnas.212500599. [DOI] [PMC free article] [PubMed] [Google Scholar]
- Martinez-Conde S, Macknik SL, Troncoso XG, Dyar TA. Microsaccades counteract visual fading during fixation. Neuron. 2006;49:297–305. doi: 10.1016/j.neuron.2005.11.033. [DOI] [PubMed] [Google Scholar]
- Martinez-Conde S, Macknik SL, Troncoso XG, Hubel DH. Microsaccades: a neurophysiological analysis. Trends Neurosci. 2009;32:463–475. doi: 10.1016/j.tins.2009.05.006. [DOI] [PubMed] [Google Scholar]
- Pastukhov A, Braun J. Rare but precious: microsaccades are highly informative about attentional allocation. Vision Res. 2010;50:1173–1184. doi: 10.1016/j.visres.2010.04.007. [DOI] [PubMed] [Google Scholar]
- Pastukhov A, Vonau V, Stonkute S, Braun J. Spatial and temporal attention revealed by microsaccades. Vision research. 2012 doi: 10.1016/j.visres.2012.11.004. [DOI] [PubMed] [Google Scholar]
- Rizzolatti G, Riggio L, Sheliga BM. Space and selective attention. In: Umilta C, Moscovitch M, editors. Attention and performance XV. MIT press; cambridge: 1994. pp. 231–265. [Google Scholar]
- Rolfs M. Microsaccades: small steps on a long way. Vision Res. 2009;49:2415–2441. doi: 10.1016/j.visres.2009.08.010. [DOI] [PubMed] [Google Scholar]
- Sheliga BM, Riggio L, Rizzolatti G. Orienting of attention and eye movements. Exp Brain Res. 1994;98:507–522. doi: 10.1007/BF00233988. [DOI] [PubMed] [Google Scholar]
- Zenon Z, Krauzlis RJ. Attention deficits without cortical neuronal deficits. Nature. 2012;489:434–437. doi: 10.1038/nature11497. [DOI] [PMC free article] [PubMed] [Google Scholar]
- Zuber BL, Stark L. Saccadic suppression: elevation of visual threshold associated with saccadic eye movements. Exp Neurol. 1966;16:65–79. doi: 10.1016/0014-4886(66)90087-2. [DOI] [PubMed] [Google Scholar]