

Abstract
Colony stimulating factor 2 receptor, beta (CSF2RB) is the shared subunit of receptors for interleukin 3 (IL3), colony stimulating factor 2 (CSF2) and IL5, and is responsible for the initiation of signal transduction triggered by ligand binding. In our previous study, we showed the evidence that the IL3 gene is associated with schizophrenia and the associations observed are sex-specific and dependent on family history (FH). In this article, we studied 10 single-nucleotide polymorphisms in the CSF2RB gene in the Irish Study of High-Density Schizophrenia Families (ISHDSF) and the Irish Case – Control Study of Schizophrenia (ICCSS), and tested allele and haplotype associations with schizophrenia. Using the pedigree disequilibrium test, we found that two markers (rs11705394 and rs7285064) reached nominal significance. In sex-stratified analyses, for both the markers the association signals were mainly derived from male subjects. In the ICCSS sample, we found that several markers (rs2072707, rs2284031 and rs909486) showed sex-specific and FH-dependent associations with schizophrenia. In multimarker haplotype analyses, both ISHDSF and ICCSS samples showed globally significant associations in multiple linkage disequilibrium (LD) blocks sharing minimal LD. Since CSF2RB is essential for IL3 signaling, the findings that both IL3 and CSF2RB showed sex-specific and FH-dependent associations suggest that the IL3 pathway is involved in schizophrenia.
Keywords: interleukin 3, colony stimulating factor, receptor, schizophrenia, association, family history, sex
Introduction
Schizophrenia is a complex psychiatric disorder. It is now clearly established that genetic factors play a major role in its etiology. Linkage studies have suggested that many genomic regions harbor risk factors for schizophrenia.1 In our previous fine mapping of linkage peak at 5q21–31 with the Irish Study of High-Density Schizophrenia Families (ISHDSF) sample, we found that haplotypes spanning a large genomic interval were associated with schizophrenia.2 There are several genes in this region including SPEC2, PDZ-GEF2, ACSL6 and interleukin 3 (IL3). We found that IL3 is associated with the disease in three independent samples including family and case – control samples, and the associations of IL3 are sex-specific and dependent on family history (FH).3
Immunological abnormalities have been found to be associated with schizophrenia for decades and there are hypotheses proposing that the immune system is involved in the etiology of schizophrenia.4–6 Changes in activities of cytokines, cytokine receptors and cytokine activity modifiers have been reported in the serum and cerebrospinal fluid of schizophrenic patients.7–9 Several genetic variants in cytokines have been associated with the pathogenesis of schizophrenia.10–14 These findings suggest that cytokines and/or their receptors may be relevant to the development of schizophrenia, though some contradictory results were also reported.15
IL3 is a major component of immune system and plays a critical role in the development and differentiation of all hematopoietic cell types.16,17 IL3 and other cytokines have been found to have neurotrophic activities and to be associated with neurologic disorders,18–21 suggesting their complex role in the central nervous system (CNS). IL3 is one of the major factors that activate the microglia in the brain.21 Activated microglia lead to inflammatory responses in the brain, and some researchers have suggested that such inflammatory processes contribute to the etiology of schizophrenia.22 Clinical studies show that IL3 activity may be lower in schizophrenia patients.23 IL3 could potentially be involved in the pathophysiology of schizophrenia. We have reported that variants in and around IL3 are associated with schizophrenia in Irish samples. Shortly after our study, an independent group reported that CSF2RA and IL3RA, the IL-specific receptor subunits for colony stimulating factor 2 (CSF2) and IL3, respectively, are associated with schizophrenia.24
The human IL3 receptor is a heterodimeric structure, consisting of an IL3-specific alpha subunit (IL3RA) and a common beta subunit shared with CSF2 and IL5. The shared beta subunit is encoded by the colony stimulating factor 2 receptor, beta (CSF2RB) gene. IL5 and CSF2 each have a unique alpha receptor subunit (IL5RA and CSF2RA, respectively) that only binds its specific ligand. The shared common beta receptor (also known as βc) is required for signal transduction and high-affinity ligand binding.25–27 However, βc alone is not able to bind any of the cytokines. Once the cytokines are bound to their specific alpha subunits, βc is recruited to engage the cytokines, thereby providing the necessary physical and conformational proximity of the alpha and beta subunits to initiate intracellular signaling.
The CSF2RB gene is mapped to chromosome 22q12.3 close to a region that independently shows linkage to schizophrenia in several studies.1,28 CSF2RB is about 17 kb in length, containing 14 exons. It is critical for the activation of both the JAK/STAT (JAK2, STAT5) and MAP kinase pathways.26,27 Using trans genic mice, D’Andrea et al.29 found that mutations in the CSF2RB gene may play a role in the pathogenesis of myeloproliferative disorders In addition, the transgenic mice developed a sporadic, progressive neurologic disorder and displayed bilateral, symmetrical foci of necrosis in the white matter of the brainstem associated with an accumulation of macrophages.29 Thus, chronic CSF2RB activation has the potential to contribute to pathologic events in the CNS. Considering that both IL3 and IL3RA are reported to be associated with schizophrenia and that IL3 and IL3RA alone cannot form a functional receptor to transduce signal, CSF2RB becomes an attractive candidate gene for schizophrenia. Based on these rationales, we initiated the study of the CSF2RB gene, seeking further evidence whether IL3 signaling is involved in the disease.
Materials and Methods
Subjects
In this study, we used the ISHDSF and Irish Case – Control Study of Schizophrenia (ICCSS) samples, which were also used in our previous IL3 association study. The ISHDSF was collected in Northern Ireland, the United Kingdom and the Republic of Ireland. Phenotypes were assessed using the Diagnostic and Statistical Manual of Mental Disorders (DSM)-III-R. The diagnoses were formed into a hierarchy of 10 categories, reflecting the probable genetic relationship of these syndromes to classic schizophrenia. This hierarchy consisted of three definitions of affection: (i) narrow—categories D1 and D2, or ‘core schizophrenia,’ schizophrenia, poor-outcome schizoaffective disorder and simple schizophrenia; (ii) Intermediate—categories D1–D5, or a narrow definition of the schizophrenia spectrum, adding to the narrow definition schizotypal personality disorder, schizophreniform disorder, delusional disorder, atypical psychosis and good-outcome schizoaffective disorder; (iii) broad—categories D1–D8, including all disorders that significantly aggregated in relatives of schizophrenic probands in the Roscommon Family Study30 and adding to the intermediate definition mood incongruent and mood congruent psychotic affective illness, and paranoid, avoidant and schizoid personality disorder. The final inclusion criteria for pedigrees in the ISHDSF sample required two or more first, second or third degree relatives with a diagnosis of D1–D5, one or more of whom had a D1–D2 diagnosis. The sample contained 273 pedigrees and about 1350 subjects had DNA sample for genotyping. Of them, 515 were diagnosed with the narrow definition (351 males and 164 females), 634 were diagnosed with the intermediate definition and 686 were diagnosed with the broad definition. Detail descriptions of the sample were published previously.31
The ICCSS sample was collected in the same geographic regions as that of the ISHDSF sample. For this study, we used 655 affected cases (436 males and 219 females) and 626 controls (354 males, 269 females and 3 unknown). The affected subjects were selected from in-patient and outpatient psychiatric facilities in the Republic of Ireland and Northern Ireland. Subjects were eligible for inclusion if they had a diagnosis of schizophrenia or poor-outcome schizoaffective disorder by DSM-III-R criteria, which were confirmed by a blind expert diagnostic review. Controls, selected from several sources, including blood donation centers, were included if they denied a lifetime history of schizophrenia. Both cases and controls were included only if they reported all four grandparents as being born in Ireland or the United Kingdom. FH, based on the Family History Research Diagnostic Criteria,32 was assessed by clinical interview of probands and their relatives. Subjects having a first- or second-degree relative diagnosed with schizophrenia were classified as FH positive. In the ICCSS sample, there were 102 subjects (63 males and 39 females) who met these criteria for a positive FH of schizophrenia. The sex of the subjects was determined experimentally by genotyping three X-specific (rs320991, rs321029 and rs6647617) and three Y-specific (rs1558843, rs2032598 and rs2032652) single-nucleotide polymorphisms (SNPs) because most of the controls were obtained from blood donation centers and the sex of the donors was not available to us. Subjects with XXY (nine subjects, four cases and five controls) and XYY (one case) genotypes were classified as males.
SNP selection and genotyping
We used the HapMap data and the available assays developed by Applied BioSystems Corporation (Foster City, CA, USA) to assist in our selection of markers. We selected tag SNPs that cover haplotypes with the frequency > 1%. A total of 10 SNPs were used in this study. Eight SNPs are in the intron and two (rs7285064 and rs131840) in the exon. Their positions in the gene were shown in (Figure 1). The selected SNPs were developed by Applied BioSystems Corporation. All genotyping was conducted with the TaqMan method.33 Genotypes were scored using an Excel Template developed in our lab. All typed SNPs were checked for the Mendelian consistency and Hardy – Weinberg equilibrium (HWE).34
Figure 1.
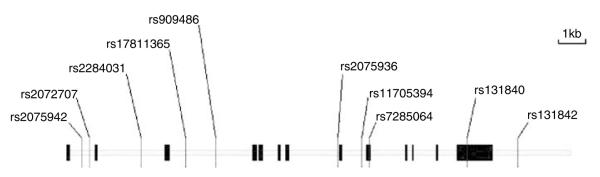
Genomic structure and location of genotyped SNPs in the csf2rb gene. Csf2rb spans over 17.6 kb genomic DNA and contains 14 exons (vertical bars). The gene is transcribed from left to right. Ten markers were genotyped in this study.
Statistical analyses
We used the pedigree disequilibrium test (PDT)35 as implemented in the UNPHASED36 program (PDTPHASE module, version 2.404) to analyze the ISHDSF sample. For each typed SNP, the PDT program was run for the narrow, intermediate and broad disease definitions. In these analyses, both vertical and horizontal transmissions were included. The P-values reported were based on weighting all families equally (the ave option in the program). In multilocus haplotype analyses, we used 10 restarts for the expectation-maximization algorithm37 and used 1% as the cutoff for minor haplotypes. In multimarker haplotype analyses, we restricted our analyses to those haplotypes that were observed at least once in our dataset since the LDs in the gene were modest. For the case – control sample, χ2 tests were performed for each SNP for allelic and genotypic associations. For haplotype analyses, the COCAPHASE module of the UNPHASED program36 was used to analyze multimarker haplotype associations. As in the family sample, haplotypes with frequencies of < 1% were aggregated. For all tests, global and individual haplotype tests were performed simultaneously and P-values were obtained from the χ2 distribution. To be consistent with the ISHDSF sample, we limited our analyses to only those haplotypes observed in our dataset at least once. In sex-stratified analyses, only male or female subjects (ICCSS) or affected offspring (ISHDSF) was used. For FH conditioned analyses, all affected subjects without positive FH were set to unknown affection status. We used the HAPLOVIEW program38 to estimate pairwise linkage disequilibrium (LD) and to illustrate haplotype blocks. The haplotype blocks were partitioned by the confidence interval algorithm.39 To assess the false positive rate of the tests, we used the Q-value program,40 and used all P-values we obtained for each of the ISHDSF and ICCSS samples. We used both the default setting and individually adjusted setting to evaluate the π0.
Results
LD structure of ISHDSF and ICCSS samples
In this study, we typed 10 SNPs in both the ISHDSF and ICCSS samples. We examined LD and haplotype structure for both the samples with the HAPLOVIEW program. Overall, the two samples had similar LD structure (Figure 2); these samples formed 3 LD blocks and the partitions of the blocks were similar. Markers 1–2 and 3–5 formed two LD blocks, respectively, and they had reasonable LD with one another. Markers 6–9 formed the third LD block and had high LD with each other but low LD with markers 1–5 in the other two LD blocks. When haplotypes were examined, the major haplotypes were observed in both the samples, but the frequencies varied (data not shown).
Figure 2.

The comparison of pairwise linkage disequilibrium (LD) between the ISHDSF (a) and ICCSS (b) samples. The LDs (D’) were computed by the HAPLOVIEW program.
Association analyses of the ISHDSF sample
Marker information and allele frequencies were presented in Table 1. The genotype frequencies of all 10 markers studied were in accordance with the HWE. Using PDT, we found that two markers (rs11705394 and rs7285064) reached 5% significance level with at least one diagnostic definition. The marker rs11705394 is in intron 8, while rs7285064 is a synonymous polymorphism in exon 9.
Table 1.
Marker characteristics and single marker associations (P-values) in the ISHDSF sample
| Marker | Marker id | Distance | Functional |
Polymorphism
(minor allele) |
Freq | HWE P-value | Narrow | Intermediate | Broad |
|---|---|---|---|---|---|---|---|---|---|
| rs2075942 | 1 | 0 | Intron | C/T (T) | 0.488 | 0.883 | 0.476 | 0.500 | 0.504 |
| rs2072707 | 2 | 302 | Intron | G/T (T) | 0.382 | 0.997 | 0.635 | 0.614 | 0.512 |
| rs2284031 | 3 | 2301 | Intron | C/T (T) | 0.435 | 0.782 | 0.743 | 0.705 | 0.707 |
| rs17811365 | 4 | 4041 | Intron | G/T (G) | 0.077 | 0.412 | 0.577 | 0.962 | 0.963 |
| rs909486 | 5 | 5209 | Intron | C/T (T) | 0.438 | 0.815 | 0.969 | 0.978 | 0.978 |
| rs2075936 | 6 | 9972 | Intron | A/G (G) | 0.417 | 0.310 | 0.991 | 0.435 | 0.595 |
| rs11705394 | 7 | 10897 | Intron | C/T (C) | 0.325 | 0.050 | 0.052 | 0.024 | 0.146 |
| rs7285064 | 8 | 11220 | Exon (synonymous) | C/T (T) | 0.293 | 0.574 | 0.048 | 0.076 | 0.213 |
| rs131840 | 9 | 15015 | Exon (synonymous) | A/G (A) | 0.193 | 0.238 | 0.211 | 0.550 | 0.779 |
| rs131842 | 10 | 16994 | 3′ | A/G (G) | 0.154 | 1.000 | 0.652 | 0.559 | 0.957 |
Abbreviations: HWE, Hardy – Weinberg equilibrium; ISHDSF, Irish Study of High Density Schizophrenia Families.
P-values ≤0.05 were in bold.
Based on our previous study of IL3, we performed sex-stratified analyses. The results of these stratified analyses were summarized in Table 2. We found that the same two markers were significant in the male subjects, but not significant in the female subjects. The sex-stratified analyses demonstrated more significant association, suggesting that almost all association signals were derived from male offspring. Sex-stratified analyses with the intermediate and broad definitions produced similar results (Table 2).
Table 2.
Sex-stratified associations (PDT P-values) in the ISHDSF sample
| Marker | Narrow |
Intermediate |
Broad |
|||
|---|---|---|---|---|---|---|
| Male | Female | Male | Female | Male | Female | |
| rs2075942 | 0.500 | 0.112 | 0.195 | 0.229 | 0.328 | 0.045 |
| rs2072707 | 0.540 | 0.282 | 0.659 | 0.344 | 0.754 | 0.076 |
| rs2284031 | 0.715 | 0.259 | 0.435 | 0.306 | 0.533 | 0.075 |
| rs17811365 | 0.719 | 0.496 | 0.444 | 0.989 | 0.628 | 0.913 |
| rs909486 | 0.736 | 0.516 | 0.497 | 0.675 | 0.699 | 0.199 |
| rs2075936 | 0.426 | 0.168 | 0.400 | 0.463 | 0.491 | 0.194 |
| rs11705394 | 0.035 | 0.217 | 0.007 | 0.494 | 0.012 | 0.827 |
| rs7285064 | 0.018 | 0.105 | 0.011 | 0.367 | 0.017 | 0.789 |
| rs131840 | 0.194 | 0.208 | 0.138 | 0.575 | 0.174 | 0.381 |
| rs131842 | 0.547 | 0.262 | 0.280 | 0.129 | 0.313 | 0.181 |
Abbreviations: ISHDSF, Irish Study of High Density Schizophrenia Families; PDT, pedigree disequilibrium test.
P-values ≤0.05 were in bold.
The two significant markers (rs11705394 and rs7285064) were in the third LD block. Based on LD structure and single marker analyses, we performed sex-stratified multimarker haplotype analyses of each LD block. The results of haplotype analyses were summarized in Table 3. There were no significant results (data not shown) for marker combination 3–4–5, which covers LD block 2. For combination 1–2, that is, LD block 1, the global P-values were significant for all three diagnosis definitions. Since the three diagnosis definitions were hierarchical, we performed permutations tests for this marker combination, and the results remained significant (Table 3). In this combination, the major haplotype, 1–1 or C–G, was overtransmitted to the affected subjects. Haplotype, 2–1 or T–G, was protective for the male subjects. For the female subjects, marginal significance was observed with the broad disease definition. While the same major haplotype was transmitted to the affected subjects as observed in the males, the protective haplotype (2–2, or T–T) was different. For marker combination 6–7–8, globally significant results were observed in the male subjects with the intermediate disease definition. When individual haplotypes were examined, the major haplotype 1–1–1 (A-T-C) was undertransmitted to the affected subjects, the P-values were 0.0926, 0.0427 and 0.0648 for the narrow, intermediate and broad diagnoses, respectively. A minor haplotype, 1–2–1 (A-C-C), was overtransmitted to the affected subjects (Table 3). No significant results were observed for the female subjects for combination 6–7–8.
Table 3.
Haplotype analyses (PDT) of the ISHDSF samples
| Markers | Global P | Hap |
T
a
(Trio + Sib) |
NT
a
(Trio + Sib) |
T/NT |
Hap
freq |
Hap P | Global P | Hap |
T
(Trio + Sib) |
NTa (Trio + Sib) |
T/NT |
Hap
freq |
Hap P |
|---|---|---|---|---|---|---|---|---|---|---|---|---|---|---|
|
|
|
|||||||||||||
| Male | Female | |||||||||||||
| Narrow definition | ||||||||||||||
| 1–2 | 0.0188 b | 1–1 | 52 + 158 | 30 + 142 | 1.22 | 0.39 | 0.1212 | 0.2028 | 1–1 | 25 + 156 | 22 + 131 | 1.18 | 0.53 | 0.1124 |
| 2-1 | 10 + 77 | 17 + 89 | 0.82 | 0.22 | 0.0592 | 2–2 | 13 + 71 | 14 + 79 | 0.90 | 0.36 | 0.2460 | |||
| 6–7–8 | 0.2206 | 1–1–1 | 25 + 114 | 34 + 126 | 0.87 | 0.33 | 0.0926 | 0.0190 c | 1–1–1 | 11 + 67 | 17 + 84 | 0.77 | 0.32 | 0.0858 |
| 1–2–1 | 3 + 26 | 2 + 17 | 1.53 | 0.06 | 0.1772 | 1–2–1 | 0 + 6 | 1 + 13 | 0.43 | 0.04 | 0.0512 | |||
| Intermediate definition | ||||||||||||||
| 1–2 | 0.0065 b | 1–1 | 62 + 165 | 55 + 147 | 1.91 | 0.39 | 0.0502 | 0.2758 | 1–1 | 33 + 165 | 25 + 142 | 1.19 | 0.53 | 0.2292 |
| 2–1 | 11 + 81 | 19 + 95 | 0.81 | 0.22 | 0.0051 | 2–2 | 17 + 78 | 23 + 90 | 0.84 | 0.36 | 0.1199 | |||
| 6–7–8 | 0.0168 d | 1–1–1 | 28 + 110 | 40 + 130 | 0.81 | 0.33 | 0.0427 | 0.3334 | 1–1–1 | 15 + 74 | 20 + 87 | 0.83 | 0.32 | 0.2173 |
| 1–2–1 | 4 + 29 | 3 + 15 | 1.83 | 0.06 | 0.0070 | 1-2-1 | 0 + 6 | 1 + 10 | 0.55 | 0.04 | 0.1356 | |||
| Broad definition | ||||||||||||||
| 1–2 | 0.0172 b | 1–1 | 62 + 163 | 58 + 144 | 1.90 | 0.39 | 0.0942 | 0.0437 e | 1–1 | 33 + 168 | 25 + 142 | 1.20 | 0.53 | 0.0446 |
| 2–1 | 13 + 80 | 20 + 96 | 0.80 | 0.22 | 0.0182 | 2–2 | 17 + 79 | 23 + 96 | 0.81 | 0.36 | 0.0208 | |||
| 6–7–8 | 0.0620f | 1–1–1 | 31 + 108 | 40 + 126 | 0.84 | 0.33 | 0.0648 | 0.3100 | 1–1–1 | 15 + 75 | 20 + 85 | 0.86 | 0.32 | 0.5816 |
| 1–2–1 | 4 + 28 | 3 + 16 | 1.68 | 0.06 | 0.0170 | 1–2–1 | 0 + 6 | 1 + 11 | 0.50 | 0.04 | 0.0495 | |||
Abbreviations: ISHDSF, Irish Study of High Density Schizophrenia Families; PDT, pedigree disequilibrium test.
Counts in PDT statistics.
Empirical P-values obtained by 1000 permutations were 0.0200, 0.0199 and 0.060 for the narrow, intermediate and broad definitions, respectively.
Empirical P-value obtained by 1000 permutations was 0.1538.
Empirical P-value obtained by 1000 permutations was 0.0390.
Empirical P-value obtained by 1000 permutations was 0.0589.
Empirical P-value obtained by 1000 permutations was 0.0749.
P-values ≤0.05 were in bold.
To evaluate the false positive rate for the tests we performed with the IHSDSF sample; we used the Q-value program. For the ISHDSF sample, we performed allelic, genotypic associations and secondary sex-stratified analyses. The total number of test was 165. Using the default setting, the estimated π0 is 0.573, and there were 18 tests (all tests with P-values < 0.02) had a q-value of 0.09976. When we adjusted the λ to 0.01, the estimated π0 is 0.973, and all P-values < 0.02 had a q-value of 0.1695.
Association analyses of the case – control (ICCSS) sample
For the ICCSS sample, we typed the same 10 SNPs. For all markers typed, no HWE deviations were observed. The allele frequencies of these 10 SNPs were similar as those of the family sample (Table 4). No significant associations were observed when the entire sample was analyzed (data not shown). Since the most significant difference between the ISHDSF and ICCSS was FH, and our previous study of IL3 also indicated that the associations were only observed in subjects with positive FH in the ICCSS, we restricted our analyses to only those subjects with positive FH. In these analyses, we found that rs2284031 and rs909486 showed significant associations in both allelic and genotypic tests in the male subjects. Another marker, rs2075942, showed genotypic association (Table 4). For the female subjects, rs2072707 showed nominal significance.
Table 4.
Association analyses for subjects with positive family history in the ICCSS sample
| SNP | MAF a | HWE a |
Both
|
Male
|
Female
|
|||
|---|---|---|---|---|---|---|---|---|
| Allele P | Genotype P | Allele P | Genotype P | Allele P | Genotype P | |||
| rs2075942 | 0.468 | 0.5056 | 0.4916 | 0.0999 | 0.6065 | 0.0173 | 0.0911 | 0.2528 |
| rs2072707 | 0.345 | 0.8239 | 0.3560 | 0.5595 | 0.5416 | 0.6618 | 0.0214 | 0.0706 |
| rs2284031 | 0.469 | 0.9885 | 0.0927 | 0.0827 | 0.0084 | 0.0133 | 0.4911 | 0.5050 |
| rs17811365 | 0.079 | 0.7607 | 0.8467 | 0.8949 | 0.8175 | 0.5965 | 0.9691 | 0.3603 |
| rs909486 | 0.468 | 0.8969 | 0.1104 | 0.1111 | 0.0062 | 0.0152 | 0.3428 | 0.2724 |
| rs2075936 | 0.475 | 0.2825 | 0.9368 | 0.7241 | 0.8524 | 0.8087 | 0.9730 | 0.8953 |
| rs11705394 | 0.286 | 0.1636 | 0.9128 | 0.6105 | 0.9351 | 0.9580 | 0.7741 | 0.3597 |
| rs7285064 | 0.263 | 0.1133 | 0.9302 | 0.6835 | 0.8201 | 0.9649 | 0.8752 | 0.4207 |
| rs131840 | 0.168 | 0.5767 | 0.8996 | 0.5837 | 0.6680 | 0.8609 | 0.7368 | 0.3390 |
| rs131842 | 0.153 | 0.8453 | 0.5911 | 0.8700 | 0.6904 | 0.7342 | 0.7361 | 0.4057 |
Abbreviations: HWE, Hardy – Weinberg Equilibrium; ICCSS, Irish Case – Control Study of Schizophrenia; MAF, minor allele frequency; SNP, single-nucleotide polymorphism.
Values for MAF and HWE were from the entire sample.
P-values ≤0.05 were in bold.
To be consistent with our findings in the ISHDSF, we conducted sex- and FH-stratified analyses for multimarker associations. We found that marker combination 3–4–5 or rs2284031–rs17811358–rs909486 showed significant associations in the males (global P = 0.0161). Haplotype 1–1–1 was underrepresented and haplotype 2–1–2 was overrepresented in the cases (P = 0.0065 and 0.0052, respectively). Permutation tests indicated that combination 3–4–5 remained globally significant. In the females, combination 1–2 reached nominal significance (global P = 0.0497, haplotype 2–2 P = 0.0149) (see Table 5). No significant results were observed for combination 6–7–8 (data not shown). We performed similar q-value estimate with the Q-value program. For the ICCSS sample, we performed a total of 93 tests. Using the default setting, we obtained a π0 of 1, and there were 10 tests (P < 0.02) with a q-value of 0.1601 or less. When we adjusted the λ to 0.01, the estimated π0 is 0.956, and all P-values < 0.02 had a q-value of 0.1534 or less.
Table 5.
Haplotype analyses of the ICCSS samples
| Markers |
Global P |
Haplotype |
Haplotype freq
(case – control) |
Haplotype P |
OR |
Global P |
Haplotype |
Haplotype freq
(case - control) |
Haplotype P |
OR |
|---|---|---|---|---|---|---|---|---|---|---|
|
|
|
|||||||||
| Male | Female | |||||||||
| 1–2 | 0.8551 | 1–1 | 0.56/0.53 | 0.6527 | 1.06 | 0.0497 a | 1–1 | 0.45/0.56 | 0.0764 | 0.80 |
| 2–1 | 0.13/0.13 | 0.9125 | 1.00 | 2–2 | 0.46/0.32 | 0.0149 | 1.44 | |||
| 3–4–5 | 0.0161 b | 1–1–1 | 0.35/0.48 | 0.0065 | 0.73 | 0.6290 | 1–1–1 | 0.49/0.43 | 0.3917 | 1.14 |
| 2–1–2 | 0.57/0.44 | 0.0052 | 1.30 | 2–1–2 | 0.43/0.49 | 0.3366 | 0.88 | |||
Abbreviations: ICCSS, Irish Case – Control Study of Schizophrenia; OR, odds ratio.
Empirical P-value obtained from 1000 permutations was 0.0300.
Empirical P-value obtained from 1000 permutations was 0.0090.
P-values ≤0.05 were in bold.
Discussion
It has been hypothesized that the immune system plays an important role in the etiology of schizophrenia.13,41–43 Many components of the immune system have been studied for their roles in the disease, including IL2,13,44 IL645,46 and TNF-α.47 We have reported that IL3 is associated with schizophrenia and the associations observed are sex-specific and FH-dependent.3 Others report the association of IL3RA.24 Since CSF2RB is required to achieve the biological functions of IL3, if IL3 is involved in schizophrenia via change of expression or activities, then changes in the CSF2RB gene, in either expression or activities, could lead to similar consequences. In other words, it is likely that, at least for some cases, alterations of CSF2RB may also contribute to the pathophysiology of schizophrenia. Interestingly, the genomic location of CSF2RB gene, 22q12.3, is one of the regions implicated in schizophrenia in linkage studies.1,28 In a mouse model, a mutant constitutively expressing CSF2RB develops sporadic and progressive neurologic disease and displays necrosis in the CNS.29
In this study, we genotyped 10 SNPs (8 in intron, 2 in exon) in the CSF2RB gene in both the family and case – control samples. In the family sample, we found associations in SNPs rs11705394 and rs7285064. The associations became more significant when sex-stratified analyses were conducted. This sex-specific association was observed at the levels of both individual markers and haplotypes. In the case – control sample, we found that two different markers (rs2284031 and rs909486) were significantly associated with the disease, and the associations were sex-specific and FH-dependent, consistent with that found in the IL3 studies. Similar results were obtained when multimarker haplotypes were analyzed. We noticed that in the ISHDSF, the association signals came from two LD blocks (blocks 1 and 3) that had low LD with each other, suggesting that these signals may be different. In the ICCSS, while the associations were also observed in two LD blocks, these two blocks (blocks 1 and 2) shared high LDs, and therefore could be reflections of the same genetic signal.
In this study, there were some differences in the associations between the family and case – control samples. The associations were found in different markers. In the family sample, the associations came from markers 7 and 8 of LD block 3, while the positive results of case – control sample came from markers 3 and 5 of LD block 2. With regard to haplotypes, significant associations were found in LD blocks 1 and 3 in the family sample. The associations of the case – control sample were largely concentrated in LD block 2. The discrepancies were puzzling but hardly surprising. Most, if not all, promising candidate genes identified for schizophrenia in recent years had similar inconsistencies.48–53 While it is possible that our findings are a false-positive, we believe that it is not very likely for several reasons. First, we performed false-positive rate evaluations with the Q-value method. In these evaluations, either using a default setting or selecting a λ of 0.01—which is a reasonable value given a priori knowledge of the associations of IL3 and IL3RA—we obtained a reasonable q-value (≤0.18) for those P-values ≤0.02 in both the ISHDSF and ICCSS samples. Given the number of tests with this q-value (18 tests in the ISHDSF and 10 tests in the ICCSS), most of these tests are likely to be true positives. Second, it is not likely to occur by chance that all three components of IL3 signaling pathway, that is, IL3, ILRA and CSF2RB, show significant associations with schizophrenia. For IL3 and CSF2RB, we found the same sex-specific and FH-dependent associations. In an independent study, the alpha subunit of IL3 receptor, IL3RA, is found to be associated with schizophrenia.24 These three independent studies support each other and can be viewed as converging evidence implicating the involvement of IL3 signaling pathway in the pathophysiology of schizophrenia. To our knowledge, this is the first time that multiple genes in the same signaling pathway are found to be associated with schizophrenia. Third, while the signals observed are of modest strength, similar signals were observed in two independent samples, in part meeting the replication criteria outlined in recent literature.54,55 Since the results from the family sample supported that found in the case – control sample, this reduced the likelihood that signals from the case – control were due to population stratification. Fourth, the LD structure of the CSF2RB gene suggested that the associations from the ISHDSF and ICCSS may be of different origins. This, on the one hand explained, to some extent, the differences between the two samples; on the other hand, these results could be viewed as converging evidence implicating the same gene.
In recent years, evidence is accumulating that sex may play a significant role in the etiology of schizophrenia. In a recent, extensive review of worldwide incidence rate, it was found that males have significantly higher incidence rate than females.56 The males have a younger age-of-onset than the females.57 Sex-specific associations with schizophrenia have been reported for the catechol-O-methyltransferase gene 58 and several other genes.59,60 It was also argued recently that sex may play a more important role in brain structure and psychiatric disorders than commonly acknowledged.61–63 Our finding is consistent with this converging evidence. Furthermore, our finding of sex-specific associations in CSF2RB is supported by molecular evidence. There are multiple estrogen response elements in the promoter region of CSF2RB,64 and there are reports of sexually dimorphic expression of CSF2RB in mouse brain.65
In conclusion, despite some inconsistencies in our findings, we report evidence that variants in the CSF2RB gene are associated with schizophrenia in the ISHDSF and ICCSS samples. The observed associations are sex-specific and FH-dependent. These results support our previous study of the IL3 gene in which two biologically linked genes show the same patterns of associations with schizophrenia. These findings strongly support the hypothesis that the immune system is involved in the pathophysiology of the disease. Further research in the IL3 signaling pathway in schizophrenia is warranted.
Acknowledgments
This study is supported by a research grant (RO1MH41953) to KSK from the National Institute of Mental Health. We thank the patients and their families for participating in this study. The Northern Ireland Blood Transfusion Service assisted with the collection of control sample.
References
- 1.Lewis CM, Levinson DF, Wise LH, DeLisi LE, Straub RE, Hovatta I, et al. Genome scan meta-analysis of schizophrenia and bipolar disorder, part II: schizophrenia. Am J Hum Genet. 2003;73:34–48. doi: 10.1086/376549. [DOI] [PMC free article] [PubMed] [Google Scholar]
- 2.Chen X, Wang X, Hossain S, O’Neill FA, Walsh D, Pless L, et al. Haplotypes spanning SPEC2, PDZ-G EF2 and ACSL6 genes are associated with schizophrenia. Hum Mol Genet. 2006;15:3329–3342. doi: 10.1093/hmg/ddl409. [DOI] [PubMed] [Google Scholar]
- 3.Chen X, Wang X, Hossain S, O’Neill AF, Walsh D, van den Oord EJ, et al. Interleukin 3 and schizophrenia: the impact of sex and family history. Mol Psychiatry. 2007;12:273–282. doi: 10.1038/sj.mp.4001932. [DOI] [PubMed] [Google Scholar]
- 4.Gaughran F. Immunity and schizophrenia: autoimmunity, cytokines, and immune responses. Int Rev Neurobiol. 2002;52:275–302. doi: 10.1016/s0074-7742(02)52013-4. [DOI] [PubMed] [Google Scholar]
- 5.Jones AL, Mowry BJ, Pender MP, Greer JM. Immune dysregulation and self-reactivity in schizophrenia: do some cases of schizophrenia have an autoimmune basis? Immunol Cell Biol. 2005;83:9–17. doi: 10.1111/j.1440-1711.2005.01305.x. [DOI] [PubMed] [Google Scholar]
- 6.Kipnis J, Cardon M, Strous RD, Schwartz M. Loss of autoimmune T cells correlates with brain diseases: possible implications for schizophrenia? Trends Mol Med. 2006;12:107–112. doi: 10.1016/j.molmed.2006.01.003. [DOI] [PubMed] [Google Scholar]
- 7.Bessler H, Levental Z, Karp L, Modai I, Djaldetti M, Weizman A. Cytokine production in drug-free and neuroleptic-treated schizophrenic patients. Biol Psychiatry. 1995;38:297–302. doi: 10.1016/0006-3223(94)00299-I. [DOI] [PubMed] [Google Scholar]
- 8.Cazzullo CL, Sacchetti E, Galluzzo A, Panariello A, Colombo F, Zagliani A, et al. Cytokine profiles in drug-naive schizophrenic patients. Schizophr Res. 2001;47:293–298. doi: 10.1016/s0920-9964(00)00046-3. [DOI] [PubMed] [Google Scholar]
- 9.Rapaport MH, Delrahim KK. An abbreviated review of immune abnormalities in schizophrenia. CNS Spectr. 2001;6:392–397. doi: 10.1017/s1092852900021763. [DOI] [PubMed] [Google Scholar]
- 10.Chiavetto LB, Boin F, Zanardini R, Popoli M, Michelato A, Bignotti S, et al. Association between promoter polymorphic haplotypes of interleukin-10 gene and schizophrenia. Biol Psychiatry. 2002;51:480–484. doi: 10.1016/s0006-3223(01)01324-5. [DOI] [PubMed] [Google Scholar]
- 11.He G, Zhang J, Li XW, Chen WY, Pan YX, Yang FP, et al. Interleukin-10-1082 promoter polymorphism is associated with schizophrenia in a Han Chinese sib-pair study. Neurosci Lett. 2006;394:1–4. doi: 10.1016/j.neulet.2005.06.054. [DOI] [PubMed] [Google Scholar]
- 12.Zanardini R, Bocchio-Chiavetto L, Scassellati C, Bonvicini C, Tura GB, Rossi G, et al. Association between IL-1beta -511C/T and IL-1RA (86 bp)n repeats polymorphisms and schizophrenia. J Psychiatr Res. 2003;37:457–462. doi: 10.1016/s0022-3956(03)00072-4. [DOI] [PubMed] [Google Scholar]
- 13.Yu L, Yang MS, Zhao J, Shi YY, Zhao XZ, Yang JD, et al. An association between polymorphisms of the interleukin-10 gene promoter and schizophrenia in the Chinese population. Schizophr Res. 2004;71:179–183. doi: 10.1016/j.schres.2004.01.001. [DOI] [PubMed] [Google Scholar]
- 14.Zhang XY, Zhou DF, Zhang PY, Wu GY, Cao LY, Shen YC. Elevated interleukin-2, interleukin-6 and interleukin-8 serum levels in neuroleptic-free schizophrenia: association with psychopathology. Schizophr Res. 2002;57:247–258. doi: 10.1016/s0920-9964(01)00296-1. [DOI] [PubMed] [Google Scholar]
- 15.Theodoropoulou S, Spanakos G, Baxevanis CN, Economou M, Gritzapis AD, Papamichail MP, et al. Cytokine serum levels, autologous mixed lymphocyte reaction and surface marker analysis in never medicated and chronically medicated schizophrenic patients. Schizophr Res. 2001;47:13–25. doi: 10.1016/s0920-9964(00)00007-4. [DOI] [PubMed] [Google Scholar]
- 16.Burdach S, Nishinakamura R, Dirksen U, Murray R. The physiologic role of interleukin-3, interleukin-5, granulocyte-macrophage colony-stimulating factor, and the beta c receptor system. Curr Opin Hematol. 1998;5:177–180. doi: 10.1097/00062752-199805000-00005. [DOI] [PubMed] [Google Scholar]
- 17.Reddy EP, Korapati A, Chaturvedi P, Rane S. IL-3 signaling and the role of Src kinases, JAKs and STATs: a covert liaison unveiled. Oncogene. 2000;19:2532–2547. doi: 10.1038/sj.onc.1203594. [DOI] [PubMed] [Google Scholar]
- 18.Chavany C, Vicario-Abejon C, Miller G, Jendoubi M. Transgenic mice for interleukin 3 develop motor neuron degeneration associated with autoimmune reaction against spinal cord motor neurons. Proc Natl Acad Sci USA. 1998;95:11354–11359. doi: 10.1073/pnas.95.19.11354. [DOI] [PMC free article] [PubMed] [Google Scholar]
- 19.Giralt M, Carrasco J, Penkowa M, Morcillo MA, Santamaria J, Campbell IL, et al. Astrocyte-targeted expression of interleukin-3 and interferon-alpha causes region-specific changes in metal-lothionein expression in the brain. Exp Neurol. 2001;168:334–346. doi: 10.1006/exnr.2000.7601. [DOI] [PubMed] [Google Scholar]
- 20.Sugita Y, Zhao B, Shankar P, Dunbar CE, Doren S, Young HA, et al. CNS interleukin-3 (IL-3) expression and neurological syndrome in antisense-IL-3 transgenic mice. J Neuropathol Exp Neurol. 1999;58:480–488. doi: 10.1097/00005072-199905000-00007. [DOI] [PubMed] [Google Scholar]
- 21.Powell HC, Garrett RS, Brett FM, Chiang CS, Chen E, Masliah E, et al. Response of glia, mast cells and the blood brain barrier, in transgenic mice expressing interleukin-3 in astrocytes, an experimental model for CNS demyelination. Brain Pathol. 1999;9:219–235. doi: 10.1111/j.1750-3639.1999.tb00220.x. [DOI] [PMC free article] [PubMed] [Google Scholar]
- 22.Hanson DR, Gottesman II. Theories of schizophrenia: a genetic-inflammatory-vascular synthesis. BMC Med Genet. 2005;6:7–24. doi: 10.1186/1471-2350-6-7. [DOI] [PMC free article] [PubMed] [Google Scholar]
- 23.Sirota P, Schild K, Elizur A, Djaldetti M, Fishman P. Increased interleukin-1 and interleukin-3 like activity in schizophrenic patients. Prog Neuropsychopharmacol Biol Psychiatry. 1995;19:75–83. doi: 10.1016/0278-5846(94)00106-r. [DOI] [PubMed] [Google Scholar]
- 24.Lencz T, Morgan TV, Athanasiou M, Dain B, Reed CR, Kane CR, et al. Converging evidence for a pseudoautosomal cytokine receptor gene locus in schizophrenia. Mol Psychiatry. 2007;12:572–580. doi: 10.1038/sj.mp.4001983. [DOI] [PubMed] [Google Scholar]
- 25.Tavernier J, Devos R, Cornelis S, Tuypens T, Van der HJ, Fiers W, et al. A human high affinity interleukin-5 receptor (IL5R) is composed of an IL5-specific alpha chain and a beta chain shared with the receptor for GM-CSF. Cell. 1991;66:1175–1184. doi: 10.1016/0092-8674(91)90040-6. [DOI] [PubMed] [Google Scholar]
- 26.Geijsen N, Koenderman L, Coffer PJ. Specificity in cytokine signal transduction: lessons learned from the IL-3/IL-5/GM-CSF receptor family. Cytokine Growth Factor Rev. 2001;12:19–25. doi: 10.1016/s1359-6101(00)00019-8. [DOI] [PubMed] [Google Scholar]
- 27.Martinez-Moczygemba M, Huston DP. Biology of common beta receptor-signaling cytokines: IL-3, IL-5, and GM-CSF. J Allergy Clin Immunol. 2003;112:653–665. doi: 10.1016/S0091. [DOI] [PubMed] [Google Scholar]
- 28.Takahashi S, Cui YH, Kojima T, Han YH, Zhou RL, Kamioka M, et al. Family-based association study of markers on chromosome 22 in schizophrenia using African-American, European-American, and Chinese families. Am J Med Genet B Neuropsychiatr Genet. 2003;120:11–17. doi: 10.1002/ajmg.b.20031. [DOI] [PubMed] [Google Scholar]
- 29.D’Andrea RJ, Harrison-Findik D, Butcher CM, Finnie J, Blumbergs P, Bartley P, et al. Dysregulated hematopoiesis and a progressive neurological disorder induced by expression of an activated form of the human common beta chain in transgenic mice. J Clin Invest. 1998;102:1951–1960. doi: 10.1172/JCI3729. [DOI] [PMC free article] [PubMed] [Google Scholar]
- 30.Kendler KS, McGuire M, Gruenberg AM, O’Hare A, Spellman M, Walsh D. The Roscommon Family Study. III. Schizophrenia-related personality disorders in relatives. Arch Gen Psychiatry. 1993;50:781–788. doi: 10.1001/archpsyc.1993.01820220033004. [DOI] [PubMed] [Google Scholar]
- 31.Kendler KS, Myers JM, O’Neill FA, Martin R, Murphy B, MacLean CJ, et al. Clinical features of schizophrenia and linkage to chromosomes 5q, 6p, 8p, and 10p in the Irish Study of High-Density Schizophrenia Families. Am J Psychiatry. 2000;157:402–408. doi: 10.1176/appi.ajp.157.3.402. [DOI] [PubMed] [Google Scholar]
- 32.Endicott J, Andreasen N, Spitzer RL. Family History Research Diagnostic Criteria. New York State Psychiatric Institute; New York: 1978. [Google Scholar]
- 33.Livak KJ. Allelic discrimination using fluorogenic probes and the 5′ nuclease assay. Genet Anal. 1999;14:143–149. doi: 10.1016/s1050-3862(98)00019-9. [DOI] [PubMed] [Google Scholar]
- 34.Wigginton JE, Cutler DJ, Abecasis GR. A note on exact tests of Hardy – Weinberg equilibrium. Am J Hum Genet. 2005;76:887–893. doi: 10.1086/429864. [DOI] [PMC free article] [PubMed] [Google Scholar]
- 35.Martin ER, Monks SA, Warren LL, Kaplan NL. A test for linkage and association in general pedigrees: the pedigree disequilibrium test. Am J Hum Genet. 2000;67:146–154. doi: 10.1086/302957. [DOI] [PMC free article] [PubMed] [Google Scholar]
- 36.Dudbridge F. Pedigree disequilibrium tests for multilocus haplotypes. Genet Epidemiol. 2003;25:115–121. doi: 10.1002/gepi.10252. [DOI] [PubMed] [Google Scholar]
- 37.Excoffier L, Slatkin M. Maximum-likelihood estimation of molecular haplotype frequencies in a diploid population. Mol Biol Evol. 1995;12:921–927. doi: 10.1093/oxfordjournals.molbev.a040269. [DOI] [PubMed] [Google Scholar]
- 38.Barrett JC, Fry B, Maller J, Daly MJ. Haploview: analysis and visualization of LD and haplotype maps. Bioinformatics. 2004;21:263–265. doi: 10.1093/bioinformatics/bth457. [DOI] [PubMed] [Google Scholar]
- 39.Gabriel SB, Schaffner SF, Nguyen H, Moore JM, Roy J, Blumenstiel B, et al. The structure of haplotype blocks in the human genome. Science. 2002;296:2225–2229. doi: 10.1126/science.1069424. [DOI] [PubMed] [Google Scholar]
- 40.Storey JD, Tibshirani R. Statistical significance for genomewide studies. Proc Natl Acad Sci USA. 2003;100:9440–9445. doi: 10.1073/pnas.1530509100. [DOI] [PMC free article] [PubMed] [Google Scholar]
- 41.Yang J, Si T, Ling Y, Ruan Y, Han Y, Wang X, et al. Association study between interleukin-1beta gene (IL-1beta) and schizophrenia. Life Sci. 2003;72:3017–3021. doi: 10.1016/s0024-3205(03)00248-0. [DOI] [PubMed] [Google Scholar]
- 42.Yao JK, Sistilli CG, van Kammen DP. Membrane polyunsaturated fatty acids and CSF cytokines in patients with schizophrenia. Prostaglandins Leukot Essent Fatty Acids. 2003;69:429–436. doi: 10.1016/j.plefa.2003.08.015. [DOI] [PubMed] [Google Scholar]
- 43.Mazzarello V, Cecchini A, Fenu G, Rassu M, Dessy LA, Lorettu L, et al. Lymphocytes in schizophrenic patients under therapy: serological, morphological and cell subset findings. Ital J Anat Embryol. 2004;109:177–188. [PubMed] [Google Scholar]
- 44.Licinio J, Seibyl JP, Altemus M, Charney DS, Krystal JH. Elevated CSF levels of interleukin-2 in neuroleptic-free schizophrenic patients. Am J Psychiatry. 1993;150:1408–1410. doi: 10.1176/ajp.150.9.1408. [DOI] [PubMed] [Google Scholar]
- 45.Ganguli R, Yang Z, Shurin G, Chengappa KN, Brar JS, Gubbi AV, et al. Serum interleukin-6 concentration in schizophrenia: elevation associated with duration of illness. Psychiatry Res. 1994;51:1–10. doi: 10.1016/0165-1781(94)90042-6. [DOI] [PubMed] [Google Scholar]
- 46.Naudin J, Capo C, Giusano B, Mege JL, Azorin JM. A differential role for interleukin-6 and tumor necrosis factor-alpha in schizophrenia? Schizophr Res. 1997;26:227–233. doi: 10.1016/s0920-9964(97)00059-5. [DOI] [PubMed] [Google Scholar]
- 47.Naudin J, Capo C, Giusano B, Mege JL, Azorin JM. A differential role for interleukin-6 and tumor necrosis factor-alpha in schizophrenia? Schizophr Res. 1997;26:227–233. doi: 10.1016/s0920-9964(97)00059-5. [DOI] [PubMed] [Google Scholar]
- 48.Levitt P, Ebert P, Mirnics K, Nimgaonkar VL, Lewis DA. Making the case for a candidate vulnerability gene in schizophrenia: convergent evidence for regulator of G-protein signaling 4 (RGS4) Biol Psychiatry. 2006;60:534–537. doi: 10.1016/j.biopsych.2006.04.028. [DOI] [PubMed] [Google Scholar]
- 49.Riley B, Kendler KS. Molecular genetic studies of schizophrenia. Eur J Hum Genet. 2006;14:669–680. doi: 10.1038/sj.ejhg.5201571. [DOI] [PubMed] [Google Scholar]
- 50.Williams NM, O’Donovan MC, Owen MJ. Is the dysbindin gene (DTNBP1) a susceptibility gene for schizophrenia? Schizophr Bull. 2005;31:800–805. doi: 10.1093/schbul/sbi061. [DOI] [PubMed] [Google Scholar]
- 51.Tosato S, Dazzan P, Collier D. Association between the neuregulin 1 gene and schizophrenia: a systematic review. Schizophr Bull. 2005;31:613–617. doi: 10.1093/schbul/sbi043. [DOI] [PubMed] [Google Scholar]
- 52.Camargo LM, Collura V, Rain JC, Mizuguchi K, Hermjakob H, Kerrien S, et al. Disrupted in Schizophrenia 1 Interactome: evidence for the close connectivity of risk genes and a potential synaptic basis for schizophrenia. Mol Psychiatry. 2007;12:74–86. doi: 10.1038/sj.mp.4001880. [DOI] [PubMed] [Google Scholar]
- 53.Norton N, Williams HJ, Owen MJ. An update on the genetics of schizophrenia. Curr Opin Psychiatry. 2006;19:158–164. doi: 10.1097/01.yco.0000214341.52249.59. [DOI] [PubMed] [Google Scholar]
- 54.Neale BM, Sham PC. The future of association studies: gene-based analysis and replication. Am J Hum Genet. 2004;75:353–362. doi: 10.1086/423901. [DOI] [PMC free article] [PubMed] [Google Scholar]
- 55.Petryshen TL, Middleton FA, Kirby A, Aldinger KA, Purcell S, Tahl AR, et al. Support for involvement of neuregulin 1 in schizophrenia pathophysiology. Mol Psychiatry. 2005;10:366–374. doi: 10.1038/sj.mp.4001608. [DOI] [PubMed] [Google Scholar]
- 56.McGrath J, Saha S, Welham J, El Saadi O, MacCauley C, Chant D. A systematic review of the incidence of schizophrenia: the distribution of rates and the influence of sex, urbanicity, migrant status and methodology. BMC Med. 2004;2:13–35. doi: 10.1186/1741-7015-2-13. [DOI] [PMC free article] [PubMed] [Google Scholar]
- 57.Halbreich U, Kahn LS. Hormonal aspects of schizophrenias: an overview. Psychoneuroendocrinology. 2003;28(Suppl 2):1–16. doi: 10.1016/s0306-4530(02)00124-5. [DOI] [PubMed] [Google Scholar]
- 58.Shifman S, Bronstein M, Sternfeld M, Pisante-Shalom A, Lev-Lehman E, Weizman A, et al. A highly significant association between a COMT haplotype and schizophrenia. Am J Hum Genet. 2002;71:1296–1302. doi: 10.1086/344514. [DOI] [PMC free article] [PubMed] [Google Scholar]
- 59.Tan EC, Chong SA, Wang H, Chew-Ping LE, Teo YY. Gender-specific association of insertion/deletion polymorphisms in the nogo gene and chronic schizophrenia. Brain Res Mol Brain Res. 2005;139:212–216. doi: 10.1016/j.molbrainres.2005.05.010. [DOI] [PubMed] [Google Scholar]
- 60.Thomson PA, Wray NR, Thomson AM, Dunbar DR, Grassie MA, Condie A, et al. Sex-specific association between bipolar affective disorder in women and GPR50, an X-linked orphan G protein-coupled receptor. Mol Psychiatry. 2005;10:470–478. doi: 10.1038/sj.mp.4001593. [DOI] [PubMed] [Google Scholar]
- 61.Salem JE, Kring AM. The role of gender differences in the reduction of etiologic heterogeneity in schizophrenia. Clin Psychol Rev. 1998;18:795–819. doi: 10.1016/s0272-7358(98)00008-7. [DOI] [PubMed] [Google Scholar]
- 62.Czlonkowska A, Ciesielska A, Gromadzka G, Kurkowska-Jastrzebska I. Estrogen and cytokines production—the possible cause of gender differences in neurological diseases. Curr Pharm Des. 2005;11:1017–1030. doi: 10.2174/1381612053381693. [DOI] [PubMed] [Google Scholar]
- 63.Cahill L. Why sex matters for neuroscience. Nat Rev Neurosci. 2006;7:477–484. doi: 10.1038/nrn1909. [DOI] [PubMed] [Google Scholar]
- 64.Bourdeau V, Deschenes J, Metivier R, Nagai Y, Nguyen D, Bretschneider N, et al. Genome-wide identification of high-affinity estrogen response elements in human and mouse. Mol Endocrinol. 2004;18:1411–1427. doi: 10.1210/me.2003-0441. [DOI] [PubMed] [Google Scholar]
- 65.Yang X, Schadt EE, Wang S, Wang H, Arnold AP, Ingram-Drake L, et al. Tissue-specific expression and regulation of sexually dimorphic genes in mice. Genome Res. 2006;16:995–1004. doi: 10.1101/gr.5217506. [DOI] [PMC free article] [PubMed] [Google Scholar]