Abstract
The structure and function of the renal artery ostium flow diverter on the caudal side of the renal branch point were previously reported; in this study, we further evaluate the diverter’s possible functions. The protrusion of this structure into the abdominal aorta suggests that the diverter may preferentially direct blood flow to the renal arteries, and that it may also influence flow patterns and recirculation known to be involved in atherogenesis. Three-dimensional computational fluid dynamics (CFD) simulations of steady and pulsatile blood flow are performed to investigate the influence of diverter size and position, and vascular geometry, on the flow patterns and fluid mechanical forces in the neighborhood of the diverter. CFD results show that the flow diverter does affect the blood distribution: depending on the diverter’s position, the flow to the renal arteries may be increased or reduced. Calculated results also demonstrate the diverter’s effect on the Wall Shear Stress (WSS) distribution, and suggest that the diverter contributes to an atherogenic environment in the abdominal aorta, while being atheroprotective in the renal arteries themselves. These results support previous clinical findings, and suggest directions for further clinical study. The results of this work have direct implications in understanding the physiological significance of the diverter, and its potential role in the pathophysiological development of atherosclerosis.
1. Introduction
Atherosclerosis involves the progressive occlusion of blood vessels by atherosclerotic plaque, starving tissues of oxygen and promoting thrombosis and clot development. Current understanding of atherogenesis centers upon the inflammatory response to highly oxidized lipid regions of low density lipoprotein (LDL) which can accumulate in arterial walls (Berliner et al., 1995). Immune surveillance cells become tethered to these oxidized regions and continue to accumulate causing inflammatory damage, cholesterol deposition, and the development of necrotic tissue. The plaque spreads outward and then deeper into the tissue, gradually becoming clinically relevant.
The localization of atherosclerotic lesions is strongly correlated with regions of low mean wall shear stress (WSS), oscillatory shear stress, and flow separation (e.g., Nguyen and Haque, 1990; Ku, 1997; Taylor et al., 1998; Wootton and Ku, 1999). The tendency of atherosclerotic plaques to develop at arterial branch points is likely due to both the hemodynamics and macromolecular environment associated with these branch points. Arterial branches experience flow separation, which generates regions of low WSS, and contributes to longer residence times that may allow for deposition of pro-atherogenic material in the vessel wall. In addition, low shear stress itself may provide cellular signals that alter the tissue microenvironment in favor of atherogenesis (e.g. Berliner et al., 1995). The direct interaction of macromolecules with LDL may also be involved in disease initiation and progression (Kwon et al., 2008).
The abdominal aorta is vulnerable to atherosclerosis; plaques located just downstream of the renal artery branching points are present to some extent in almost all individuals (Wootton and Ku, 1999). Though less well-studied than the carotid and coronary arteries and aorta, the renal bifurcations are also atherogenic (Nguyen and Haque, 1990; Yamamoto et al., 1996). The vessel tissue at the renal artery branch point has been shown to be deficient in elastin, a protein associated with LDL exclusion, and instead to exhibit thickening of collagen and proteoglycans, macromolecules associated with LDL binding (Neufeld et al., 2010). In the renal arteries, atherosclerosis can lead to stenosis, progressive renal dysfunction, and even kidney failure (Safian and Textor, 2001). Atherosclerotic lesions in the renal artery typically originate at the renal ostium, often as extensions from aortic plaques (Kaatee et al., 1996). Both human (Nguyen and Haque, 1990) and animal (Ivey et al., 1995) studies have shown that these plaques initiate on the caudal side of the aortic entrance to the renal artery. The lesions observed upstream of the ostium with advancing age are thought to be preceded by these downstream fatty streaks in the aorta (e.g. Murphy and Lever, 2002.)
The current work is focused on the region local to the branching of the renal arteries from the abdominal aorta. Recently, a previously unknown anatomical feature was discovered by the Laboratory of Cardiac Energetics at the National Heart, Lung, and Blood Institute. This feature, the renal artery ostium flow diverter, consists of a small protrusion located on the caudal surface of the bifurcation, extending into the aorta away from the renal branch (Neufeld et al., 2010). Its name reflects its hypothesized role in regulation of renal artery flow. A similar structure has been observed in canine iliac arteries (Thubrikar, 2007). The renal ostium flow diverter possesses a thinner internal elastic lamina relative to the cranial surface, and a thick proteoglycan-collagen cap, which retains LDL (Kwon et al., 2008; Neufeld et al., 2010). This observation is consistent with the known progression of atherosclerotic lesion development at the renal branch point, generally initiated at the caudal surface. The diverter’s smooth muscle content suggests its position is variable, raising the possibility that its influence on the local flow and fluid forces may be physiologically tunable (Neufeld et al., 2010).
Previous CFD studies of arterial flows have highlighted the links between hemodynamics and atherosclerosis (e.g. Perktold and Peter, 1990; Stroud et al., 2002; Buchanan et al., 2003). The goal of the current work is to use CFD to develop an understanding of how the size and position of the renal ostium flow diverter may affect flow patterns and fluid mechanical forces in the region. The current work investigates the flow diversion potential of the structure as well as its hypothesized involvement in atherosclerotic lesion development.
2. Methods
The governing continuity and Navier-Stokes equations were solved in their finite element formulation using the COMSOL software package. Blood was assumed to be a Newtonian fluid with density 1060 kg/m3 and dynamic viscosity 0.004 Pa·s. The outlet pressures were tuned to be consistent with physiological peripheral resistance and to generate physiologically appropriate flow rates, validated by comparison of results with clinical data (e.g. Vignon-Clementel et al., 2006). The arterial walls were assumed to be rigid and nonporous.
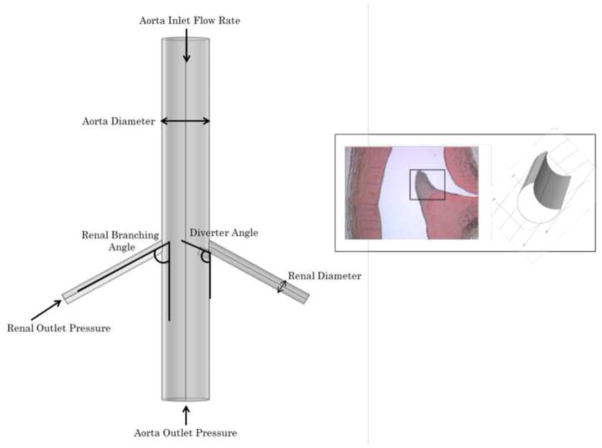
This study’s basic three-dimensional vascular geometry shown in Figure 1 was constructed using clinical data (e.g. Yamamoto et al., 1996). From this base geometry, the branching angle (RBA) of each renal artery was varied from 60° to 110° to investigate the diversity of physiological geometries. For this study, the two renal branches were assumed to occur symmetrically and in plane; a parametric study revealed that shifting the two renal branches into asymmetric positions resulted in calculated flow rates and WSS values that varied no more than 8% from those calculated for the symmetric geometry.
Figure 1.
Basic geometry of study (left), and close-up of flow diverter as observed by Neufeld et al. (2010) and as modeled in current study (right). Vessel diameters are held constant while flow rates and morphology (renal branching angle RBA, diverter angle DA, and diverter length DL) are varied in parametric study.
The flow diverter geometry was based on that observed clinically and previously reported (Neufeld et al., 2010). The flow diverter was included at only one of the renal branch points in the model, so that its effect on the flow and fluid forces could be directly compared with those in a renal artery without a diverter present. The results in each branch of this asymmetric geometry were found to differ negligibly from CFD results in a symmetric, diverter-free vasculature, or with a symmetric, two-diverter vasculature. The length (DL) and angular position (DA) of the diverter were varied from 3–5 mm (0.5Drenal to 0.83Drenal), and 45°–145°, respectively, based on the observations of Neufeld et al. (2010).
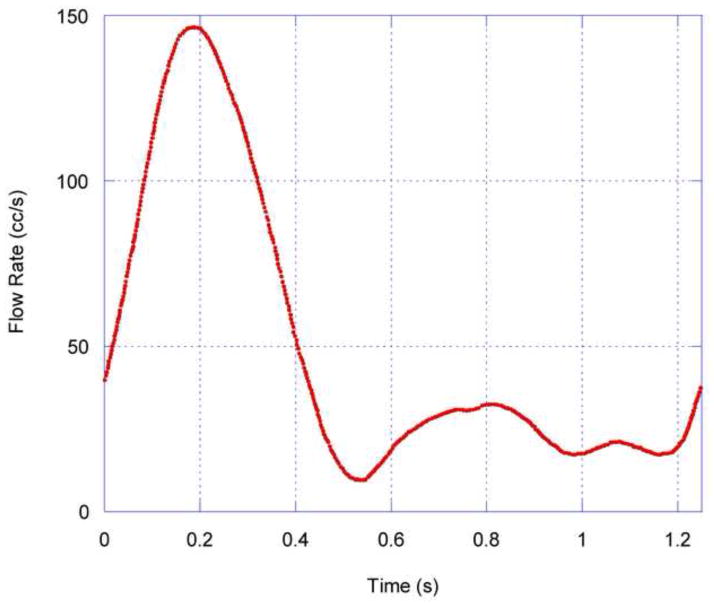
After a mesh refinement study that confirmed the mesh-independence of solutions on an optimized grid of approximately 380,000 nodes, the parametric study of the influence of branching and diverter angles was performed for (a) steady flow, with Reynolds numbers ranging from 250 to 1000, and (b) pulsatile flow, with the driving waveform shown in Figure 2. For steady flow simulations, the abdominal aorta Reynolds number was varied to simulate a range of physiological flow conditions, both diastolic and systolic. For the pulsatile simulations, five complete flow cycles were computed; results shown and analyzed are from the fourth flow cycle.
Figure 2.
Abdominal aortic flow waveform used for time-dependent COMSOL simulations, based on Mostbeck et al, 1993, and Moore and Ku, 1994.
3. Results
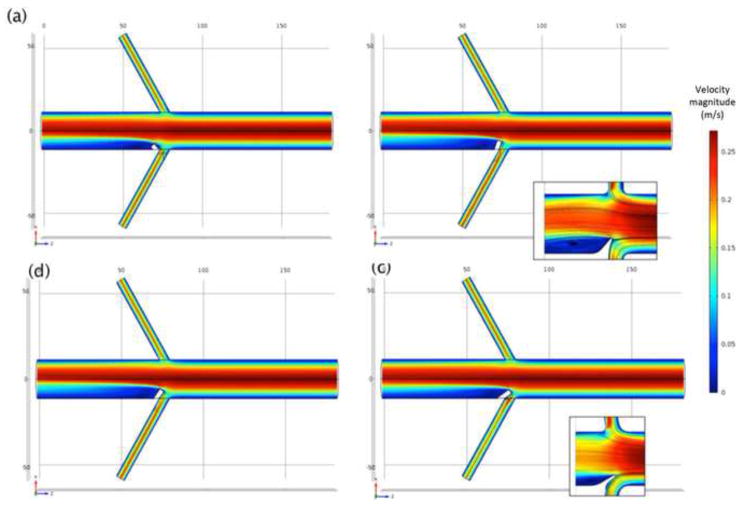
The diverter length and angle are much stronger influences on the flow patterns and forces obtained from CFD than the renal branching angle. Both steady (Figure 3) and pulsatile (Figure 4) simulations predict a low-momentum recirculation region forming just distal to the flow diverter. Both the size and the intensity of this recirculation region vary with diverter length and angle. Figure 3 shows the recirculating, low-momentum, low WSS flow for a range of diverter angles in steady flow. Figure 4 shows the calculated flow patterns at several points during the flow cycle, for a diverter angle of 80°. Because the diverter is present at the entrance of only one renal artery, the calculated flows are different, causing a slight asymmetry in the flow pattern in the downstream aorta. The recirculating, low-momentum WSS region distal to the diverter is present throughout the flow cycle.
Figure 3.
Calculated velocity (m/s) distribution at aorta midplane with Re = 800, renal branching angle 60°, and 3 mm diverter length, at selected diverter angles: (a) 45°; (b) 110°; (c) 125°; and (d) 145°. Inset images with streamlines show recirculation zone distal to diverter.
Figure 4.
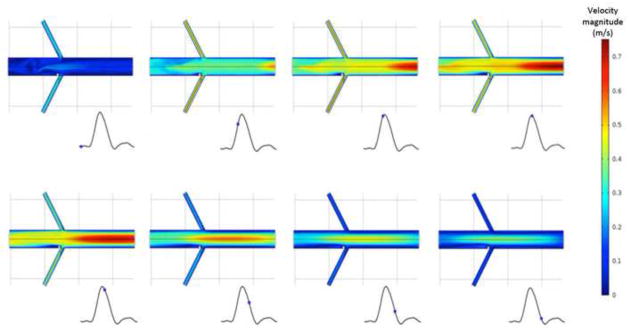
Calculated velocity (m/s) contours at aorta midplane, at several phases of the pulsatile flow cycle. Renal branching angle is 60°, and 3 mm diverter angle is 80°.
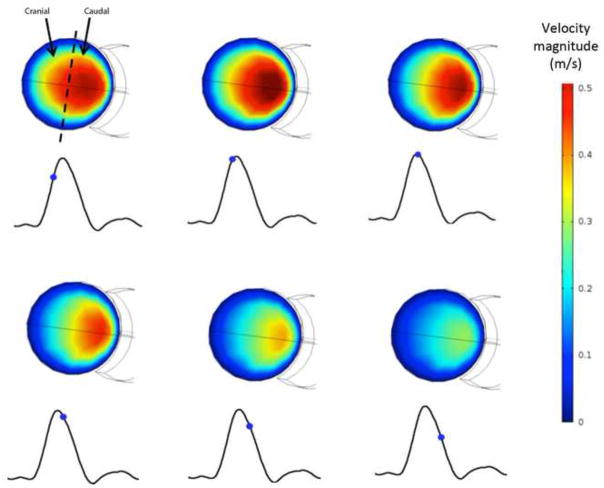
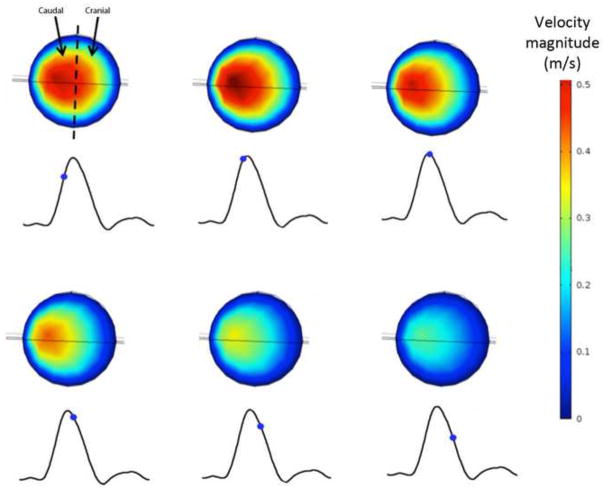
The discoverers of the renal ostium flow diverter (Neufeld et al., 2010) used ultrasound imaging to measure what they deemed “disturbed flow” in the vicinity of the diverter: increased velocity on the caudal side of the renal arteries. This flow behavior is also captured by CFD simulation, as shown in Figure 5. The warmer colors in Figure 5 indicate increased flow velocity near the caudal side, and reduced and separated flow on the cranial side, just as Neufeld et al. observed. However, as shown in Figure 6, the presence of a diverter is not necessary for such an asymmetric flow pattern to develop in the renal arteries. This is a secondary flow phenomenon often associated with vessel branching and curvature, and the flow pattern observed in vivo is captured by CFD in the renal artery whether (Fig. 5) or not (Fig. 6) a diverter is included in the computational model vessel.
Figure 5.
Asymmetry of velocity profile in the diverter-associated renal artery. RBA = 60°, DA = 110°, and DL = 4 mm. Outline of diverter is visible on caudal side of cross-section. Calculated velocity (m/s) contours on cross-sectional plane just proximal to the renal ostium, during pulsatile flow at (a) 3.85 s. (b) 3.90 s. (c) 3.95 s. (d) 4.00 s. (e) 4.05 s. (f) 4.10 s. Caudal velocity maxima is consistent with ultrasound images obtained by Neufeld et al, 2010.
Figure 6.
Asymmetry of velocity profile in the diverter-free renal artery. RBA = 60°, DA = 110°, and DL = 4 mm. Calculated velocity (m/s) contours on cross-sectional plane just proximal to the renal ostium, during pulsatile flow at (a) 3.85 s. (b) 3.90 s. (c) 3.95 s. (d) 4.00 s. (e) 4.05 s. (f) 4.10 s. Caudal velocity maxima is consistent with ultrasound images obtained by Neufeld et al, 2010.
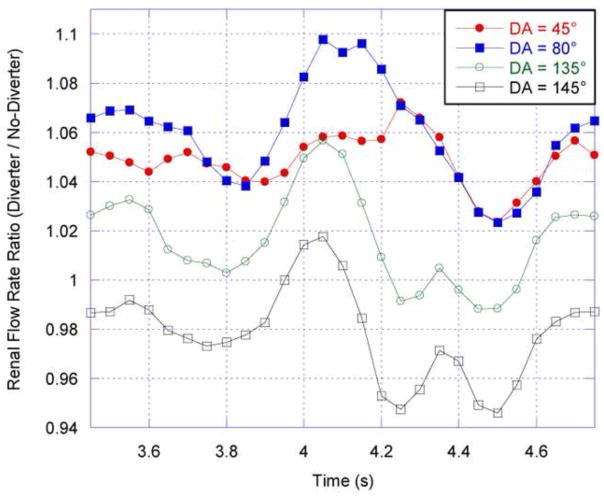
The CFD results show that the diverter does affect the flow distribution to the renal arteries. This effect is characterized by the ratio of the diverter-side renal volumetric flow rate to that in the renal artery without a diverter present; in both arteries, the volumetric flow rate is calculated four renal diameters distal from the renal branch point. The time-averaged flow rate ratios in Figure 7 demonstrate that for diverter angles up to 130°, the diverter increases the proportion of aortic flow that enters the renal artery; for angles above 130°, the diverter reduces renal artery flow due to the partial occlusion of the renal entrance. Figure 7 also shows that this result is consistent for all tested values of renal branching angle (RBA), although the amount of flow increase is affected by RBA. At smaller angles (DA), the diverter preferentially directs flow into the renal artery, increasing with angle until the maximum flow diversion at 80°. Figure 8 shows that the 80° angle has the strongest effect on renal artery flow rate throughout the pulsatile flow cycle: this position is the optimal position at which the diverter extends the furthest into higher-momentum aortic flow, with the least occlusion of the renal entrance. However, as the diverter angle exceeds 90°, the flow diversion effects are counteracted by the diverter’s physical obstruction of the renal artery, until the obstructive effects dominate flow diversion at a 130° diverter angle. Maximal increases in the time-averaged renal artery flow rate of approximately 5.6%, 7.0%, and 8.0% were observed for a diverter angle of 80° and diverter lengths of 3, 4, and 5 mm respectively (Fig. 7).
Figure 7.
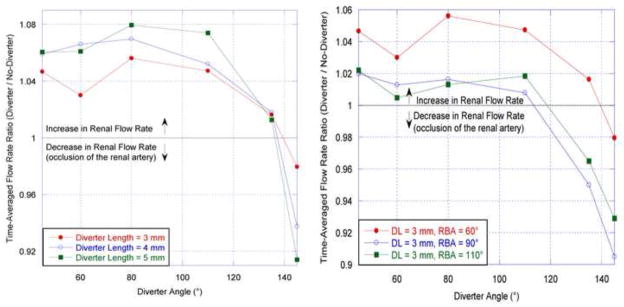
Left: Time-averaged renal flow rate ratio plotted as a function of diverter angle (DA) for three diverter lengths and a fixed renal branching angle (RBA) of 60°. Right: Time-averaged renal flow rate ratio as a function of diverter angle, for three renal branching angles and a fixed diverter length. This ratio is calculated by dividing the diverter-associated renal flow rate by the diverter-free renal flow rate averaged over a complete cardiac cycle.
Figure 8.
Renal flow rate ratio (diverter-side to no-diverter side flow rate) throughout flow cycle. RBA = 60°, DL = 3 mm.
For steady flow, the diverter’s effect on renal artery flow rate increases with aorta inlet flow rate (represented by Reynolds number). Without a diverter present, renal artery flow rates are lower for higher aortic flow rates; when a diverter is present, its influence on renal artery flow is thus more pronounced at higher aortic flow rates. The lower proportion of fluid routed to the renal arteries at higher Reynolds numbers increases the calculated flow ratio.
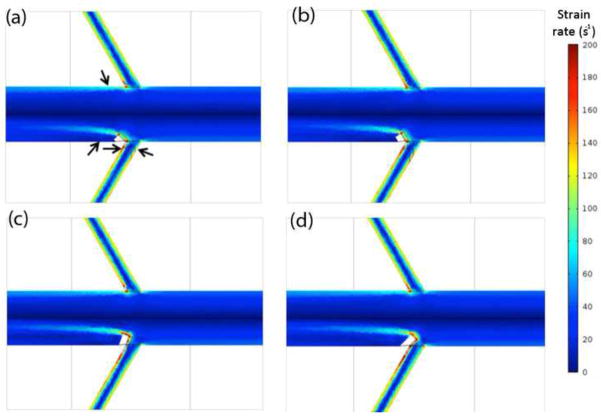
The fluid strain rate is of interest in assessing the WSS, as the two values are related by a factor of the fluid viscosity. Figure 9 shows the strain rate near the renal branch point calculated for steady flow with a range of diverter angles. It can be clearly seen that for all diverter angles tested, there is a significant reduction in strain rate near the wall on the diverter-associated side of the abdominal aorta relative to the diverter-free side. The size and strength of the region of low strain rate (signified by coolest colors) distal to the diverter is dependent on the diverter angle. There is also considerable asymmetry in the extent of extreme-shear regions between the caudal and cranial renal surfaces: the caudal low-shear layers are consistently thinner, and contain higher-shear rate fluid, than those on the cranial side.
Figure 9.
Absolute shear strain rate (s−1) in the low momentum fluid layer along the aorta and renal artery walls, shown as a function of diverter angle. DL = 3 mm and Re = 800. (a) DA = 45°. (b) DA = 60°. (c) DA = 110°. (d) DA = 135°.
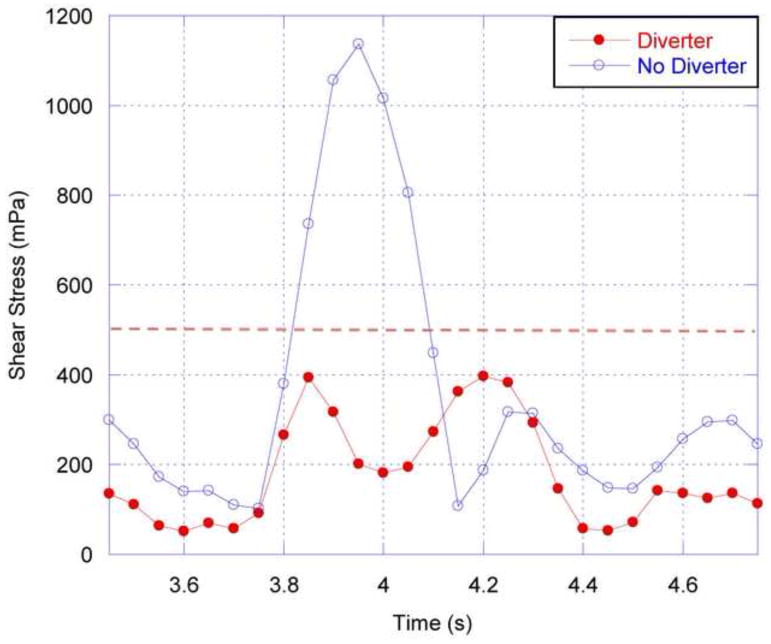
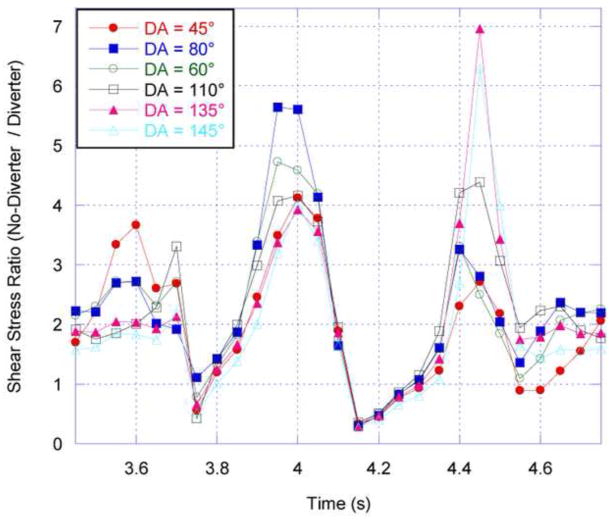
In considering WSS, with its known correlation with atherosclerosis, two areas are of particular interest: the region just distal to the renal ostium in the abdominal aorta; and the caudal and cranial regions just inside the renal artery. In the current work, WSS is averaged over a small region, approximately twice the cross-sectional area of the renal arteries, in each of these locations. Figure 10 shows the temporal variation in WSS in the abdominal aorta, just distal to the renal branch point. As expected, near the renal artery without a diverter, the aortic WSS is directly proportional to the aortic flow rate. In contrast, on the side with a diverter, the WSS is greatly reduced, particularly during the systolic peak, due to the recirculating low-momentum flow caused by the diverter. This temporal stabilization results in a more uniform, and lower magnitude, WSS throughout the flow cycle in the presence of the diverter. This reduction is seen for all possible positions of the diverter, as shown in Figure 11, which depicts the ratio of aortic WSS calculated on the diverter-free and diverter-associated sides during the fourth cardiac cycle.
Figure 10.
Absolute shear stress on the aorta wall just distal to the renal ostium, shown over the fourth simulated cardiac cycle. RBA = 60°, DL = 3 mm, DA = 80° for the renal artery with a diverter present. The dashed line at 500 mPa (5 dyn/cm2) represents the threshold below which endothelial cells are said to be atherogenic (e.g. Silver et al, 2001).
Figure 11.
Shear stress ratio (WSS proximal to renal ostium without diverter, divided by the WSS proximal to the renal ostium with a diverter present) as a function of diverter angle. RBA = 60°, DL = 3 mm. Results are for the fourth cardiac pulse simulated.
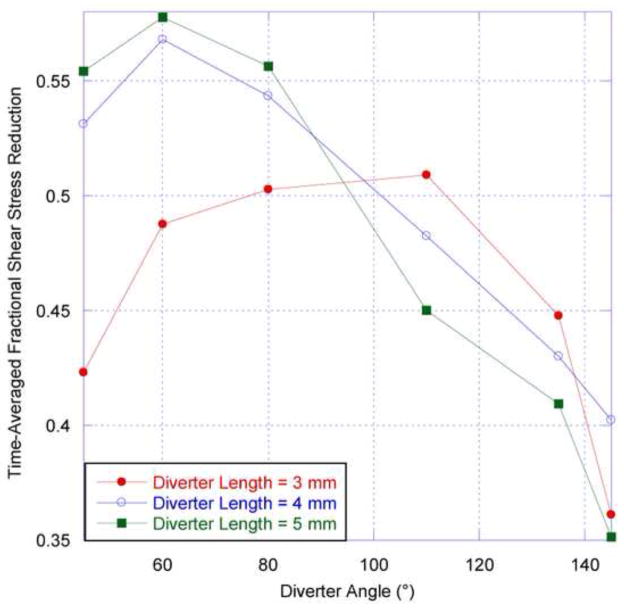
The values of WSS calculated are below the threshold of 5 dyne/cm2 identified as atherogenic for endothelial cells (e.g. Silver et al, 2001). Figure 10 shows that without a diverter present, the aorta wall distal to the renal ostium is subjected to such low WSS values during part of the flow cycle, but during systole the stress values are much higher. The damping out of WSS variation in the presence of the diverter means that WSS remains below the atherogenic threshold throughout the flow cycle. The time-averaged WSS is also reduced (in excess of 40%) due to the presence of the diverter, as seen in Figure 12. For the two larger diverter lengths tested, the reduction in abdominal aortic WSS is greatest for acute diverter angles. The presence of the diverter would seem to support the tendency toward atherogenesis in the abdominal aorta distal to the renal ostia.
Figure 12.
Time-averaged reduction in aorta wall shear stress as a function of diverter angle for three diverter lengths. Here, the renal branching angle (RBA) is 60°. This stress reduction fraction is calculated by normalizing the diverter-associated aorta wall shear stress by the diverter-free aorta wall shear stress, averaged over a complete cardiac cycle, and subtracted from unity.
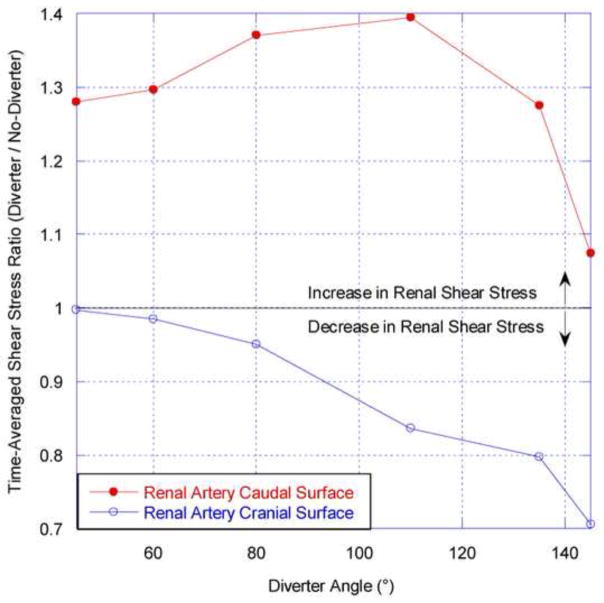
Within the renal arteries, the effect of the diverter is to increase the WSS on the caudal surface, as demonstrated by the results in Figure 13. The maximum increase is approximately 40% and varies between ~28% and this maximum value for diverter angles ranging from 45° to 135°. The opposite trend is observed for the cranial renal surface, on which WSS is decreased in the presence of the diverter. Of particular interest are diverter geometries between 45° and 80°. In this region the large caudal shear increases are much greater in absolute magnitude than the 5% maximal decreases exhibited on the cranial surface.
Figure 13.
Time-averaged renal artery shear stress ratio as a function of diverter angle for a diverter length of 4 mm. This ratio is calculated by normalizing the diverter-associated renal WSS at the caudal or cranial surface by the corresponding shear stress in the diverter-free renal artery, averaged over a complete cardiac cycle.
This result suggests that the “average” position(s) of the diverter can significantly increase the shear stress on the caudal surface of the renal artery. As elevated vessel wall shear is thought to inhibit atherosclerosis (e.g. Wootton and Ku, 1999), it is reasonable to speculate that the diverter plays an atheroprotective role in the renal artery.
4. Discussion
The results of CFD simulation can help elucidate the function of the renal artery ostium flow diverter, whose structure was previously described by Neufeld et al. (2010). The calculated flow patterns are consistent with in vivo ultrasound measurements (Neufeld et al., 2010). Numerical simulation of the diverter shows that it can both influence the renal artery flow rate as well as the WSS on the luminal surface of the aorta downstream of the renal artery branching point. The effect of the diverter is strongly dependent on its orientation, the diverter angle.
The flow diverter is truly a momentum diverter. The flow diverter provides a physical boundary that obstructs bulk fluid from the abdominal aorta and redirects it towards the renal artery. The diverter’s effects are more pronounced when (a) aortic fluid velocity is greater; (b) the diverter is larger, so that it interacts with higher-momentum fluid; or (c) the diverter angle is optimized to interact with aortic flow without occluding the renal artery. Increases in renal artery flow rate occur for diverter angles less than 120°, and are maximized at around 80°. For a diverter length of 3 mm, maximum time-averaged increases of ~6% in renal artery flow rate were observed. This increases to ~8% for the 5 mm diverter length.
It is also possible for the flow diverter to reduce flow to the renal arteries. The maximum calculated decrease in renal artery flow rate was 10%, for a diverter length of 5 mm and renal branching angle of 145°. Decreases in renal artery flow rate occur at large diverter angles, generally above 130° for all diverter lengths and renal branching angles tested. This is consistent with the expectation that preferential direction or reduction of flow to the kidneys would be useful to respond to dynamic renal filtration demands during exercise or digestion, and to maintain blood pressure. This renal artery flow rate regulation might be achieved by the contraction of the smooth muscle component of the diverter, and not by contraction of the renal artery alone.
By causing flow separation and recirculation, and by reducing the WSS in the abdominal aorta, the flow diverter would seem to promote atherogenesis and plaque progression in the abdominal aorta distal to the renal ostia. The abdominal aorta’s susceptibility to atherosclerosis at this location (Wootton and Ku, 1999) may well be linked to this low WSS. Atherogenesis is promoted by decreased shear stress (<5 dynes/cm2) because it is associated with reduction in several vascular wall functions including endothelial nitric oxide synthase (eNOS) production, vasodilatation and endothelial cell repair. These reductions in function are coupled with increases in reactive oxygen species (ROS), endothelial permeability to lipoproteins, leukocyte adhesion, apoptosis, smooth muscle cell proliferation and collagen deposition (Silver et al, 2001).
The diverter also affects renal WSS, increasing caudal WSS by greater than 30% compared to corresponding diverter-free surface, and only slightly reducing the cranial WSS for diverter angles ranging from 45° and 80°. This atheroprotective role in the renal arteries may physiologically justify its atherogenic role in the abdominal aorta because lesion development is more likely to translate into a clinical event in the renal arteries due to the vessel diameters.
These postulated roles of the diverter merit further in vivo analysis, with patient-specific CFD analyses to be performed in concert. Of particular interest would be the question of whether the diverter angle can be modified with agents known to reduce renal blood flow, such as norepinephrine. Such agents can significantly alter the physiological flow parameters, and may also change the diverter’s orientation. This work also has implications for device design. When stenting is performed in the renal ostium, the diverter is often flattened or effectively removed by balloon expansion. A redesigned stent that preserved the diverter, or included an artificial diverter, might improve flow dynamics and, based on the current work, reduce restenosis in the renal artery. Preclinical studies with stents containing a “typical” diverter topology, and compared with clinical standards, would permit this theory to be tested. Another area of clinical interest is the possible role of the diverter in generating low renal artery hematocrit, which may enable renal function (Pappenheimer and Kinter, 1955).
The current work is limited by the modeling assumptions of Newtonian blood behavior and rigid arterial walls. Further work will evaluate the influence and appropriateness of these assumptions as well as attempt to validate these predictions in vivo.
The computational work described here was triggered by the discovery of the renal ostium flow diverter in porcine anatomy (Neufeld et al., 2010). Further imaging studies have since located the flow diverter in the human anatomy as well; Figure 14 shows a human CT scan showing the renal ostium flow diverter.
Figure 14.
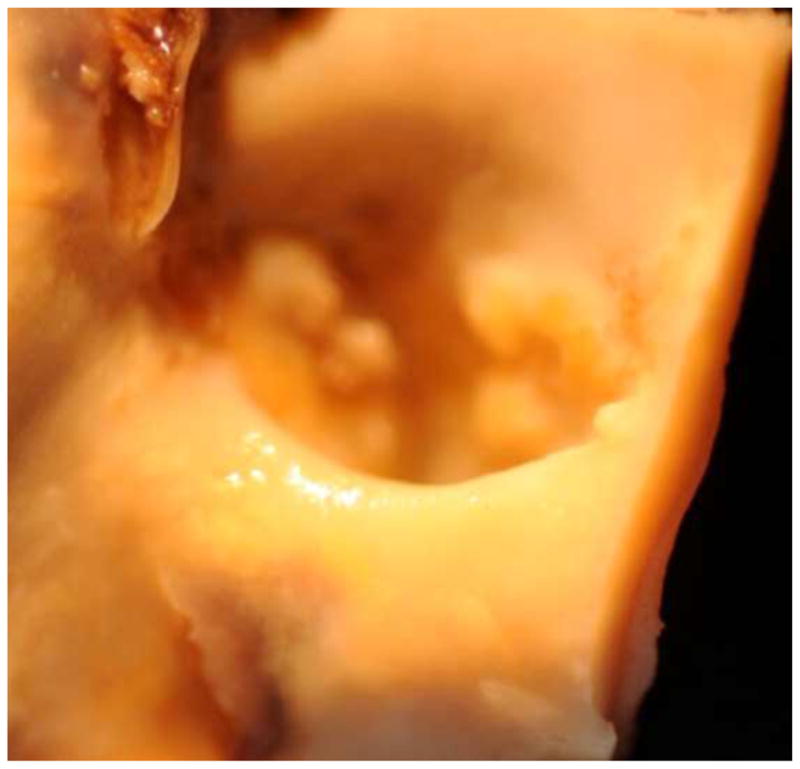
Renal ostium flow diverter as observed in human anatomy via CT scan.
Acknowledgments
The authors are grateful to the Lafayette College Departments of Mechanical and Chemical & Biomolecular Engineering, which supported the first authors’ completion of his undergraduate honors thesis on this subject. They also acknowledge the helpful contributions of Becky Rosenbauer, Peter Sun, Taimoor Sohail, Apratim Mukherjee, and Li-Yueh Hsu.
Footnotes
Conflict of Interest Statement
There are no conflicts of interest to report.
Publisher's Disclaimer: This is a PDF file of an unedited manuscript that has been accepted for publication. As a service to our customers we are providing this early version of the manuscript. The manuscript will undergo copyediting, typesetting, and review of the resulting proof before it is published in its final citable form. Please note that during the production process errors may be discovered which could affect the content, and all legal disclaimers that apply to the journal pertain.
References
- Berliner JA, Navab M, Fogelman AM, Frank JS, Demer LL, Edwards PA, Watson AD, Lusis AJ. Atherosclerosis: basic mechanisms. Oxidation, inflammation, and genetics. Circulation. 1995;91 (9):2488–2496. doi: 10.1161/01.cir.91.9.2488. [DOI] [PubMed] [Google Scholar]
- Buchanan JR, Kleinstreuer C, Hyun S, Truskey GA. Hemodynamics simulation and identification of susceptible sites of atherosclerotic lesion formation in a model abdominal aorta. Journal of Biomechanics. 2003;36:1185– 1196. doi: 10.1016/s0021-9290(03)00088-5. [DOI] [PubMed] [Google Scholar]
- Ivey J, Roach MR, Kratky RG. A new probability mapping method to describe the development of atherosclerotic lesions in cholesterol-fed rabbits. Atherosclerosis. 1995;115:73–84. doi: 10.1016/0021-9150(94)05501-9. [DOI] [PubMed] [Google Scholar]
- Kwon GP, Schroeder JL, Amar MJ, Remaley AT, Balaban RS. Contribution of macromolecular structure to the retention of Low-Density Lipoprotein at arterial branch points. Circulation. 2008;117:2919–2927. doi: 10.1161/CIRCULATIONAHA.107.754614. [DOI] [PMC free article] [PubMed] [Google Scholar]
- Ku D. Blood flow in arteries. Annual Review of Fluid Mechanics. 1997;29:399–434. [Google Scholar]
- Moore JE, Ku DN. Pulsatile velocity measurements in a model of the human abdolminal aorta under resting conditions. Journal of Biomechanical Engineering. 1994;116:337–345. doi: 10.1115/1.2895740. [DOI] [PubMed] [Google Scholar]
- Mostbeck GH, Dulce MC, Caputo GR, Proctor E, Higgins CB. Flow pattern analysis in the abdominal aorta with velocity-encoded Cine MR imaging. Journal of Magnetic Resonance Imaging. 1994;3:617–623. doi: 10.1002/jmri.1880030411. [DOI] [PubMed] [Google Scholar]
- Murphy CL, Lever MJ. Sulphorhodamine-B-labelled albumin uptake around the ostium of the renal artery in rabbits: changes with age. Journal of Vascular Research. 2002;39(2):104–113. doi: 10.1159/000057759. [DOI] [PubMed] [Google Scholar]
- Neufeld EB, Springer D, Yu Q, Balban RS. The renal artery ostium flow diverter: structure and potential role in atherosclerosis. Atherosclerosis. 2010;211:153–158. doi: 10.1016/j.atherosclerosis.2010.01.024. [DOI] [PMC free article] [PubMed] [Google Scholar]
- Nguyen N, Haque A. Effect of hemodynamic factors on atherosclerosis in the abdominal aorta. Atherosclerosis. 1990;84:33–39. doi: 10.1016/0021-9150(90)90005-4. [DOI] [PubMed] [Google Scholar]
- Pappenheimer JR, Kinter WB. Hematocrit ratio of blood within mammalian kidney and its significance for renal hemodynamics. American Journal of Physiology. 1955;185(2):377–390. doi: 10.1152/ajplegacy.1956.185.2.377. [DOI] [PubMed] [Google Scholar]
- Perktold K, Peter R. Numerical 3D-simulation of pulsatile wall shear stress in an arterial T-bifurcation model. Journal of Biomedical Engineering. 1990;12 (1):1–12. doi: 10.1016/0141-5425(90)90107-x. [DOI] [PubMed] [Google Scholar]
- Safian RD, Textor SC. Renal artery stenosis. New England Journal of Medicine. 2001;344:431–42. doi: 10.1056/NEJM200102083440607. [DOI] [PubMed] [Google Scholar]
- Silver M, Gotlieb AI, Schoen FR. Cardiovascular Pathology. 3 Churchill-Livingstone; 2001. [Google Scholar]
- Stroud JS, Berger SA, Saloner D. Numerical analysis of flow through a severely stenotic carotid artery bifurcation. Journal of Biomechanical Engineering. 2002;124:9–20. doi: 10.1115/1.1427042. [DOI] [PubMed] [Google Scholar]
- Taylor CA, Hughes TJ, Zarins CK. Finite element modeling of three-dimensional pulsatile flow in the abdominal aorta: relevance to atherosclerosis. Annals of Biomedical Engineering. 1998;26:975–987. doi: 10.1114/1.140. [DOI] [PubMed] [Google Scholar]
- Thubrikar MJ. Vascular Mechanics and Pathology. Springer; 2007. [Google Scholar]
- Wootton DM, Ku DN. Fluid mechanics of vascular systems, diseases, and thrombosis. Annual Review of Biomedical Engineering. 1999;1:299–329. doi: 10.1146/annurev.bioeng.1.1.299. [DOI] [PubMed] [Google Scholar]
- Vignon-Clementel IE, Figueroa CA, Jansen KE, Taylor CA. Outflow boundary conditions for three-dimensional finite element modeling of blood flow and pressure in arteries. Computer methods in applied mechanics and engineering. 2006;195:3776–3796. [Google Scholar]
- Yamamoto T, Ogasawara Y, Kimura A, Tanaka H, Hiramatsu O, Tsukioka K, Lever MJ, Parker KH, Jones CJ, Caro CG, Kajiya F. Blood velocity profiles in the human renal artery by Doppler ultrasound and their relationship to atherosclerosis. Arteriosclerosis, Thrombosis, and Vascular Biology. 1996;16:172–177. doi: 10.1161/01.atv.16.1.172. [DOI] [PubMed] [Google Scholar]


