Abstract
We have investigated the use of a Gaussian beam laser for MALDI Imaging Mass Spectrometry to provide a precisely defined laser spot of 5 µm diameter on target using a commercial MALDI TOF instrument originally designed to produce a 20 µm diameter laser beam spot at its smallest setting. A Gaussian beam laser was installed in the instrument in combination with an aspheric focusing lens. This ion source produced sharp ion images at 5 µm spatial resolution with signals of high intensity as shown for images from thin tissue sections of mouse brain.
Introduction
We report the use of a Gaussian laser beam delivered to the target by diffraction limited laser optics, implemented in a Bruker MALDI TOF instrument. The development of an optimized sample preparation protocol resulted in high signal to noise protein spectra from a 5 µm size laser spot. The modifications described allow such high spatial resolution imaging MS to be achieved on a routine basis.
High spatial resolution (<10 µm) for MALDI Imaging Mass Spectrometry (IMS) [1] is required in some biological applications but are not achievable using the optical configuration of current commercial instruments. The final spatial resolution of the IMS analysis is mainly influenced by the diameter of the laser beam on target and the raster pitch, i.e., the spacing between the individual ablated spots or pixels [2]. In previous work [3] it was shown that the most effective approach to achieve <10 µm spatial resolution was to use lenses and other optic devices, such as a spatial filter (pinhole), to produce the desired laser spot size on target. However, in order to achieve the optimal focusing condition with the smallest possible laser spot size, a clean Gaussian beam profile is preferred. Other solutions introduces losses in laser fluence, especially if the original unfiltered beam is non-uniform. For example, the SmartBeam laser beam profile is comprised of several intense spots; the pinhole may block up to 90% of the laser energy in order to approximate a Gaussian beam profile. However, in several works [4–6] it was shown that to maximize the ion yield for a smaller laser spot size, the maximum available output laser energy on target is a critical parameter. In order to maximize the output of a pinhole filter, the original incoming laser beam should have a profile as close to the Gaussian as possible. A quazi-Gaussian profile is typically generated by solid state lasers with high quality laser crystals and subsequent harmonic generation in nonlinear crystals. For example, the Nd:YAG laser with a third harmonic crystal produces a beam profile close to a Gaussian profile. Utilizing this beam would dramatically increase the output of the spatial filtered beam or would allow the laser beam to be used directly without filtration. Such a laser is incorporated in the SmartBeam laser system before the pattern generator [7].
The primary lasers used in MALDI instruments for many years were nitrogen gas lasers. These lasers inherently generate a random beam profile comprised of multiple hot spots. The Bruker Daltonik SmartBeam pattern generator was introduced as a means to create a similar beam profile using solid state lasers [7]. Attempts to use the Nd:YAG lasers for MALDI without an additional pattern generator have been made for over 2 decades, but were not successful due to low ionization efficiency per amount of material ablated for such beam profiles at spot sizes above 50 µm. However, for the smaller laser spot sizes the ionization efficiency per amount of material ablated is up to 6 orders of magnitude higher, as demonstrated for Gaussian beam profiles without the additional spot patterning [4–6]. These results suggest the Gaussian beam profile has to be revisited as a promising tool for applications requiring a laser spot size below 10 µm and high ion yield, such as in the case of high spatial resolution imaging MS.
The diffraction limited focussing of a Gaussian beam on target is another important consideration. Regular spherical lenses produce ring aberations around the main central spot in the focal plane. The rings may concentrate laser fluence above the threshold of damage to the matrix / analyte, and show lower ionization efficiency. For imaging MS applications, the rings lead to oversampling artifacts during a raster scan, typically reducing the signal to noise ratio of the MS spectra, image contrast, and spatial resolution. However, current progress in aspheric optics provides focusing lenses having 1–2 orders of magnitude lower ring intensity, resulting in sharper images.
In the current work, we demonstrate the use of a Gaussian beam laser in combination with an aspheric lens to achieve high spatial resolution IMS.
Methods
A commercially available MALDI MS Autoflex Speed TOF/TOF (Bruker Daltonics) was used in these experiments. MALDI MS analyses were performed in the positive ion linear mode for proteins and negative ion reflector mode for lipids using the FlexControl 3.3 software package. Between 50 to 200 shots/spot were acquired with a 1kHz repetition rate Smartbeam II Nd:YAG laser (355 nm). Image acquisition was carried out using FlexImaging 3.0 and spectral analysis with FlexAnalysis 3.3.
For comparative experiments, the Bruker SmartBeam II laser unit was replaced by a Bruker Nd:YAG laser unit having a Gaussian beam profile. In addition, a pinhole was mounted on a rotating mount, similar to [3], to be able to introduce spatial filtration mechanically into or out of the laser beam without compromising the vacuum system. The standard spherical focusing lens inside the sample chamber was replaced by precisely aligned fused silica aspheric lens.
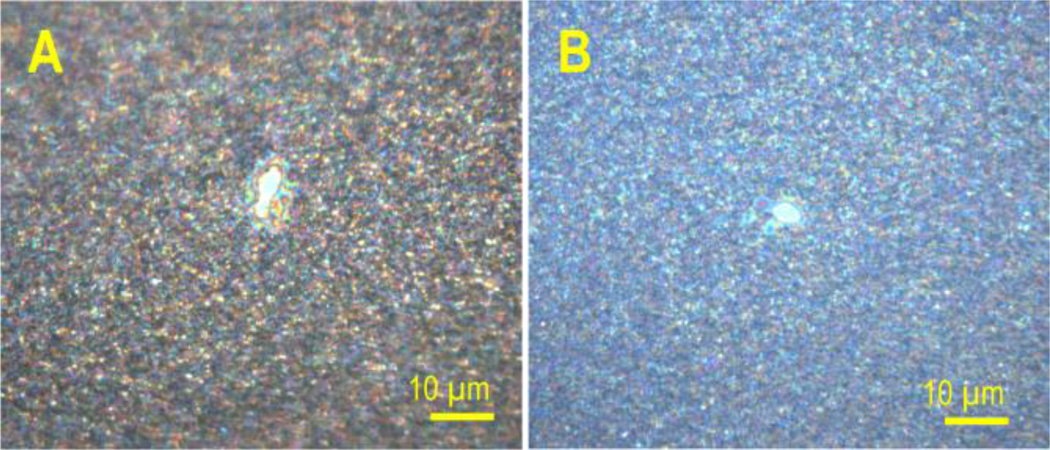
The laser beam characteristics were studied indirectly by examination of ablation patterns in the matrix layer, introduced in [3]. The aspheric lens position along the optical Z axis was tuned in 100 µm increments. An additional fine tuning of the spot size was done by an internal lens, incorporated inside the laser box and controlled by the FlexControl software. After each positioning of the aspheric lens, the sample chamber was pumped down to the working vacuum pressure and the spot size was estimated from the size of the bright laser spot reflection on screen using the original instrument video camera. At the smaller laser spot sizes the matrix layer was ablated and ablation patterns were measured under microscope. Figure 1 shows the site of the ablation spots at optimal positions of both the aspheric lens and the computer controlled lens. Figure 1, panel A shows the spot, ablated by an unfiltered laser beam with the pinhole in the “out” position and panel B shows the result for spatially filtered beam using a 30 µm pinhole in the “in” position. In order to investigate possible oversampling effects, several MS images of the same sample were taken using different raster spacing. The s/n ratio of the peaks in a global average spectrum for each image was evaluated in terms of its dependence on the raster pitch value.
Figure 1.
Optical micrographs of laser spots burned into a sublimed DHB layer using 50 laser shots: A – Gaussian beam laser focused by an aspheric lens without spatial filtration, and B – additionally spatially filtered using a 30 µm pinhole.
Fresh frozen thaw mounted sections of mouse cerebellum tissues were used. Rinsing, sublimation with matrix, and vapor treatment protocols were optimized to give the best ionization efficiency, micron size matrix grain, and minimal delocalization [3, 8].
Sinapinic acid (SA), 1,5-Diaminonaphthalene (DAN), chloroform, and methanol were obtained from Sigma, and Indium tin oxide (ITO) coated glass slides from Delta Technologies. Frozen mouse brain samples, stored at −80°C were purchased from Pel Freez (Rogers, AR). The tissue sections were cut at 10 µm thickness, thaw mounted on ITO glass slides, and dried in a vacuum desiccator for 30 min.
For protein imaging, fresh cut sections were rinsed, sublimed with SA and recrystallized using a previously described protocol [8].
Results and Discussion
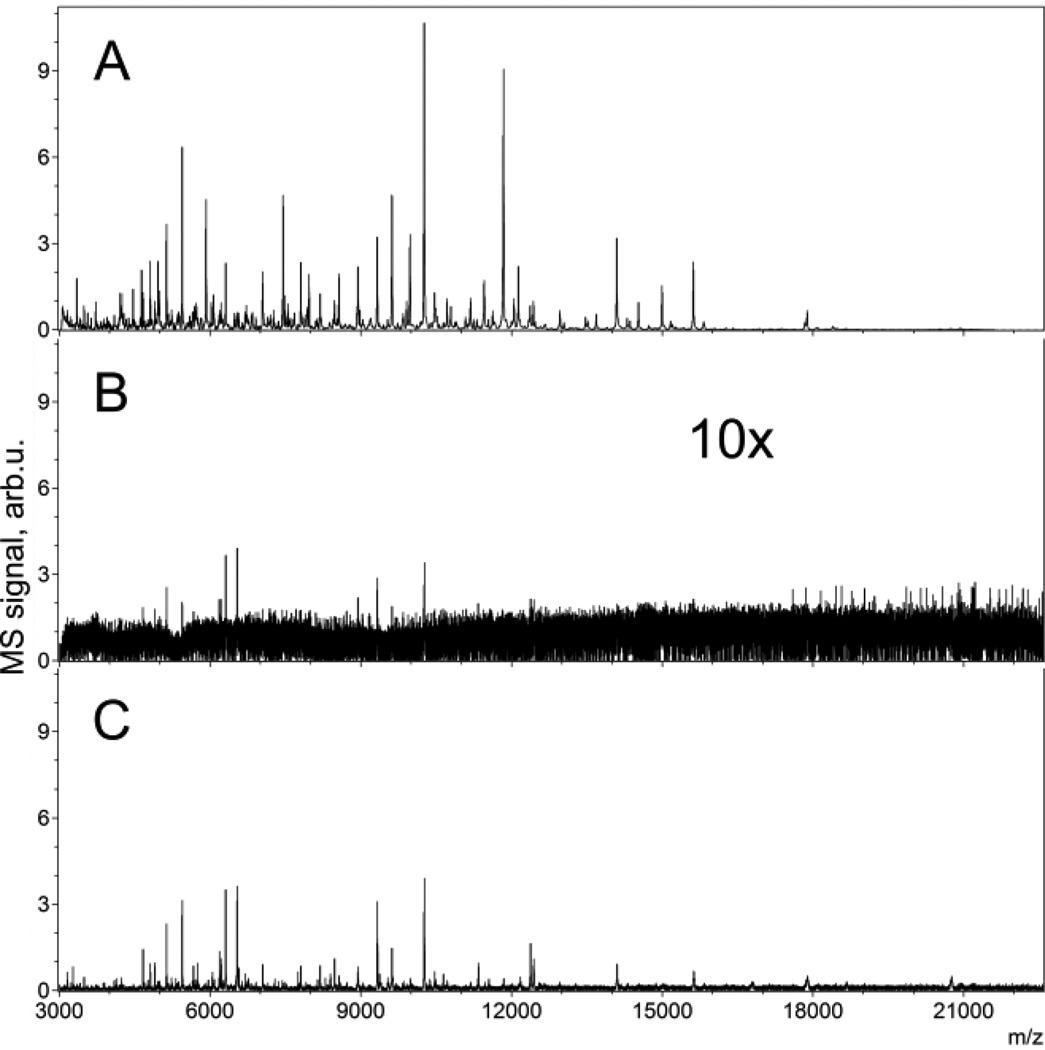
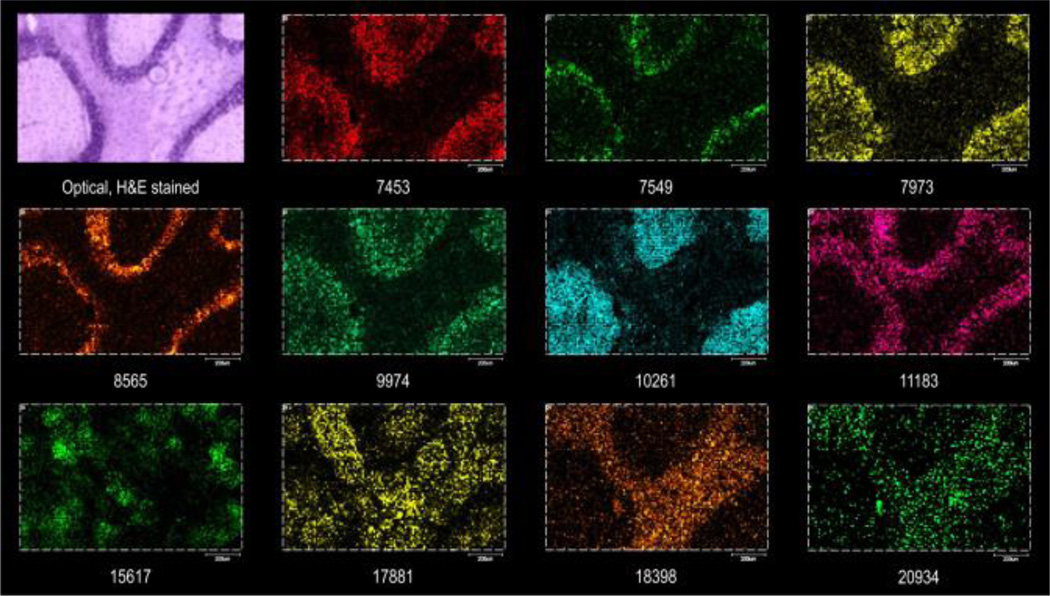
For IMS of proteins, using a SmartBeam laser with or without spatial filtration, it was difficult to obtain good quality protein spectra at 5 µm raster spacing. However, using a Gaussian laser and aspheric lens, high quality spectra for proteins and images were acquired with a 5 µm spot size and 5 µm raster spacing with the laser energy attenuated to only 10% of the maximum. Figure 2, panel A shows the average mass spectrum, acquired from a mouse cerebellum section and Figure 3 shows the corresponding MS images from the same experiment. An optical micrograph of an H&E stained serial section is shown also for comparison. The mass spectra and images taken at 5 µm spatial resolution using the Gaussian profile demonstrate over 50 peaks at a s/n ratio higher than 5 within the 3.5–25k m/z range. Similar attempts with the SmartBeam resulted in 10 peaks at a 10 µm raster pitch and essentially no peaks with a 5 µm raster pitch at this s/n value (Figure 2, panels C and B, respectively).
Figure 2.
Average protein mass spectra acquired from a mouse cerebellum: section: A – spectrum from the same experiment as the images shown in Figure 3 at a 5 µm laser spot size with a Gaussian laser and aspheric lens, and 5 µm raster; B - with the original instrument configuration and the same 5 µm raster; and C – with the original instrument configuration, but using a 10 µm raster.
Figure 3.
MALDI TOF MS protein images from mouse cerebellum at 5 µm raster pitch using a Gaussian beam laser and focusing aspheric lens. Top left panel – optical image of H&E stained serial section.
Images taken at a 5 µm spot size and at a 5 µm raster pitch show high levels of detail, permitting visualization of axon fibers and granular cells, Purkinje cells and some of their surrounding dendrites. The MS images of the tissue sections correlate well with high resolution H&E stained serial sections, routinely allowing extended high spatial resolution imaging capabilities at the cellular level.
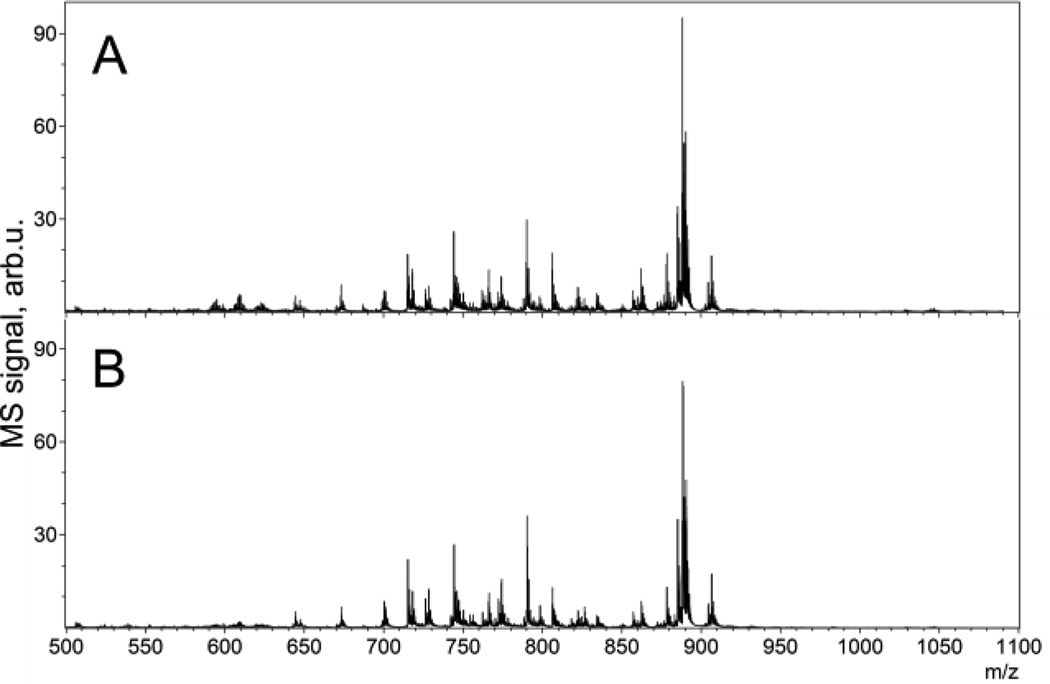
For lipids, using a 5 µm spot size and a 15 µm raster pitch and below, the mass spectra in negative ion mode demonstrate 30% more peaks with a higher s/n ratio as compared to an unmodified instrument having the original SmartBeam laser at minimum beam size settings (Figure 4). The mass spectra acquired with the modified instrument had similar peak profiles, but showed a higher s/n ratio and a greater number of peaks detected.
Figure 4.
MALDI TOF MS lipid spectra averaged over 1000 pixels, acquired from a mouse cerebellum section at a 5 µm raster pitch: A - using a Gaussian beam laser with a focusing aspheric lens; and B – using the original instrument configuration.
To estimate the degree of oversampling, lipid MS images acquired at 5, 10 and 15 µm raster pitch were obtained and it was found that there was no s/n value degradation in MS signal when the raster pitch was decreased from 15 µm to 10 µm. For the 5 µm raster pitch, only a 10% s/n degradation was observed due to minor oversampling. An additional potential cause of the oversampling artifacts besides the matrix damage caused by aberration rings around the laser spot may be due to instrument translation stage jitter.
Conclusions
We have experimentally demonstrated routine imaging MS of proteins in tissue sections with 5 µm spatial resolution using a MALDI TOF instrument, modified with Gaussian laser beam and aspheric lens.
Our experiments show that while for larger spot sizes the SmartBeam laser beam profile is superior to the Gaussian profile, once the spot is of a similar size (or less) than the structures of the patterns in the SmartBeam, it is beneficial to use a Gaussian profile laser instead. The benefits are significant for high mass molecules such as proteins.
These observations suggest that in order to provide optimal MALDI performance for IMS at all possible spatial resolutions on a single platform, the instrument should be equipped with both a Gaussian laser beam (laser spot sizes between 5–15 µm) and a pattern generator (laser spot sizes >20 µm) that can be removed from the optical path. This development would significantly enhance the quality of IMS at high spatial resolution, making it a routine experiment for the analysis of biological samples.
Acknowledgement
This project was supported by grants from the National Institutes of Health 5P41GM103391-03 and NIH/NIGMS 5R01 GM058008-14.
References
- 1.Caprioli RM, Farmer TB, Gile J. Molecular imaging of biological samples: localization of peptides and proteins using MALDI-TOF MS. Anal Chem. 1997;69:4751–4760. doi: 10.1021/ac970888i. [DOI] [PubMed] [Google Scholar]
- 2.Hillenkamp F, UnsoLd E, Kaufmann R, Nitsche R. Laser microprobe mass analysis of organic materials. Nature. 1975;256:119–120. doi: 10.1038/256119a0. [DOI] [PubMed] [Google Scholar]
- 3.Zavalin A, Yang J, Caprioli R. Laser Beam Filtration for High Spatial Resolution MALDI Imaging Mass Spectrometry. Journal of the American Society for Mass Spectrometry. 2013;24:1153–1156. doi: 10.1007/s13361-013-0638-5. [DOI] [PMC free article] [PubMed] [Google Scholar]
- 4.Dreisewerd K, Schürenberg M, Karas M, Hillenkamp F. Influence of the laser intensity and spot size on the desorption of molecules and ions in matrix-assisted laser desorption/ionization with a uniform beam profile. International Journal of Mass Spectrometry and Ion Processes. 1995;141:127–148. [Google Scholar]
- 5.Qiao H, Spicer V, Ens W. The effect of laser profile, fluence, and spot size on sensitivity in orthogonal-injection matrix-assisted laser desorption/ionization time-of-flight mass spectrometry. Rapid Communications in Mass Spectrometry. 2008;22:2779–2790. doi: 10.1002/rcm.3675. [DOI] [PubMed] [Google Scholar]
- 6.Guenther S, Koestler M, Schulz O, Spengler B. Laser spot size and laser power dependence of ion formation in high resolution MALDI imaging. International Journal of Mass Spectrometry. 2010;294:7–15. [Google Scholar]
- 7.Holle A, Haase A, Kayser M, Höhndorf J. Optimizing UV laser focus profiles for improved MALDI performance. Journal of Mass Spectrometry. 2006;41:705–716. doi: 10.1002/jms.1041. [DOI] [PubMed] [Google Scholar]
- 8.Yang J, Caprioli RM. Matrix Sublimation/Recrystallization for Imaging Proteins by Mass Spectrometry at High Spatial Resolution. Analytical Chemistry. 2011;83:5728–5734. doi: 10.1021/ac200998a. [DOI] [PMC free article] [PubMed] [Google Scholar]


