Figure 6.
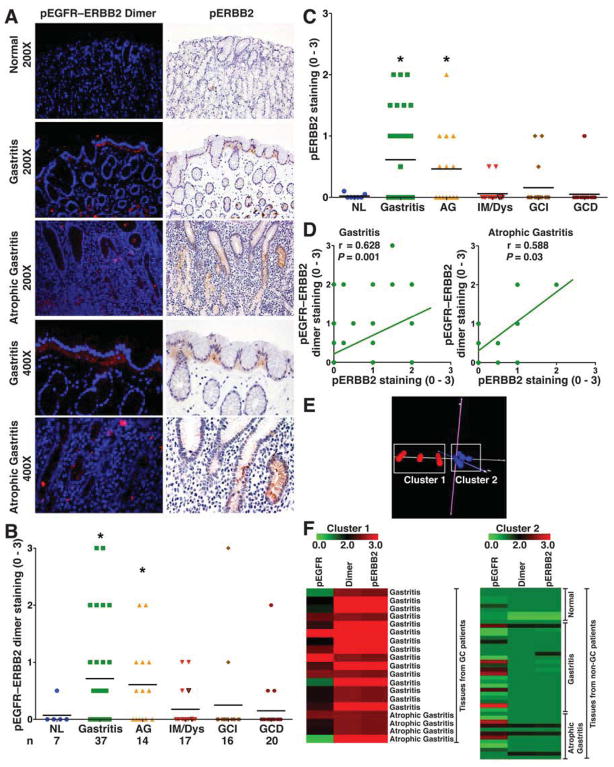
pEGFR–ERBB2 dimer and pERBB2 in human tissue microarray. (A) Immunofluorescence-based PLA for pEGFR–ERBB2 dimer and immunohistochemistry for pERBB2 (Y1221/1222). (B and C) Scoring of pEGFR–ERBB2 dimer and pERBB2 (Y1221/1222) staining intensity in epithelial cells from PLA and immunohistochemistry analysis, respectively. (D) Correlation (Pearson coefficient) between levels of pEGFR–ERBB2 dimer and pERBB2 (Y1221/1222). (E) Principal component analysis of TMA cores for the levels of pEGFR, pEGFR–ERBB2 dimer, and pERBB2 in gastritis and atrophic gastritis tissues from 32 non-cancer and 19 cancer subjects. (F) Heat maps for levels of pEGFR, pEGFR–ERBB2 dimer, and pERBB2 in Cluster 1 and Cluster 2. In B and C, *P < .05 vs normal tissues.

