

Abstract
Objective
Although brainstem dys-synchrony is a hallmark of children with auditory neuropathy spectrum disorder (ANSD), little is known about how the lack of neural synchrony manifests at more central levels. We used time-frequency single-trial EEG analyses (i.e., inter-trial coherence; ITC), to examine cortical phase synchrony in children with normal hearing (NH), sensorineural hearing loss (SNHL) and ANSD.
Methods
Single trial time-frequency analyses were performed on cortical auditory evoked responses from 41 NH children, 91 children with ANSD and 50 children with SNHL. The latter two groups included children who received intervention via hearing aids and cochlear implants. ITC measures were compared between groups as a function of hearing loss, intervention type, and cortical maturational status.
Results
In children with SNHL, ITC decreased as severity of hearing loss increased. Children with ANSD revealed lower levels of ITC relative to children with NH or SNHL, regardless of intervention. Children with ANSD who received cochlear implants showed significant improvements in ITC with increasing experience with their implants.
Conclusions
Cortical phase coherence is significantly reduced as a result of both severe-to-profound SNHL and ANSD.
Significance
ITC provides a window into the brain oscillations underlying the averaged cortical auditory evoked response. Our results provide a first description of deficits in cortical phase synchrony in children with SNHL and ANSD.
Keywords: Auditory Neuropathy Spectrum Disorder, ANSD, Cortical Auditory Evoked Potentials, P1 CAEP, Inter-Trial Coherence, Cortical Phase Synchrony, Sensorineural Hearing Loss, Development, Cortical Maturation, Cochlear Implant, Hearing Aid
1. INTRODUCTION
Auditory neuropathy spectrum disorder (ANSD) is a recently described form of hearing loss. It is estimated that ANSD may be present in 10–15% of infants and children with sensorineural hearing loss (e.g., Uus and Bamford, 2006; Berlin et al., 2010; Roush et al., 2011). While patients with ANSD have essentially normal outer hair cell (OHC) function as measured by otoacoustic emissions (OAE) and the acquisition of a cochlear microphonic, neural synchrony is deficient as evidenced by abnormal or absent auditory brainstem responses (ABR; Starr et al., 1991, Berlin et al., 1998, Berlin et al., 2003). The site of lesion in ANSD (i.e., the origin of the dys-synchrony characteristic of ANSD) is thought to be at the level of the inner hair cells (IHC), the synapse between the IHC and the VIII nerve, or the VIII nerve, or any combination of the same (Starr et al., 1996). The degree of hearing loss found in patients with ANSD ranges from mild to profound. Treating ANSD presents a particular challenge to audiologists, as behavioral pure tone thresholds tend to fluctuate, as do speech performance measures (Starr et al., 1996, Sininger and Oba, 2001, Cone-Wesson, 2004, Zeng and Liu, 2006, Wolfe and Clark, 2008, Swanepoel, Johl and Pienaar, 2013). In addition, speech performance measures do not necessarily correspond to the levels of hearing loss noted in ANSD patients (Rance, 2005, Sharma et al., 2011). Therefore, the severity of dys-synchrony in a given patient with ANSD may not be related to the severity of the hearing loss and cannot be characterized easily with behavioral measures.
It is reasonable to assume that the effects of ANSD on behavioral performance are related to the severity of the underlying neural dys-synchrony (Sharma et al., 2011; Cardon et al., 2012; Cardon and Sharma 2013). However, traditional physiologic measures such as ABR have limited utility in assessing the severity of ANSD since the short latency ABR recordings require very high levels of precisely synchronous neural firing and are absent or abnormal in all children with ANSD. In contrast, cortical auditory evoked potentials (CAEPs), which occur over much longer latency and are able to absorb greater jitter in the underlying neural synchrony (Michalewski et al., 1986, Kraus et al., 2000), have been more successfully elicited in ANSD patients (see Cardon et al., 2012 for a review). Studies of cortical development using averaged CAEP responses have shown that the obligatory P1 CAEP response latency is a strong predictor of behavioral outcome in children with ANSD (Rance et al., 2002, Campball et al., 2011, Sharma et al., 2011, Alvarenga et al., 2012, Cardon et al., 2012, Cardon and Sharma, 2013). For example, Sharma et al., (2011) showed that approximately a third of ANSD children in their study had normal P1 latencies. Additionally, they reported a strong correlation (r = −0.86) between P1 latencies and the IT-MIAS test of auditory skill development for infants and children with ANSD. Furthermore, the children with normal P1 CAEP responses presented with significantly larger P1 peak amplitudes, which may be indirectly indicative of more robust neural synchrony (Starr et al., 2001). Thus far, CAEP studies in ANSD patients have relied on averaged evoked potential recordings; therefore, they were unable to directly examine the underlying cortical synchrony that is assimilated within the aggregate cortical evoked potential response. Given that neural dys-synchrony is a main symptom of ANSD, a direct measure of cortical synchrony could have clinical relevance for the ANSD population.
Time-frequency analyses adopt a different perspective on the evoked response from the traditional time-only analyses where component peaks are averaged, while the remainder of the evoked potential signal is considered to be noise and disregarded. In time-frequency analyses, the focus is on brain oscillations, which can be detected using a time-frequency decomposition of the EEG. When spontaneous EEG is interrupted by a stimulus event (such as a sound), the distribution of EEG phase becomes “phase-locked” to that event (Makeig et al., 2004) and this phase synchronization of brain oscillations can be determined by computing phase relations across single trials. Phase synchronization of brain oscillations within and between cortical areas is a fundamental mechanism involved in information processing and has been found to be critical for feature-binding and other cognitive processes (Tass et al., 1998, Palva et al., 2005). Inter-trial coherence (ITC) is a measure that is computed from single trial EEG, which reflects the temporal and spectral synchronization within EEG, elucidating the extent to which underlying phase-locking occurs. Thus, ITC provides a direct measure of cortical synchrony that is not available in the aggregate evoked response waveform (Makeig et al., 2004).
While time-frequency analyses are relatively new, they have been used in recent studies to examine auditory development and processing. Studies of central auditory maturation have shown that there is an increase in stimulus induced phase synchronization in NH children between childhood and adolescence (Müller et al., 2009, Bishop et al., 2011). An increase in phase synchrony has also been associated with the mismatch negativity event-related potential, which reflects auditory discrimination (Ko et al., 2012). Additionally, changes in cortical phase patterns have been described as an important mechanism that allows for accurate speech discrimination—specifically, the intelligibility of syllabic patterns (Luo and Poeppel, 2007, Howard and Poeppel, 2010). In a recent study from our group (Nash-Kille A, Sharma A, Gilley P, in preparation), we reported decreased cortical phase synchrony to speech presented in the affected ear of a pediatric patient with unilateral ANSD. In all, these findings suggest that greater phase synchrony seems to underlie better developmental progress and behavioral ability.
In the current study, we examined phase synchrony of cortical oscillations elicited by a speech stimulus in children with ANSD. Our measure of cortical phase synchronization was inter-trial coherence (ITC). Our aim was to examine the extent to which the disruption in neural synchrony, which characterizes children with ANSD, affects cortical phase synchronization, allowing us to better evaluate the severity of the cortical synchrony deficit in children with ANSD. In this report, we examined cortical phase synchrony using ITC in children with ANSD who received intervention with hearing aids and cochlear implants. Children with NH and SNHL (who were also fitted with hearing aids and cochlear implants) were evaluated for comparison with ANSD patients.
2. METHODS
2.1. Participants
This study was retrospective in nature, as the cortical auditory evoked potential data used were collected in the Brain and Behavior Laboratory over a period of 15 years. Data were analyzed from a total of 91 children with ANSD. Since the ANSD population is inherently heterogeneous, a large sample size helped to ensure that individual variations would not be missed. Children with ANSD were further divided into those that received no intervention (NI) or received intervention with hearing aids (HA) and cochlear implants (CI). Forty-one children with normal hearing (NH) were included as controls. Fifty children with SNHL were included, who were further divided into children fitted with HAs or CIs. While efforts were made to include children of similar ages in each group, the data were limited by the retrospective nature of the study. Sample sizes and ages for each group are included in Table 1.
Table 1.
Sample sizes and test ages for participants with normal hearing (NH), sensorineural hearing loss (SNHL), and auditory neuropathy spectrum disorder (ANSD) separated into groups based on types of intervention—either hearing aids (HA) or cochlear implants (CI)—or no intervention (NI). All ages are reported in years.
| Group | N | Age Range | Mean Age | Median Age |
|---|---|---|---|---|
| NH | 41 | 0.1 – 11.1 | 3.94 | 2.32 |
| SNHL (HA) | 31 | 0.59 – 14.81 | 4.23 | 2.73 |
| SNHL (CI) | 19 | 2.23 – 15.29 | 6.82 | 6.05 |
| ANSD (NI) | 15 | 0.21 – 9.95 | 4.98 | 5.64 |
| ANSD (HA) | 54 | 0.34 – 11.55 | 3.42 | 2.86 |
| ANSD (CI) | 22 | 1.35 – 8.39 | 4.32 | 3.75 |
Each participant with ANSD was clinically diagnosed through the use of ABR and OAE measures (either through clinician report or access to the tracings). For the children with ANSD with detailed test information (N = 65), 100% showed absent or abnormal ABR’s with CM reversal (although CM was unclear in one case, OAE results were available), and 44.3% had present OAE’s (either DPOAE or TEOAE). 36.9% were clinically diagnosed as having mild to moderate hearing loss (with unaided pure tone averages of 500, 1000, and 2000 Hz that were less than or equal to 65 dB HL), while 63.1% were diagnosed as having severe to profound hearing loss (with pure tone averages that were greater than 65 dB HL). For ANSD children fitted with hearing aids for whom aided auditory threshold information was available (N = 23), average aided thresholds were 43 dB HL. Detailed information about related risk factors and diagnoses were available for 84 of the 91 children included in the ANSD sample. Table 2 includes summaries of the most common medical risk factors and concomitant diagnoses.
Table 2.
Risk factors and concomitant medical diagnoses for the group of participants with auditory neuropathy spectrum disorder (ANSD).
| Risk Factor or Diagnosis | Percent (N = 84) |
|---|---|
|
| |
| Prematurity | 36.9 |
| Hyperbilirubinemia | 26.2 |
| Anoxia at birth or lung disorders | 26.2 |
| Neural insult (malformation or injury) | 21.4 |
| Exposure to ototoxic medications | 16.7 |
| Seizure disorders | 10.7 |
| Family history of hearing loss | 10.7 |
| Heart disorders | 9.5 |
| Syndromic diagnoses | 6.0 |
| No reported risk factors/otherwise healthy | 11.9 |
Children with SNHL were diagnosed clinically through pure tone audiometry and/or ABR measures. Children with sensorineural hearing loss had uncomplicated histories in comparison to the children in the ANSD group. Two children in the sensorineural hearing loss groups presented with hearing loss secondary to meningitis, two were affected by congenital CMV, one child had cerebral palsy, and one was diagnosed with perinatal hyperbilirubinemia. One child had a concomitant diagnosis of congenital heart problems.
Each SNHL participant with a hearing aid or cochlear implant (SNHL-HA and SNHL-CI, respectively) had at least 6 months of experience with his or her respective interventions at the time of CAEP testing. Normal hearing participants were confirmed to have normal hearing through typical audiometric screening methods, with thresholds of less than 15 dB HL in each ear, and no history of previous hearing or speech deficits. All data were collected with appropriate IRB approval and informed consent procedures for human subjects research. Prior to analysis, all data were de-identified and managed with appropriate concern for the confidentiality of information obtained during testing.
2.2. Data Collection
CAEPs were recorded on these participants over several years and the procedures are reported in previous studies from our group (e.g., Sharma et al., 2002b, c; 2011). Participants were seated in a comfortable chair or in their parents’ laps in a sound-treated booth, and watched a movie of their choice (without sound) during the data collection process. The synthesized speech stimulus/ba/was presented in sound field at a level that was comfortably audible for each participant (typically 85 dB SPL/75 dB HL). The stimulus used is identical to that used in other studies from our lab (Sharma et al., 1997, Sharma et al., 2002a, Sharma et al., 2002b, Sharma et al., 2011). The/ba/stimulus was 90 milliseconds in length, with voicing for the first 80 milliseconds of the signal. The starting frequencies of F1 and F2 were 234 and 616 Hz, and the center frequencies for the/a/vowel were 769, 2862, 3600, and 4500 Hz for the formants. Stimuli were presented with an interstimulus interval of 610 milliseconds. Participants who were tested with their HAs and CIs had them set to their usual settings. Audibility was verified by reviewing audiological records and by patient observation during testing. Participants were not given any particular instructions to attend to the stimulus, and in general, attended to the silenced movie instead. At least two recording runs of several hundred trials per subject were collected, to determine waveform replicability following analysis. Enough data were collected to allow for at least 250 trials to remain after artifact rejection techniques.
Evoked potentials were collected using a Compumedics Neuroscan evoked potentials system. Cortical activity was recorded using Ag/AgCl electrodes. For children without CIs, Cz served as the active electrode with the reference on the mastoid or earlobe. In order to minimize the electrical artifact produced by CIs, we recorded responses along the isopotential contour and minimized the artifact using common mode rejection cancellation techniques. A reference electrode was placed at Cz and several active electrodes were placed at locations around the forehead, nasion, orbits, and mastoids. A ground electrode was placed on the forehead. Details of this procedure are discussed in detail in a previous publication by our group (Gilley et al., 2006). Eye blinks were recorded with an electrode at the superior orbit position referenced to an electrode at the lateral canthus.
P1 CAEP latencies were computed for children with ANSD. These have been reported in previous publications (Sharma et al., 2011 and Cardon and Sharma 2013). As described in those publications, P1s were compared to the 95% confidence intervals for normal P1 latency development (Sharma et al., 2002b) and categorized as having normal latencies, delayed latencies, or as being absent/abnormal.
2.3. Data Analysis
Continuous data files were divided into epochs of 700 milliseconds, including a 100-millisecond pre-stimulus interval (i.e., −100 to 600 milliseconds). Eye blinks were identified and rejected using a combination of microvolt threshold rejection (+/− 100 microvolts) and spatial filtering (in the case of 64-channel cap data). These files were averaged and examined for appropriate morphology before using the single trials in additional analysis.
For the purposes of this study and for continuity, Cz referenced to mastoid was chosen as the electrode of interest. The exception to this was with the subjects with cochlear implants—for these participants, the electrode with the least visible electrical artifact was used. Determination of the electrode with the least visible artifact was accomplished through the agreement of at least two trained observers. Unaveraged segmented files from each participant were imported into MATLAB using the EEGLAB toolbox, and a time-frequency analysis was performed on the concatenated trials for each individual. Since the EEGLAB program cannot analyze data that include a measurement of zero microvolts at any time within the recording, a small amount (0.00001 microvolts) was added to all microvolt levels to attempt to avoid the potential mathematical error of division by zero. Wavelet length was limited to 0.5 Hz (so, 0.5 Hz at the lowest, and 3.2 Hz at the highest), and the frequency analysis was oversampled with a padding ratio of 4, to give a smoother looking plot. It should be noted that time-frequency analysis of this type has trade-offs for time and frequency resolution: increased resolution in one domain leads to smearing of information in the other. The program divides the recording into sampling bins of 200 time points (from −28.4 ms to 528.4 ms) and 24 linearly spaced frequencies (from 3.9 to 50 Hz). The bootstrap significance level for identifying significant levels of ITC for a given sampling bin was set to 0.01. Inter-trial coherence plots were created, and the peak inter-trial coherence value was identified for the post-stimulus interval.
While some studies identify a particular time or frequency range of interest in ITC results, such as gamma band information to glean information about cognitive function, for the purposes of this study, there was no a priori reason to confine the area of interest to a particular window. To date, ITC has not been examined in patients with ANSD, so consistent methods have not been established. While it could be argued that phase coherence around specific peaks are of the most interest, since some patients with hearing disorders have abnormal EEG morphology and/or no identifiable peaks whatsoever, the peak ITC value and the overall ITC time and frequency ranges from the larger window provide the most consistent basis for comparison across subjects (Thatcher et al., 2008, Thatcher, 2012).
For this study, several ITC measures were examined. For instance, peak ITC values were identified from the time-frequency plot as the area of strongest phase coherence. In addition, the time range (in ms) and frequency range (in Hz) for significant ITC were determined for each participant. The criteria used for the selection of this time range were as follows:
The largest area of significant ITC was identified (as measured by the number of bins with significant ITC values). If another area of significant ITC with more than 3 bins was within 20 ms of the first, it was included in the measured area.
The time range was determined by identifying the earliest and latest points (in ms) at any frequency that had significant ITC within this area. Subtracting the earliest time point from the latest time point provided the ITC time range (in ms).
The frequency range was determined by identifying the lowest and highest frequencies (in Hz) at any time point within the largest area of significant ITC. Subtracting the lowest frequency from the highest frequency provided the frequency range (in Hz).
2.4. Statistical Analysis
A 95% confidence interval was calculated for the normal hearing group, to establish a normal range for peak ITC, time range of ITC, and frequency range of ITC. Correlations between age and ITC measures were examined for significance in the NH group.
Children with ANSD were divided into subgroups based upon technology intervention type (hearing aid or cochlear implant) and cortical maturation as measured by the P1 cortical auditory evoked potential (as in Sharma et al., 2011; Cardon and Sharma, 2013): those with normal P1s, those with delayed P1s, and those with abnormal P1s. These groups were compared to each other and to the control groups (NH, SNHL-HA, and SNHL-CI) in a multivariate regression analysis to compare ITC peak values, time ranges, and frequency ranges. Three-frequency (500 Hz, 1 kHz and 2 kHz) pure tone averages (PTA) and speech results (where data were available) were examined for significant bivariate correlations with the ITC measures. As a result of the correlations found between PTA and ITC measures, children with sensorineural hearing loss and hearing aids (SNHL-HA) were also divided into subgroups based upon their audiometric PTA results: a Mild to Moderate group (with PTAs of 65 dB HL or better), and a Severe to Profound group (with PTAs worse than 65 dB HL).
For the multivariate regression analysis, groups (or subgroup, as appropriate) were treated as fixed factors, while peak ITC, the range of ITC in ms, and the range of ITC in Hz were treated as dependent variables. Type III Sums of Squares was used to account for unequal group comparisons. Levene’s test for the equality of variances was utilized to determine whether there were significant differences in the homogeneity of variances for each group. Tukey-Kramer HSD pairwise comparisons were used within the analysis to examine differences between groups, including a report of the 95% C.I. for each group. Significant pairwise group comparisons were noted (p<= 0.05).
3. RESULTS
3.1. Sample Plots of Inter-trial Coherence
In Figure 1, we show sample plots of the ITC for individual children with normal hearing (NH; first column, first row), sensorineural mild to moderate hearing loss with hearing aids (SNHL-HA-MM; first column, second row), sensorineural severe to profound hearing loss with hearing aids (SNHL-HA-SP; first column, third row), sensorineural hearing loss with cochlear implants (SNHL-CI; second column, first row), auditory neuropathy spectrum disorder with hearing aids (ANSD-HA; second column, second row), auditory neuropathy spectrum disorder with cochlear implants (ANSD-CI; second column, third row), auditory neuropathy spectrum disorder with a normal P1 CAEP (ANSD-N; third column, first row), auditory neuropathy spectrum disorder with a delayed P1 CAEP (ANSD-D; third column, second row), and auditory neuropathy spectrum disorder with an abnormal P1 CAEP (ANSD-A; third column, third row).
Figure 1.

Representative ITC plots for the following groups: (left panel) normal hearing (NH), sensorineural hearing loss with hearing aids and mild to moderate auditory thresholds (SNHL-HA-MM), sensorineural hearing loss with hearing aids and severe to profound auditory thresholds (SNHL-HA-SP), (middle panel) sensorineural hearing loss with cochlear implants (SNHL-CI), auditory neuropathy spectrum disorder with hearing aids (ANSD-HA), auditory neuropathy spectrum disorder with cochlear implants (ANSD-CI), (right panel) auditory neuropathy spectrum disorder with normal P1 CAEP responses (ANSD-N), auditory neuropathy spectrum disorder with delayed P1 CAEP responses (ANSD-D), auditory neuropathy spectrum disorder with abnormal P1 CAEP responses (ANSD-A). In each ITC plot, the x-axis represents time, while the y-axis displays frequency. ITC strength is coded by color, with red being the strongest (i.e., most statistically significant) ITC and green representing the time-frequency regions with no significant phase coherence (see color bar to the right of each plot).
In each plot, the y-axis shows the frequency range and the x-axis shows the time range over which the ITC was computed. The ITC is represented by the color scale to the right where green indicates non-significant ITC, and red represents strong, significant ITC at p<0.01. Beneath each ITC plot is the averaged ERP response for that individual (in blue), with the amplitude scale to the right of the averaged waveform (in microvolts). It should be noted that the amplitude scale for the ERP response is not the same from individual to individual (for instance 10 to −5 for the NH group, as compared to 4 to −8 for the SNHL-CI group, and 2 to −4 for the ANSD-HA group), since plotting to the same scale would make visualization difficult for the lower-amplitude waveforms.
To the left of each ITC plot is a panel with a blue line that shows the average power of ITC for that individual at each frequency, and a green and black dotted line that shows the significance threshold for ITC at each frequency relative to the baseline period (p<0.01).
3.2. Results for Children with Normal Hearing
Forty-one children, ranging from 0.1 to 11.1 years of age, were included in the normal hearing (NH) group. The average age at testing was 3.94 years of age, and the median was 2.32 years of age. Peak ITC values ranged from 0.14 to 0.48, with an average peak ITC value of 0.25 (95% CI = 0.22 – 0.28). The range of significant ITC in milliseconds ranged from 58.7 to 396.63 ms, with an average range of 235.56 (95% CI = 209.47 – 261.66). The range of significant ITC in Hz ranged from 12.02 to 46.09 Hz, with an average frequency range of 37.34 Hz (95% CI = 34.2 – 40.48 Hz). See Table 3 for detailed statistics that describe the normal hearing group results.
Table 3.
Statistical results for test age and each of the ITC measures for children in the normal hearing (NH) group.
| Statistic | Test Age | Peak ITC | Time Range of ITC (ms) | Freq Range of ITC (Hz) |
|---|---|---|---|---|
| Mean | 3.94 | 0.2508 | 235.56 | 37.34 |
| Std. Deviation | 3.46 | 0.0869 | 82.67 | 9.94 |
| Lower Bound of 95% CI | 2.85 | 0.2234 | 209.5 | 34.2 |
| Upper Bound of 95% CI | 5.04 | 0.2783 | 261.7 | 40.5 |
Test age was not significantly correlated with any ITC measure: peak ITC (r = 0.12; p = 0.44), time range for ITC (r = 0.01; p = 0.93), or frequency range of ITC (r = 0.18; p = 0.26). Therefore, it was concluded that the peak strength of ITC and the time and frequency ranges of ITC do not vary as a function of age over the age range that we selected for the current study. Figure 2 shows scatterplots for the correlations of ITC measures with test age for the NH group. The upper left panel shows the correlation between test age and peak ITC, the upper right panel shows the correlation between test age and the time range of significant ITC, and the lower left panel shows the correlation between test age and the frequency range of significant ITC.
Figure 2.
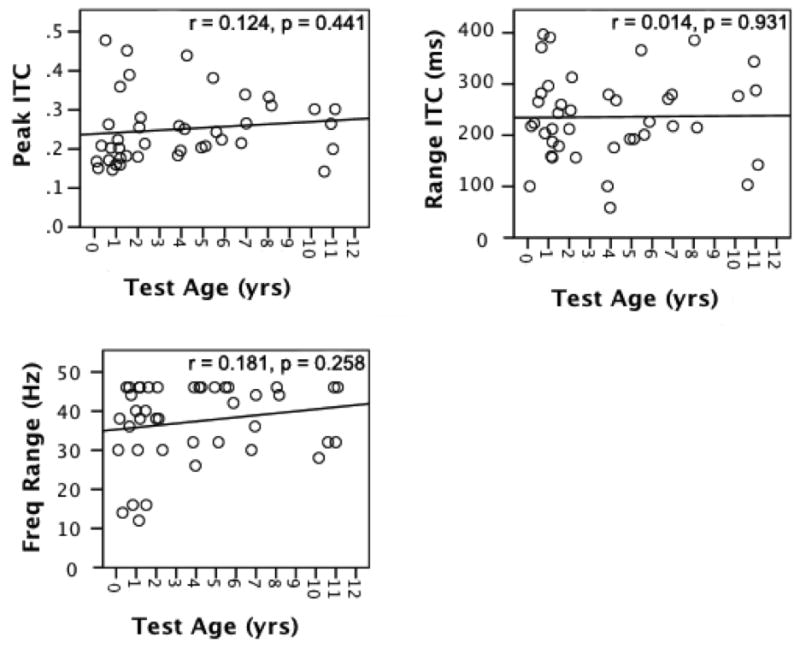
Correlations between test age (x-axis) and ITC measures (i.e., peak ITC, ITC time range, ITC frequency range; y-axis) for the normal hearing group.
3.3. ITC in Children with Sensorineural Hearing Loss
3.3.1 Children with SNHL Fitted with Hearing Aids
Results from 31 children with sensorineural hearing loss who used hearing aids were analyzed. The children ranged in age from 0.59 to 14.81 years of age (mean = 4.23, median = 2.73). For 26 of the 31 subjects, unaided thresholds were available. Subjects with SNHL were further divided into two subgroups: those with mild to moderate hearing loss (N = 14) and those with severe to profound hearing loss (N = 17). Those in the mild to moderate group included those with unaided pure tone averages (PTA) of up to and including 65 dB HL, and the severe to profound group included those with unaided PTAs of higher than 65 dB HL. One subject had only aided thresholds available, with an aided PTA of 25 dB HL (this subject was placed in the mild to moderate group). For the 4 subjects without threshold data, a severe to profound hearing loss could be inferred, since these subjects later went on to receive cochlear implants.
Unaided pure tone averages (PTA) for 26 children were significantly correlated with each ITC measure: the peak ITC (r = −0.64, p<0.01), the time range of ITC in ms (r = −0.49, p = 0.01), and the frequency range of ITC in Hz (r = −0.58, p<0.01). The correlation was negative, meaning that as hearing loss levels worsened, ITC measures tended to decrease.
In exploring further detail within these correlations, an interesting result was obtained. When the SNHL-HA Group was divided by hearing loss severity levels, it became apparent that the correlation between unaided PTA and ITC measures is driven almost entirely by the portion of the SNHL-HA group that has a severe to profound hearing loss (see Figure 3). For subjects with severe to profound hearing loss, the following significant correlations with unaided PTA were found: peak ITC (r = −0.80; p = 0.001), time range of ITC (r = −0.66; p=0.01) and frequency range of ITC (r = −0.78; p = 0.002). Correlations between unaided PTA and ITC measures were not significant for the subjects with mild to moderate hearing loss: peak ITC (r = −0.07, p = 0.81), time range of ITC (r = 0.03; p = 0.92), and frequency range of ITC (r = −0.09, p = 0.77). Overall, participants with severe to profound hearing loss show a deficit in ITC measures as compared to peers with milder hearing loss.
Figure 3.
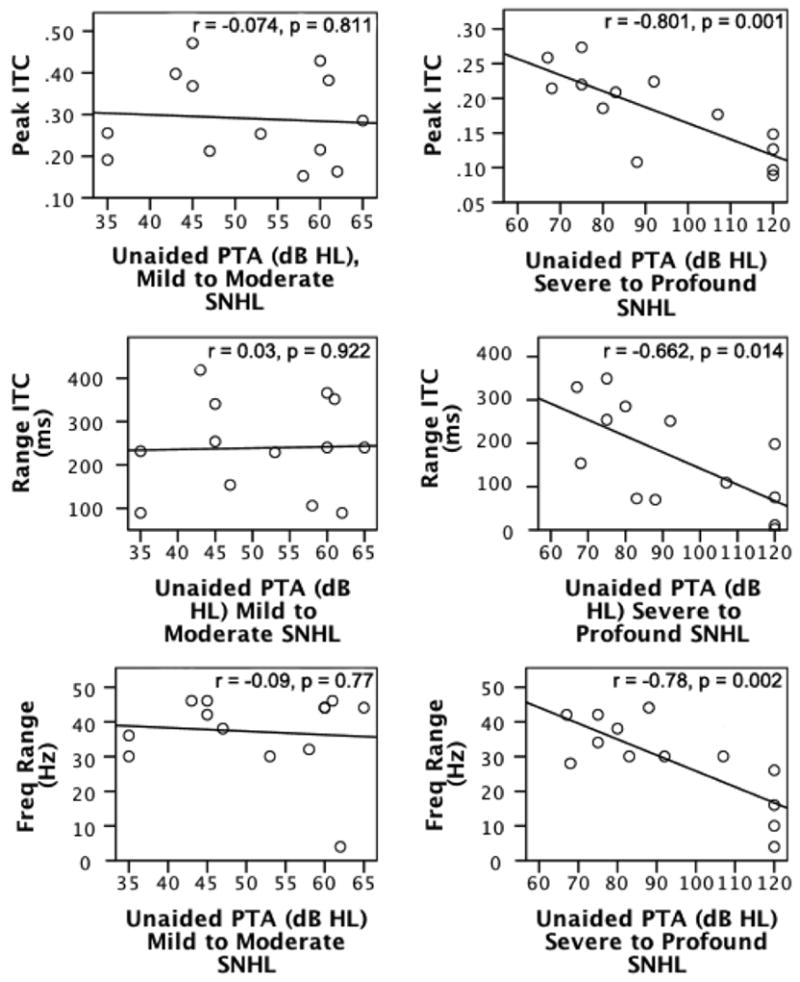
Correlations between severity of SNHL—either mild to moderate or severe to profound (x-axes)—and ITC measures (i.e., peak ITC, ITC time range, ITC frequency range; y-axes) for the group of children with sensorineural hearing loss fitted with hearing aids (SNHL-HA).
In Figure 3, the left column includes scatterplots for the participants with SNHL and a mild to moderate hearing loss (SNHL-HA-MM). The right column includes scatterplots for the participants with SNHL and a severe to profound hearing loss (SNHL-HA-SP). The top row shows correlations between peak ITC and unaided pure tone averages (PTAs) at 500, 1000, and 2000 Hz, the middle row shows correlations between the time range of significant ITC and unaided PTAs, and the bottom row shows correlations between the frequency range of significant ITC and unaided PTAs.
3.3.2 SNHL-HA Correlation of ITC with Word Recognition Scores
Word recognition scores (WRS) obtained as part of the typical audiological test battery were only available for 9 of the 31 total participants in the SNHL-HA group. The lack of complete speech score data was likely due, in part, to young ages at the time of testing (19 of those with no data were under the age of 4 years; 15 of whom were also under the age of 2.5 years), and due partially to the level of hearing loss involved (only two participants with speech scores had severe to profound hearing losses—unaided PTAs were 75 and 83 dB HL for these two subjects). The subject with the worst hearing loss had the lowest speech score with a WRS of 64%. The rest of the participants had WRS scores of 88% or greater, which limited the range of scores available to examine. There was no significant correlation found between WRS and ITC measures: peak ITC (r = 0.27; p = 0.49), time range of ITC (r = 0.45; p = 0.23) and frequency range of ITC (r = 0.53, p = 0.15), which, given the limitations of the speech data available, is unsurprising and may not be representative of the true relationship between these measures.
3.3.3 Comparison of Children with SNHL Fitted with Hearing Aids and Cochlear Implants
Given our results of decreased ITC in children with severe to profound hearing loss (detailed above), we decided to examine the effect of intervention with cochlear implants on ITC for severe to profoundly hearing impaired children. Participants with cochlear implants (N = 19) were compared to the SNHL-HA Mild to Moderate (N = 14), SNHL-HA Severe to Profound (N = 17) and Normal Hearing (N = 41) groups. Children with cochlear implants ranged from 2.23 to 15.29 years of age, with an average age of 6.82, a median age of 6.05, and had a minimum of 6 months of implant experience at the time of testing. Since the SNHL-HA group showed differences between the mild to moderate and the severe-to-profound subgroups, these subgroups were left in place for comparing each of the ITC measures (peak ITC, time range of ITC in ms, and frequency range of ITC in Hz).
A multivariate linear regression was performed with hearing loss group as a fixed factor, and peak ITC, time range of ITC in ms, and frequency range of ITC in Hz as dependent variables. Hearing loss group was found to be a significant predictor of differences for peak ITC (F = 3.23, p = 0.03), the time range of ITC in ms (F = 3.43, p = .02), and the frequency range of ITC in Hz (F = 3.71, p = 0.02). Tukey post-hoc pairwise comparisons were performed to obtain more specific information about which group differences were significant. For peak ITC, the SNHL-HA subgroup with severe to profound hearing loss (SNHL-HA-SP) was significantly different from both the normal hearing (NH) group (p<0.05) and the SNHL-HA subgroup with mild to moderate hearing loss (SNHL-HA-MM)(p<0.01). For both the time range and the frequency range of significant ITC, the SNHL-HA-SP subgroup was different from the NH group (p<0.01). These differences are illustrated in Figure 4.
Figure 4.
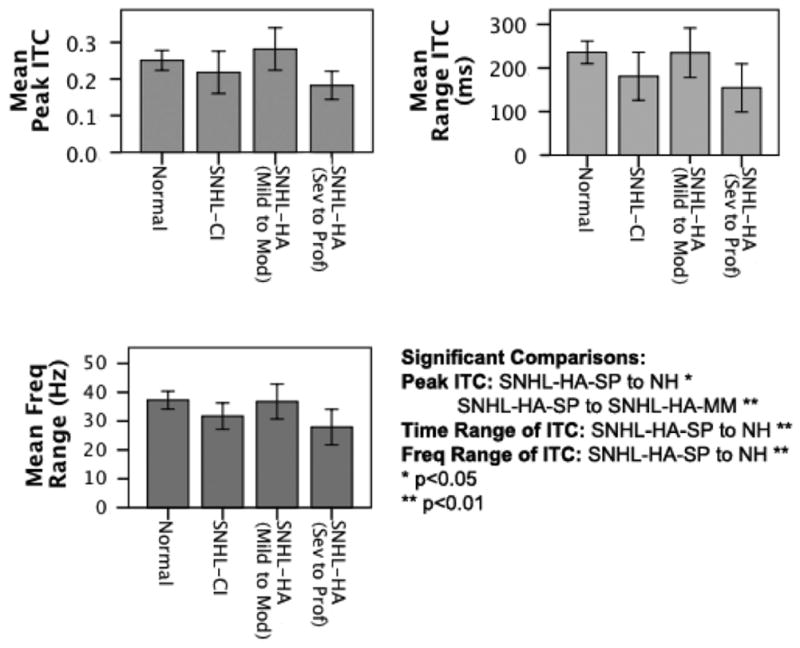
Side-by-side comparison of the following groups: normal hearing (NH), sensorineural hearing loss with cochlear implants (SNHL-CI), sensorineural hearing loss with hearing aids and mild to moderate auditory thresholds (SNHL-HA-MM), and sensorineural hearing loss with hearing aids and severe to profound auditory thresholds (SNHL-HA-SP) for each of the ITC measures (i.e., peak ITC, ITC time range, and ITC frequency range). Significant comparisons between several groups are noted.
In Figure 4, the differences in peak ITC are shown in the upper left panel, the differences in the time range of significant ITC is shown in the upper right panel, and the differences in the frequency range of significant ITC is shown in the lower left panel. Overall, as can be seen from Figure 4, although not significant, the SNHL-CI group did show a slight trend of increased ITC values relative to the SNHL-severe to profound group with hearing aids.
3.4. ITC in Children with Auditory Neuropathy Spectrum Disorder
Ninety-one children with ANSD were examined retrospectively for this study, and their data yielded ITC results that were compared to the results of children with sensorineural hearing loss. The ages at the time of testing for children with ANSD ranged from 0.21 to 11.55 years of age (mean = 3.89 years, median = 3.1 years).
Of the 91 children in the ANSD group, 50 had unaided pure tone audiometric thresholds available. A mild but significant correlation was found between unaided pure tone averages and the peak ITC measure (r = −0.34, p = 0.02). Like their peers with SNHL, as hearing loss worsens, ITC appears to decrease for children with ANSD. However, the correlation between PTA and ITC measures was weaker for children with ANSD compared to the overall SNHL-HA group.
3.4.1 Technology Intervention Comparison for the ANSD and SNHL Groups
Twenty-two children in the ANSD group were wearing cochlear implants at the time of testing (ANSD-CI), while 54 of them were wearing hearing aids (ANSD-HA). These subgroups were compared with the NH (N = 41), SNHL-HA (N = 31) and the SNHL-CI (N = 19) groups. When comparing ITC measures for intervention in a multivariate regression analysis with subgroup as a fixed factor and ITC measures as dependent variables, it was found that subgroup was a significant predictor of each ITC measure: peak ITC (F = 7.48, p<0.001), time range of significant ITC (F = 5.07, p = 0.001) and the frequency range of significant ITC (F = 7.91, p<0.001). Significant pairwise comparisons in a Tukey post-hoc analysis were as follows: for peak ITC, the NH group was significantly different from both the ANSD-HA and ANSD-CI subgroups (p<0.01), and the SNHL-HA subgroup was significantly different from the ANSD-HA subgroup (p<0.05). For the time range of significant ITC, the NH group was different from both the ANSD-HA (p<0.01) and ANSD-CI (p<0.05) subgroups. For the frequency range of significant ITC, the NH group was different from the ANSD-HA group (p<0.01), and the ANSD-HA subgroup was different from the ANSD-CI subgroup (p<0.01). Children with ANSD generally have lower coherence in ITC measures than children with SNHL (with the exception of frequency range of ITC in children who wear cochlear implants). See Figure 5 for a comparison of technology intervention by group.
Figure 5.
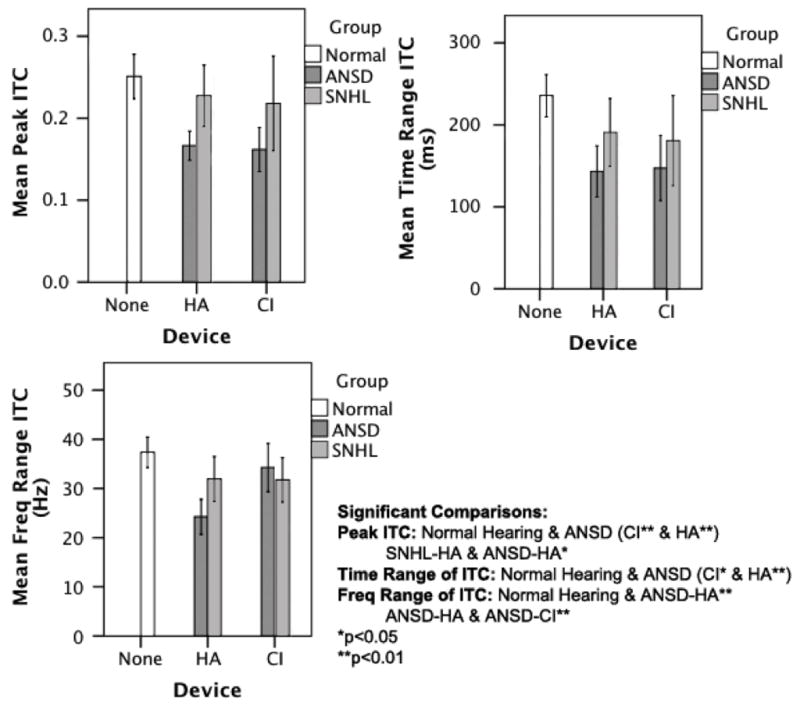
Comparison of peak ITC measures (y-axes) parsed by intervention type (i.e., none, HA, CI; x-axes) for the following groups: normal hearing (NH), auditory neuropathy spectrum disorder (ANSD), and sensorineural hearing loss (SNHL). Significant comparisons are noted.
In Figure 5, the differences between groups (ANSD, SNHL, and NH) and intervention (no intervention for the NH group, and hearing aids and cochlear implants for the ANSD and SNHL groups) are shown in three panels. The upper left panel shows differences for peak ITC, the upper right panel shows differences for the time range of significant ITC, and the lower left panel shows differences for the frequency range of significant ITC.
For children with SNHL and ANSD, the age of device fitting for HA and for CI did not correlate significantly with ITC measures, with the exception of a mild correlation of frequency range of ITC with age of fit in ANSD-HA users (r = 0.28, p = 0.04). However, experience with the device correlated strongly with peak ITC for the children with ANSD who were cochlear implant wearers (r = 0.70, p = 0.001). As experience with the implant increased, peak ITC also increased. No similar effects were found when examining experience with hearing aids for children with ANSD. Figure 6 is a scatterplot that illustrates the significant correlation between experience time with a cochlear implant and peak ITC in the ANSD-CI group. On the x-axis is experience in years, and on the y-axis is peak ITC strength.
Figure 6.
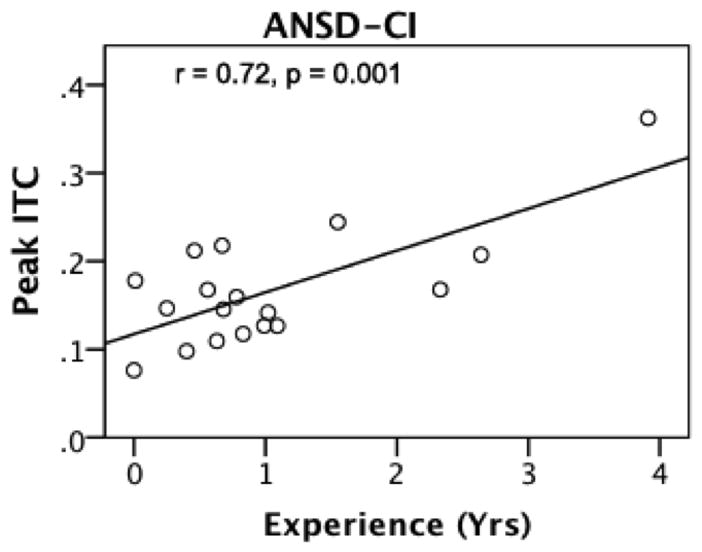
Correlation between device experience (x-axis) and peak ITC (y-axis) in the group of participants with auditory neuropathy spectrum disorder with cochlear implants (ANSD-CI).
3.4.2 Comparison of ITC in Children with ANSD with Normal, Delayed, and Abnormal P1 Results
Since previous studies have described the P1 CAEP as a good predictor of outcomes for children with ANSD (Rance et al., 2002, Sharma et al., 2011, Cardon and Sharma; 2013), we decided to examine the relationship between the averaged P1 CAEP and the ITC underlying the aggregate response. To examine the relationship between the P1 CAEP and coherence, the larger ANSD group (N = 91) was broken into categories based upon P1 latencies. Those with normal P1 latencies (latencies within normal values from Sharma et al., 2002b) were placed within the ANSD-Normal group (N = 47). Those with delayed latencies were placed in the ANSD-Delayed group (N = 31), and those with abnormal morphology (and absent P1s) were placed within the ANSD-Abnormal group (N = 13). See Sharma et al., (2011) and Cardon and Sharma (2013) for a detailed description on how the P1 latencies were computed. These three ANSD subgroups were compared with the NH group of control subjects.
When comparing the ITC values for these three subgroups with a multivariate linear regression with Tukey post-hoc pairwise comparisons, subgroup was found to be a significant predictor of all three ITC measures: peak ITC (F = 17.92, p<0.001), range of ITC in ms (F = 12.76, p<0.001), and range of ITC in Hz (F = 12.188, p<0.001). Means and significant pairwise differences are described in Figure 7. The upper left panel shows group comparisons for peak ITC, the upper right panel shows group comparisons for the time range of ITC, and the lower left panel shows group comparisons for the frequency range of ITC. ANSD-Normal is abbreviated to ANSD-N, ANSD-Delayed is abbreviated to ANSD-D, and ANSD-Abnormal is abbreviated to ANSD-A.
Figure 7.
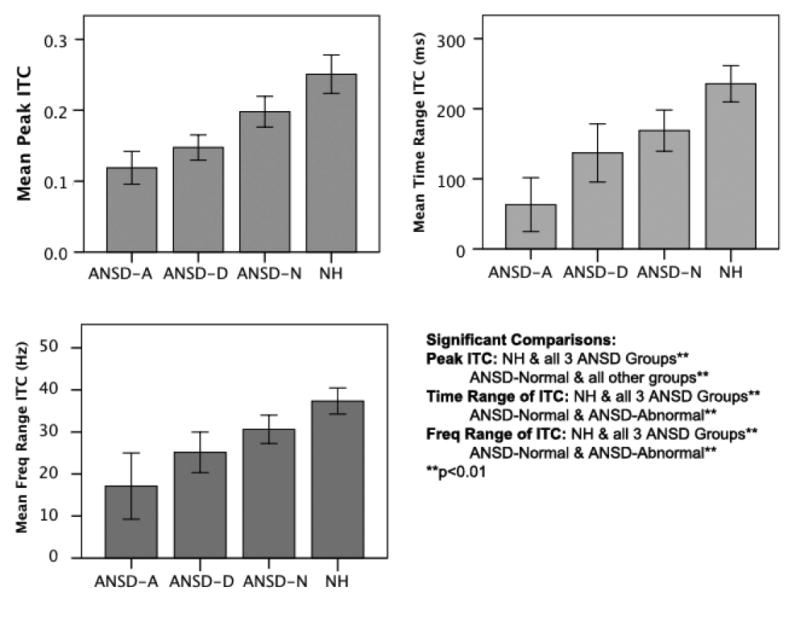
Side-by-side comparison of the following groups: auditory neuropathy spectrum disorder with abnormal P1 CAEP responses (ANSD-A), auditory neuropathy spectrum disorder with delayed P1 CAEP responses (ANSD-D), auditory neuropathy spectrum disorder with normal P1 CAEP responses (ANSD-N), and normal hearing (NH) for each of the ITC measures (i.e., peak ITC, ITC time range, and ITC frequency range). Significant comparisons are noted.
For peak ITC, the normal hearing (NH) group was significantly different from all three ANSD subgroups (ANSD-N, ANSD-D, and ANSD-A) (p<0.01), and the ANSD-N group was also significantly different from the other two ANSD subgroups (p<0.01). For the significant time and frequency ranges of ITC, the NH group was significantly different from all three ANSD subgroups (p<0.01), and the ANSD-N subgroup was significantly different from the ANSD-A subgroup (p<0.01).
4. DISCUSSION
We examined phase synchrony of cortical oscillations elicited to a speech stimulus in children with ANSD. Our measure of cortical phase synchronization was inter-trial coherence (ITC), which computes phase relations across single EEG trials. We examined the peak strength of ITC and its time and frequency ranges in children with ANSD, SNHL and NH. Our aim was to better understand the extent to which the disruption in neural synchrony, which characterizes children with ANSD, affects phase cortical synchronization, which is an important mechanism associated with auditory and speech discrimination, feature binding, and other cognitive processes.
Our main findings can be summarized as follows: (i) for NH children, ITC measures did not correlate with age; (ii) for children with SNHL, ITC decreased significantly as hearing impairment increased, especially within the severe to profound hearing loss range; (iii) children with ANSD showed lower ITC values as compared to their peers with SNHL and similar technology interventions (i.e., hearing aids or cochlear implants); (iv) NH children—with normal P1 CAEP responses—had higher ITC values than children with ANSD who had either normal, delayed or abnormal P1 CAEP responses; and (v) children with ANSD who showed normal P1 CAEP responses had higher ITC values than those with delayed or abnormal CAEP responses.
ITC changes at the Cz electrode were examined in NH children who ranged in age from infancy to pre-adolescence (0.1–11 years). There were no significant ITC correlations with age across this range. A recent study by Bishop et al., (2011), examined ITC as part of a study of CAEP responses elicited by tones in children aged 7–11 years, and reported age-related changes in ITC at the Cz electrode and a few other fronto-central sites. The difference in results between our paper and the Bishop study may be explained by a methodological difference in ITC strength quantification (power at specific frequency bands versus peak strength and time and frequency ranges), or the smaller age range studied in the Bishop et al., study.
Overall, our results showed that children with SNHL showed a significant decline in ITC values as a function of the degree of hearing loss (Figures 3 and 4). Children with mild-to-moderate hearing loss showed normal ITC values; however, cortical phase coherence appeared to decline significantly as sensorineural hearing loss worsened in the severe-to-profound hearing range. Previous studies of cortical auditory evoked potentials have shown that lack of audibility experienced by children with SNHL results in significant deficits and delays in auditory cortical maturation (Sharma et a., 2005), likely including deficits in cortical phase synchronization. In our study, children with mild to moderate hearing loss who were fitted with hearing aids showed normal ITC, suggesting that appropriate amplification restores normal phase-locking of cortical oscillations to speech sounds. This is an encouraging result since recent studies have described the importance of cortical oscillations for auditory processing (Giraud and Poeppel, 2012).
Contrary to children with mild to moderate SNHL, children with severe to profound SNHL showed lower than normal values of ITC and decreasing ITC values as a function of the severity of their hearing loss (Figure 4). Children with even a severe degree of SNHL typically show reasonably good brainstem synchrony (as evidenced by repeatable ABR and Auditory Steady State Recordings (ASSR) recordings at suprathreshold levels), which is likely to carry over to cortical levels. Therefore, the deficit in cortical phase coherence may be explained in large part due to the relatively decreased audibility that accompanies severe to profound hearing loss even after intervention with amplification.
However, it is curious that children with severe to profound SNHL who were fitted with cochlear implants did not show a significant improvement in ITC (Figure 5) and their ITC levels did not reach those of children with mild-moderate SNHL or NH (although there was a trend for improvement in ITC levels for SNHL-CI children compared with SNHL-HA children). Cochlear implants in general allow for sufficient audibility of the speech signal. Thus, it may be the case that cortical deficits in phase synchrony associated with severe to profound SNHL may never quite be ameliorated to the levels of a mild hearing loss, even after intervention with a cochlear implant. This might be particularly relevant if implantation occurs after a sensitive period of 3.5 years in childhood (Kral and Sharma, 2012). In this study, the mean and median ages of implant fitting for children with cochlear implants in our sample were 5.19 and 4.6 years, respectively. The fact that both of the above ages are well after the sensitive period, suggests that late implantation does not restore cortical phase coherence consistent with the abnormal cortical maturation and re-organization reported in late-implanted children (Sharma et al., 2009). Future studies should examine ITC before and after cochlear implantation, as a function of age of implantation, to directly examine the possible effects of electrical stimulation on cortical synchronization.
Overall, children with ANSD showed a trend for lower levels of ITC compared to children with SNHL (Figure 5), and children with SNHL showed a different relationship between ITC and hearing thresholds, as compared with children with ANSD. Relative to children with SNHL (r = −0.64, p<0.01), children with ANSD showed a much weaker correlation between peak ITC and hearing thresholds (r = −0.34). In addition, separating the children with SNHL into subgroups based upon hearing loss strengthened the correlation between PTA and ITC measures for those with severe to profound hearing loss in particular, with correlation values as strong as r = −0.8, however, the correlation of PTA with ITC measures disappeared when trying a similar method with the ANSD group. These results suggest that although the lack of audibility impacts ITC in ANSD, the decreased phase coherence in ANSD cannot simply be explained as a function of degree of hearing loss. These results are in keeping with reports that audiometric thresholds are not as predictive of performance in ANSD as they are in SNHL (Deltenre et al., 1999, Rance et al., 1999, Rance et al., 2002, Rapin and Gravel, 2003, Rance and Aud, 2005, Rance et al., 2007, Sharma et al., 2011)
Cortical development is driven by both intrinsic factors, such as genetic expression, and extrinsic factors, such as sensory input (Pallas, 2001). Reductions in spontaneous neural activity result at least in part from neural inhibition, and sensory experience is strongly connected to inhibition in the cortex (Foeller and Feldman, 2004). An abnormal reduction of neural fibers has been suggested as a possible mechanism of the loss of synchrony in ANSD (Butinar et al., 1999, Amatuzzi et al., 2001, Starr, 2001). In children with ANSD, the degradation of the signal through demyelination or a loss of axonal fibers creates lower levels of EEG coherence regardless of the level of hearing loss (essentially, an intrinsic deficit). On the other hand, for children with SNHL, coherence remains intact except when audibility is significantly decreased in severe to profound hearing loss (essentially, an extrinsic deficit). Our results provide a window into cortical deficits for children with ANSD that go well beyond the effects of the loss of audibility on cortical development and functioning.
Cortical auditory evoked potentials like the P1 CAEP response have been used widely to examine cortical development in children with NH, SNHL and ANSD. Synchronization of neural oscillations is important for the maturation of cortical networks (Uhlhaas et al., 2010). ITC measures provide information beyond the averaged P1 CAEP by giving information regarding the phase synchrony and frequency content of the EEG. Our results showed that, in general, ITC measures corresponded well with P1 CAEP results (Figure 7). Children with ANSD with abnormal P1 results also had the lowest levels of ITC, and children with normal P1 results had the highest levels of ITC. However, the ITC measure provided information about cortical functioning that went beyond the information that P1 latency provides alone, since children with ANSD and normal CAEPs had significantly lower ITC levels than children with normal hearing. Although potential contributors to the dys-synchrony in ANSD include neural pathologies such as axonal loss and demyelination (Butinar et al., 1999, Starr, 2001), it is possible that less populous or less efficient neuronal clusters are still capable of producing a normal P1 latency. However, a more detailed look at the phase synchrony behind the averaged response tells us that cortical functioning in children with ANSD is not identical to normal hearing children, even if cortical maturation measures like the P1 CAEP latency are normal. This might be especially true if the underlying pathology is related to axonal loss, rather than demyelination, the latter of which might be expected to produce delayed or temporally smeared responses (which would be consistent with Rance, 2012). An important direction for future research is to answer the question as to whether normal cortical maturation is sufficient for good performance outcomes in this population, or whether a particular level of phase synchrony is also required.
In investigating the effects of intervention technology on ITC measures in children with ANSD, it was found that ITC was positively correlated with duration of cochlear implant use, but not hearing aid use (Figure 6). Although ITC remained lower post-implantation for children with ANSD compared to children with SNHL, the increase in coherence with increasing implant use supports the idea that cochlear implants hold promise for children with ANSD as a method of reintroducing synchrony to a dys-synchronous system (e.g., Shallop et al., 2001). Middlebrooks (2008) has described how cortical neurons in implanted guinea pigs are capable of phase-locking to amplitude-modulated electrical pulse trains that are produced by a cochlear implant, a process considered important for speech recognition in humans. Reports vary as to the specific envelope frequencies that are useful for speech processing in the cortex for people with normal hearing and those with cochlear implants (Van Tasell et al., 1987, Rosen, 1992, Drullman et al., 1994, Shannon et al., 1995, Fu and Shannon, 2000, Xu et al., 2005, Xu and Zheng, 2007), and the upper value of that frequency range has been stated to be as high as 50 Hz (Rosen, 1992). In the current study, additional phase locking in the gamma range was observed for children with ANSD who received cochlear implants (Figure 5, lower left panel). These changes are encouraging, as restoration of high frequency phase locking may be of assistance in processing speech information. In the present study, it was possible to follow children only for a short time post-implantation (mean experience with the implant was 1.34 years, median 1.02 years). It would be useful for future studies to track changes in ITC as a function of implant use over a much longer time scale.
Cortical phase synchrony is modulated by cognitive demands. Using a visual line-orientation judgment task, Yamagishi et al., (2008) showed that increased ITC was associated with improved behavioral performance. In clinical populations, abnormal phase synchrony has been associated with various higher-order cognitive neurological deficits including auditory hallucinations in schizophrenic patients (Ford et al., 2007), ictal activity in epileptic patients (Le Van Quyen et al., 2003), motor initiation, slowness and tremor in Parkinson’s disease (Uhlhaas et al., 2006) and working memory deficits in patients with Alzheimer’s disease (Pijnenburg et al., 2004). While our paradigm did not specifically examine cognitive processing, the generally low levels of ITC seen in children with ANSD in our passive task may be a precursor to cognitive deficits seen in language development for these children (Rance et al., 2007). Future studies should examine ITC changes in ANSD in a cognitive behavioral task.
This study was limited by the retrospective nature of the data analysis. Speech recognition data were limited for this study, and it would be useful to obtain additional information in this area to compare behavioral speech performance with ITC measures. Finally, while ITC was examined across time and frequency ranges, the mean change of spectral power within specific frequency bands (e.g., event related spectral perturbations) was not examined. It would be useful for future studies to describe possible differences in spectral perturbations in this population.
5. Summary and Conclusions
We examined cortical phase synchrony to speech, using inter-trial coherence in children with SNHL and ANSD relative to NH children. Children with ANSD had decreased phase synchrony in comparison to the normal hearing population, and ITC was sufficient to distinguish normal hearing children from those with ANSD, even if cortical maturation (as evidenced by P1 latencies) was normal in both groups. These findings provide evidence that ITC provides information that is not readily available from analysis of the P1 CAEP latency alone. The current study also shows that lack of audibility in severe to profound SNHL results in decreased cortical coherence relative to children with milder degrees of SNHL, consistent with generally better behavioral outcomes reported for the latter group. Children with ANSD showed generally lower phase coherence compared with children with SNHL, regardless of intervention. However, there was evidence that cochlear implantation resulted in an increase in phase synchrony with increasing experience for children with ANSD. Overall, this study shows that inter-trial coherence provides a window into examining cortical phase synchrony deficits for children with ANSD. Differences in cortical phase coherence between children with SNHL and their peers with ANSD highlighted the role of cortical synchrony needed for the appropriate processing of speech for children with ANSD.
Highlights.
Cortical phase synchrony, as measured by inter-trial coherence (ITC), decreases as sensorineural hearing loss (SNHL) increases.
Auditory neuropathy spectrum disorder (ANSD) is associated with lower levels of cortical phase synchrony relative to normal hearing and SNHL.
Cortical phase synchrony increases after cochlear implantation in children with ANSD as a function of experience with the device.
Acknowledgments
The authors would like to thank Drs. Phillip Gilley and Garrett Cardon for their input on the study. We would like to thank Kathryn Henion for her assistance in some of the data collection. This project was supported by NIH R01DC0625 to author A.S.
Footnotes
Publisher's Disclaimer: This is a PDF file of an unedited manuscript that has been accepted for publication. As a service to our customers we are providing this early version of the manuscript. The manuscript will undergo copyediting, typesetting, and review of the resulting proof before it is published in its final citable form. Please note that during the production process errors may be discovered which could affect the content, and all legal disclaimers that apply to the journal pertain.
References
- Alvarenga KF, Amorim RB, Agostinho-Pesse RS, Costa OA, Nascimento LT, Bevilacqua MC. Speech perception and cortical auditory evoked potentials in cochlear implant users with auditory neuropathy spectrum disorders. Int J Pediatr Otorhinolaryngol. 2012;76:1332–8. doi: 10.1016/j.ijporl.2012.06.001. [DOI] [PubMed] [Google Scholar]
- Amatuzzi MG, Northrop C, Liberman MC, Thornton A, Halpin C, Herrmann B, et al. Selective inner hair cell loss in premature infants and cochlea pathological patterns from neonatal intensive care unit autopsies. Arch Otolaryngol Head Neck Surg. 2001;127:629–36. doi: 10.1001/archotol.127.6.629. [DOI] [PubMed] [Google Scholar]
- Berlin CI, Bordelon J, St John P, Wilensky D, Hurley A, Kluka E, et al. Reversing click polarity may uncover auditory neuropathy in infants. Ear Hear. 1998;19:37–47. doi: 10.1097/00003446-199802000-00002. [DOI] [PubMed] [Google Scholar]
- Berlin CI, Hood LJ, Morlet T, Wilensky D, Li L, Mattingly KR, Taylor-Jeanfreau J, et al. Multi-site diagnosis and management of 260 patients with auditory neuropathy/dys-synchrony (auditory neuropathy spectrum disorder) Int J Audiol. 2010;49:30–43. doi: 10.3109/14992020903160892. [DOI] [PubMed] [Google Scholar]
- Berlin CI, Morlet T, Hood LJ. Auditory neuropathy/dyssynchrony: its diagnosis and management. Pediatr Clin North Am. 2003;50:331–40. doi: 10.1016/s0031-3955(03)00031-2. [DOI] [PubMed] [Google Scholar]
- Bishop DV, Anderson M, Reid C, Fox AM. Auditory development between 7 and 11 years: an event-related potential (ERP) study. PLoS One. 2011;6:e18993. doi: 10.1371/journal.pone.0018993. [DOI] [PMC free article] [PubMed] [Google Scholar]
- Butinar D, Zidar J, Leonardis L, Popovic M, Kalaydjieva L, Angelicheva D, et al. Hereditary auditory, vestibular, motor, and sensory neuropathy in a Slovenian Roma (Gypsy) kindred. Ann Neurol. 1999;46:36–44. doi: 10.1002/1531-8249(199907)46:1<36::aid-ana7>3.0.co;2-j. [DOI] [PubMed] [Google Scholar]
- Campbell J, Cardon G, Sharma A. Clinical application of the cortical auditory evoked potential P1 biomarker in children with sensorineural hearing loss and auditory neuropathy spectrum disorder. Sem Hear. 2011;32:147–155. doi: 10.1055/s-0031-1277236. [DOI] [PMC free article] [PubMed] [Google Scholar]
- Cardon G, Campbell J, Sharma A. Plasticity in the developing auditory cortex: evidence from children with sensorineural hearing loss and auditory neuropathy spectrum disorder. J Am Acad Audiol. 2012;23:396–411. doi: 10.3766/jaaa.23.6.3. [DOI] [PMC free article] [PubMed] [Google Scholar]
- Cardon G, Sharma A. Central auditory maturation and behavioral outcome in children with auditory neuropathy spectrum disorder who use cochlear implants. Int J Audiol. 2013;52:577–586. doi: 10.3109/14992027.2013.799786. [DOI] [PMC free article] [PubMed] [Google Scholar]
- Cone-Wesson B. Auditory neuropathy - Evaluation and habilitation of a hearing disability. Infants Young Child. 2004;17:69–81. [Google Scholar]
- Deltenre E, Mansbach AL, Bozet C, Christiaens F, Barthelemy P, Paulissen D, et al. Auditory neuropathy with preserved cochlear microphonics and secondary loss of otoacoustic emissions. Audiology. 1999;38:187–195. doi: 10.3109/00206099909073022. [DOI] [PubMed] [Google Scholar]
- Doyle KJ, Sininger Y, Starr A. Auditory neuropathy in childhood. Laryngoscope. 1998;108:1374–7. doi: 10.1097/00005537-199809000-00022. [DOI] [PubMed] [Google Scholar]
- Drullman R, Festen JM, Plomp R. Effect of temporal envelope smearing on speech reception. J Acoust Soc Am. 1994;95:1053–64. doi: 10.1121/1.408467. [DOI] [PubMed] [Google Scholar]
- Foeller E, Feldman DE. Synaptic basis for developmental plasticity in somatosensory cortex. Curr Opin Neurobiol. 2004;14:89–95. doi: 10.1016/j.conb.2004.01.011. [DOI] [PubMed] [Google Scholar]
- Ford JM, Krystal JH, Mathalon DH. Neural Synchrony in Schizophrenia: From Networks to New Treatments. Schizophr Bull. 2007;33:848–852. doi: 10.1093/schbul/sbm062. [DOI] [PMC free article] [PubMed] [Google Scholar]
- Fu QJ, Shannon RV. Effect of stimulation rate on phoneme recognition by nucleus-22 cochlear implant listeners. J Acoust Soc Am. 2000;107:589–97. doi: 10.1121/1.428325. [DOI] [PubMed] [Google Scholar]
- Gilley PM, Sharma A, Dorman M, Finley CC, Panch AS, Martin K. Minimization of cochlear implant stimulus artifact in cortical auditory evoked potentials. Clin Neurophysiol. 2006;117:1772–1782. doi: 10.1016/j.clinph.2006.04.018. [DOI] [PubMed] [Google Scholar]
- Giraud AL, Poeppel D. Cortical oscillations and speech processing: emerging computational principles and operations. Nat Neurosci. 2012;15:511–517. doi: 10.1038/nn.3063. [DOI] [PMC free article] [PubMed] [Google Scholar]
- Howard MF, Poeppel D. Discrimination of Speech Stimuli Based on Neuronal Response Phase Patterns Depends on Acoustics But Not Comprehension. J Neurophysiol. 2010;104:2500–2511. doi: 10.1152/jn.00251.2010. [DOI] [PMC free article] [PubMed] [Google Scholar]
- Ko D, Kwon S, Lee G-T, Im CH, Kim KH, Jung KY. Theta oscillation related to the auditory discrimination process in mismatch negativity: oddball versus control paradigm. J Clin Neurol (Seoul, Korea) 2012;8:35–42. doi: 10.3988/jcn.2012.8.1.35. [DOI] [PMC free article] [PubMed] [Google Scholar]
- Kral A, Sharma A. Developmental neuroplasticity after cochlear implantation. Trends Neurosci. 2012;35:111–22. doi: 10.1016/j.tins.2011.09.004. [DOI] [PMC free article] [PubMed] [Google Scholar]
- Kraus N, Bradlow AR, Cheatham MA, Cunningham J, King CD, Koch DB, et al. Consequences of neural asynchrony: A case of auditory neuropathy. J Assoc Res Otolaryngol. 2000;1:33–45. doi: 10.1007/s101620010004. [DOI] [PMC free article] [PubMed] [Google Scholar]
- Le Van Quyen M, Navarro V, Martinerie J, Baulac M, Varela FJ. Toward a neurodynamical understanding of ictogenesis. Epilepsia. 2003;44 (Suppl 12):30–43. doi: 10.1111/j.0013-9580.2003.12007.x. [DOI] [PubMed] [Google Scholar]
- Luo H, Poeppel D. Phase patterns of neuronal responses reliably discriminate speech in human auditory cortex. Neuron. 2007;54:1001–1010. doi: 10.1016/j.neuron.2007.06.004. [DOI] [PMC free article] [PubMed] [Google Scholar]
- Makeig S, Debener S, Onton J, Delorme A. Mining event-related brain dynamics. Trends Cogn Sci. 2004;8:204–10. doi: 10.1016/j.tics.2004.03.008. [DOI] [PubMed] [Google Scholar]
- Michalewski HJ, Prasher DK, Starr A. Latency variability and temporal interrelationships of the auditory event-related potentials (N1, P2, N2, and P3) in normal subjects. Electroencephalogr Clin Neurophysiol. 1986;65:59–71. doi: 10.1016/0168-5597(86)90037-7. [DOI] [PubMed] [Google Scholar]
- Middlebrooks JC. Auditory cortex phase locking to amplitude-modulated cochlear implant pulse trains. J Neurophysiol. 2008;100:76–91. doi: 10.1152/jn.01109.2007. [DOI] [PMC free article] [PubMed] [Google Scholar]
- Müller V, Gruber W, Klimesch W, Lindenberger U. Lifespan differences in cortical dynamics of auditory perception. Dev Sci. 2009;12:839–853. doi: 10.1111/j.1467-7687.2009.00834.x. [DOI] [PubMed] [Google Scholar]
- Pallas SL. Intrinsic and extrinsic factors that shape neocortical specification. Trends Neurosci. 2001;24:417–23. doi: 10.1016/s0166-2236(00)01853-1. [DOI] [PubMed] [Google Scholar]
- Palva JM, Palva S, Kaila K. Phase synchrony among neuronal oscillations in the human cortex. J Neurosci. 2005;25:3962–72. doi: 10.1523/JNEUROSCI.4250-04.2005. [DOI] [PMC free article] [PubMed] [Google Scholar]
- Pijnenburg YAL, Vander Made Y, Van Cappellen van Walsum AM, Knol DL, Scheltens P, Stam CJ. EEG synchronization likelihood in mild cognitive impairment and Alzheimer’s disease during a working memory task. Clin Neurophysiol. 2004;115:1332–1339. doi: 10.1016/j.clinph.2003.12.029. [DOI] [PubMed] [Google Scholar]
- Rance G, Aud D. Auditory neuropathy/dys-synchrony and its perceptual consequences. Trends Amplif. 2005;9:1–43. doi: 10.1177/108471380500900102. [DOI] [PMC free article] [PubMed] [Google Scholar]
- Rance G, Barker EJ, Sarant JZ, Ching TYC. Receptive language and speech production in children with auditory neuropathy/dyssynchrony type hearing loss. Ear Hear. 2007;28:694–702. doi: 10.1097/AUD.0b013e31812f71de. [DOI] [PubMed] [Google Scholar]
- Rance G, Beer DE, Cone-Wesson B, Shepherd RK, Dowell RC, King AM, et al. Clinical findings for a group of infants and young children with auditory neuropathy. Ear Hear. 1999;20:238–252. doi: 10.1097/00003446-199906000-00006. [DOI] [PubMed] [Google Scholar]
- Rance G, Cone-Wesson B, Wunderlich J, Dowell R. Speech perception and cortical event related potentials in children with auditory neuropathy. Ear Hear. 2002;23:239–253. doi: 10.1097/00003446-200206000-00008. [DOI] [PubMed] [Google Scholar]
- Rance G, Ryan MM, Carew P, Corben LA, Yiu E, Tan J, et al. Binaural speech processing in individuals with auditory neuropathy. Neuroscience. 2012;226:227–35. doi: 10.1016/j.neuroscience.2012.08.054. [DOI] [PubMed] [Google Scholar]
- Rapin I, Gravel J. “Auditory neuropathy”: physiologic and pathologic evidence calls for more diagnostic specificity. Int J Pediatr Otorhinolaryngol. 2003;67:707–728. doi: 10.1016/s0165-5876(03)00103-4. [DOI] [PubMed] [Google Scholar]
- Rosen S. Temporal information in speech: acoustic, auditory and linguistic aspects. Philos Trans R Soc Lond B Biol Sci. 1992;336:367–73. doi: 10.1098/rstb.1992.0070. [DOI] [PubMed] [Google Scholar]
- Roush P, Frymark T, Venediktov R, Wang B. Audiologic management of auditory neuropathy spectrum disorder in children: a systematic review of the literature. Amer J Audiol. 2011;20:159–170. doi: 10.1044/1059-0889(2011/10-0032). [DOI] [PubMed] [Google Scholar]
- Shannon RV, Zeng FG, Kamath V, Wygonski J, Ekelid M. Speech recognition with primarily temporal cues. Science. 1995;270:303–4. doi: 10.1126/science.270.5234.303. [DOI] [PubMed] [Google Scholar]
- Sharma A, Cardon G, Henion K, Roland P. Cortical maturation and behavioral outcomes in children with auditory neuropathy spectrum disorder. Int J Audiol. 2011;50:98–106. doi: 10.3109/14992027.2010.542492. [DOI] [PMC free article] [PubMed] [Google Scholar]
- Sharma A, Dorman MF, Spahr AJ. Rapid development of cortical auditory evoked potentials after early cochlear implantation. Neuroreport. 2002a;13:1365–8. doi: 10.1097/00001756-200207190-00030. [DOI] [PubMed] [Google Scholar]
- Sharma A, Dorman MF, Spahr AJ. A sensitive period for the development of the central auditory system in children with cochlear implants: implications for age of implantation. Ear Hear. 2002b;23:532–9. doi: 10.1097/00003446-200212000-00004. [DOI] [PubMed] [Google Scholar]
- Sharma A, Kraus N, Mcgee TJ, Nicol TG. Developmental changes in P1 and N1 central auditory responses elicited by consonant-vowel syllables. Electroencephalogr Clin Neurophysiol. 1997;104:540–5. doi: 10.1016/s0168-5597(97)00050-6. [DOI] [PubMed] [Google Scholar]
- Shallop J, Peterson A, Facer G, Fabry L, Driscoll C. Cochlear implants in five cases of auditory neuropathy: postoperative findings and progress. The Laryngoscope. 2001;111:555–562. doi: 10.1097/00005537-200104000-00001. [DOI] [PubMed] [Google Scholar]
- Sininger Y, Oba S. Patients with auditory neuropathy: Who are they and what can they hear? In: Sininger Y, Starr A, editors. Auditory neuropathy: A new perspective on hearing disorders. San Diego: Singular Thompson Learning; 2001. [Google Scholar]
- Starr A, Mcpherson D, Patterson J, Don M, Luxford W, Shannon R, et al. Absence of both auditory evoked potentials and auditory percepts dependent on timing cues. Brain. 1991;114:1157–80. doi: 10.1093/brain/114.3.1157. [DOI] [PubMed] [Google Scholar]
- Starr A, Picton TW, Sininger Y, Hood LJ, Berlin CI. Auditory neuropathy. Brain. 1996;119:741–753. doi: 10.1093/brain/119.3.741. [DOI] [PubMed] [Google Scholar]
- Starr A, Picton TW, Kim R. Pathophysiology of auditory neuropathy. In: Sininger Y, Starr A, editors. Auditory neuropathy: A new perspective on hearing disorders. San Diego, CA: Singular; 2001. [Google Scholar]
- Swanepoel DW, Johl L, Pienar D. Childhood hearing loss and risk profile in a South Africal population. Int J Pediatr Otorhinolaryngol. 2013;77:394–398. doi: 10.1016/j.ijporl.2012.11.034. [DOI] [PubMed] [Google Scholar]
- Tass P, Rosenblum MG, Weule J, Kurths J, Pikovsky A, Volkmann J, et al. Detection of n: m phase locking from noisy data: Application to magnetoencephalography. Phys Rev Lett. 1998;81:3291–3294. [Google Scholar]
- Thatcher RW. Coherence, phase differences, phase shift, and phase lock in EEG/ERP analyses. Dev Neuropsychol. 2012;37:476–96. doi: 10.1080/87565641.2011.619241. [DOI] [PubMed] [Google Scholar]
- Thatcher RW, North DM, Biver CJ. Intelligence and EEG phase reset: a two compartmental model of phase shift and lock. Neuroimage. 2008;42:1639–53. doi: 10.1016/j.neuroimage.2008.06.009. [DOI] [PubMed] [Google Scholar]
- Uhlhaas PJ, Singer W. Neural synchrony in brain disorders: relevance for cognitive dysfunctions and pathophysiology. Neuron. 2006;52:155–168. doi: 10.1016/j.neuron.2006.09.020. [DOI] [PubMed] [Google Scholar]
- Uhlhaas PJ, Singer W. Abnormal neural oscillations and synchrony in schizophrenia. Nat Rev Neurosci. 2010;11:100–113. doi: 10.1038/nrn2774. [DOI] [PubMed] [Google Scholar]
- Uus K, Bamford J. Effectiveness of population-based newborn hearing screeneing in England: ages of interventions and profile of cases. Pediatrics. 2006;117:e887–e893. doi: 10.1542/peds.2005-1064. [DOI] [PubMed] [Google Scholar]
- Van Tasell DJ, Soli SD, Kirby VM, Widin GP. Speech waveform envelope cues for consonant recognition. J Acoust Soc Am. 1987;82:1152–61. doi: 10.1121/1.395251. [DOI] [PubMed] [Google Scholar]
- Wolfe J, Clark JL. Intervention for a child with Auditory Neuropathy/Dys-synchrony. The ASHA Leader. 2008 Jul 15; [Google Scholar]
- Xu L, Thompson CS, Pfingst BE. Relative contributions of spectral and temporal cues for phoneme recognition. J Acoust Soc Am. 2005;117:3255–67. doi: 10.1121/1.1886405. [DOI] [PMC free article] [PubMed] [Google Scholar]
- Xu L, Zheng Y. Spectral and temporal cues for phoneme recognition in noise. J Acoust Soc Am. 2007;122:1758. doi: 10.1121/1.2767000. [DOI] [PubMed] [Google Scholar]
- Zeng FG, Liu S. Speech perception in individuals with auditory neuropathy. J Speech Lang Hear Res. 2006;49:367–80. doi: 10.1044/1092-4388(2006/029). [DOI] [PubMed] [Google Scholar]