Abstract
Estrogens control many aspects of pituitary gland biology, including regulation of lactotroph homeostasis and synthesis and secretion of prolactin. In rat models, these actions are strain specific and heritable, and multiple quantitative trait loci (QTL) have been mapped that impact the responsiveness of the lactotroph to estrogens. One such QTL, Ept7, was mapped to RNO7 in female progeny generated in an intercross between BN rats, in which the lactotroph population is insensitive to estrogens, and ACI rats, which develop lactotroph hyperplasia/adenoma and associated hyperprolactinemia in response to estrogen treatment. The primary objective of this study was to confirm the existence of Ept7 and to quantify the impact of this QTL on responsiveness of the pituitary gland of female and male rats to 17β-estradiol (E2) and diethylstilbestrol (DES), respectively. Secondary objectives were to determine if Ept7 influences the responsiveness of the male reproductive tract to DES and to identify other discernible phenotypes influenced by Ept7. To achieve these objectives, a congenic rat strain that harbors BN alleles across the Ept7 interval on the genetic background of the ACI strain was generated and characterized to define the effect of administered estrogens on the anterior pituitary gland and male reproductive tissues. Data presented herein indicate Ept7 exerts a marked effect on development of lactotroph hyperplasia in response to estrogen treatment, but does not affect atrophy of the male reproductive tissues in response to hormone treatment. Ept7 was also observed to exert gender specific effects on body weight in young adult rats.
Introduction
Estrogens act through their cognate receptors to regulate gene expression, cell proliferation and/or cell survival in multiple tissues. One well studied estrogen responsive cell type is the prolactin (PRL)-producing lactotroph of the anterior pituitary gland. Estrogens enhance transcription of the PRL gene, stimulate lactotroph proliferation and prolong lactotroph survival, and thereby regulate lactotroph homeostasis and the level of circulating PRL (Sarkar et al. 1998; Sarkar 2006; Schlechte 2007; Spady et al. 1999a). Because of these actions on the lactotroph, estrogens are suspected to contribute to development of prolactinoma, which constitute the most common type of pituitary tumor in humans (Schlechte 2007). In rat models, the actions of estrogens on the lactotroph are strain specific and heritable (Shull et al. 2007; Spady et al. 1999c; Strecker et al. 2005; Wiklund et al. 1981a, b; Wiklund and Gorski 1982). Multiple quantitative trait loci (QTL) have been mapped that impact the responsiveness of the pituitary lactotroph to estrogens (Kurz et al. 2008; Shull et al. 2007; Strecker et al. 2005; Wendell and Gorski 1997). One such QTL, Ept7, was mapped to RNO7 in female progeny generated in an intercross between BN rats, in which the lactotroph population is relatively insensitive to estrogens, and ACI rats, which exhibit a dramatic increase in the size of the anterior pituitary gland resulting from development of lactotroph hyperplasia/adenoma in response to estrogen treatment (Shull et al. 2007).
QTL that influence other estrogen regulated phenotypes have been mapped to the same region of RNO7 as Ept7. Emca4, a QTL that influences susceptibility to estrogen-induced mammary cancer was mapped to RNO7 in a BNxACI intercross (Schaffer et al. 2006). Teswt1, a QTL that influences the weight of the testes in male rats treated with the synthetic estrogen diethylstilbestrol (DES) was mapped to RNO7 using a panel of 30 recombinant inbred strains generated by crossing Lewis and Fischer 344 rats (Tachibana et al. 2006). The genetic variant(s) underlying these QTL and the mechanism(s) through which the variant(s) impact(s) estrogen action in the pituitary gland, mammary gland and testis are not known.
The primary objective of this study was to confirm the existence of Ept7 and to quantify the impact of this QTL on responsiveness of the pituitary gland to estrogens. Secondary objectives were to determine if Ept7 influences the responsiveness of the male reproductive tract to estrogens and to identify other discernible phenotypes influenced by Ept7. To achieve these objectives, we generated a congenic rat strain in which BN alleles across the Ept7 interval were introgressed onto the genetic background of the ACI strain, and defined the effect of administered estrogens on the anterior pituitary gland and male reproductive tissues. Data presented herein indicate Ept7 exerts a marked effect on development of lactotroph hyperplasia in response to estrogen treatment, but does not affect atrophy of the male reproductive tissues in response to hormone treatment. Ept7 also exerts gender-specific effects on body weight in young adult rats.
Material and methods
Care, treatment and phenotypic characterization of animals
All procedures involving live animals were approved by our Institutional Animal Care and Use Committee. ACI/SegHsd (ACI) and BN/SsNHsd (BN) rats were obtained from Harlan Sprague Dawley, Inc. (Indianapolis, IN). The ACI.BN-Ept7 congenic rat strain was generated in our laboratory as described below. All rats were housed in a barrier facility under controlled temperature, humidity, and 12-h light/12-h dark conditions. This facility was accredited by the American Association for Accreditation of Laboratory Animal Care and operated in accordance with the Guide for the Care and Use of Laboratory Animals (DHHS Pub. 85-23). All procedures related to the care and treatment of experimental animals have been described (Gould et al. 2006; Kurz et al. 2008; Shull et al. 2007; Spady et al. 1999c; Strecker et al. 2005). Silastic™ tubing implants containing the synthetic estrogen DES were prepared as described previously and were surgically inserted into 9-week-old male rats (Gould et al. 2006; Kurz et al. 2008; Shull et al. 2007; Spady et al. 1999c; Strecker et al. 2005). Female rats were similarly treated using Silastic™ implants containing 17β-estradiol (E2) (Shull et al. 1997; Gould et al. 2004; Schaffer et al. 2006; Schaffer et al. 2013). The control animals received empty implants. The rats were euthanized by decapitation 12 weeks later and the anterior pituitary gland and reproductive tissues were collected, photographed and evaluated as described previously (Gould et al. 2006; Kurz et al. 2008; Shull et al. 2007; Spady et al. 1999c; Strecker et al. 2005). Representative photographs are presented in Supplemental Fig. 1. Testes were fixed in Bouin’s, embedded in paraffin, sectioned, stained with hematoxylin/eosin and evaluated by bright-field microscopy (Bott et al. 2006; Cupp et al. 2003).
Generation of the ACI.BN-Ept7 congenic rat strain
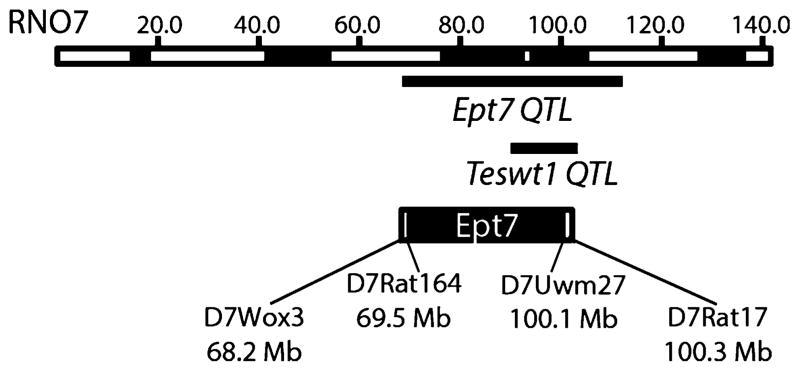
The ACI.BN-Ept7 congenic rat strain (ILAR designated strain name is ACI.BN-(D7Rat164-D7Uwm27)/Shul; Rat Genome Database strain identification number is 7248725) was generated by mating an ACI male to a BN female to generate N1 progeny. N1 males were backcrossed to ACI females to produce N2 progeny, and male progeny were mated to ACI females to produce each subsequent generation of backcross progeny. At each generation of back-crossing, the male progeny were genotyped to identify those that were heterozygous for BN alleles across Ept7 on RNO7 (Tier 1 markers in Supplemental Table 1), the heterozygous males were genotyped at markers on the remaining autosomes to identify those rats that carried the fewest BN alleles at the background markers (Tier 2 markers in Supplemental Table 1), and these males were utilized as breeders. An N5 male was identified that was heterozygous across a large segment of RNO7 and homozygous for ACI alleles at all background markers. Additional rounds of backcrossing heterozygous males to ACI females resulted in a recombinant chromosome that harbored BN alleles from D7Rat164 (69.5 Mb) to D7Uwm27 (100.11 Mb). A male rat carrying this chromosome was mated to ACI females and heterozygous progeny were intercrossed to generate the ACI.BN-Ept7 congenic strain. Animals from the ACI.BN-Ept7 strain were subsequently genotyped using a panel of 123 microsatellite markers distributed across the genome to confirm the genetic background of this congenic strain was that of the recipient ACI strain (Tier 3 markers in Supplemental Table 1). A schematic of the recombinant chromosome interval is illustrated in Fig. 1.
Fig. 1.
Ept7 congenic interval. RNO7, which is approximately 143 Mb in length, is depicted at the top of the figure. Relative cytogenetic bands are indicated as black or white segments. The Ept7 QTL was identified by interval mapping analyses of (BNxACI)F2 progeny. The Teswt1 QTL, which influences testes weight in male rats treated with DES, was mapped using LEXF and FXLE recombinant inbred rat strains. The congenic interval for Ept7 is illustrated, with the black region indicating homozygosity for BN alleles and the flanking white regions representing the intervals of unknown genotype in which recombination occurred. The remainder of RNO7 is homozygous for ACI alleles. The known BN congenic interval for Ept7 lies between the markers D7Rat164 and D7Uwm27, and the maximum Ept7 congenic interval extends from D7Wox3 to D7Rat17
Statistical analysis of data
Pituitary, body, and reproductive organ weights were expressed as the mean ± standard error of the mean (SEM). Significance was determined by one-way ANOVA using the statistical software R (R Development Core Team 2011). Tukey’s HSD test was subsequently used to detect pairwise significant differences. p < 0.05 was considered significant.
Results
Ept7 influences induction of lactotroph hyperplasia by estrogen
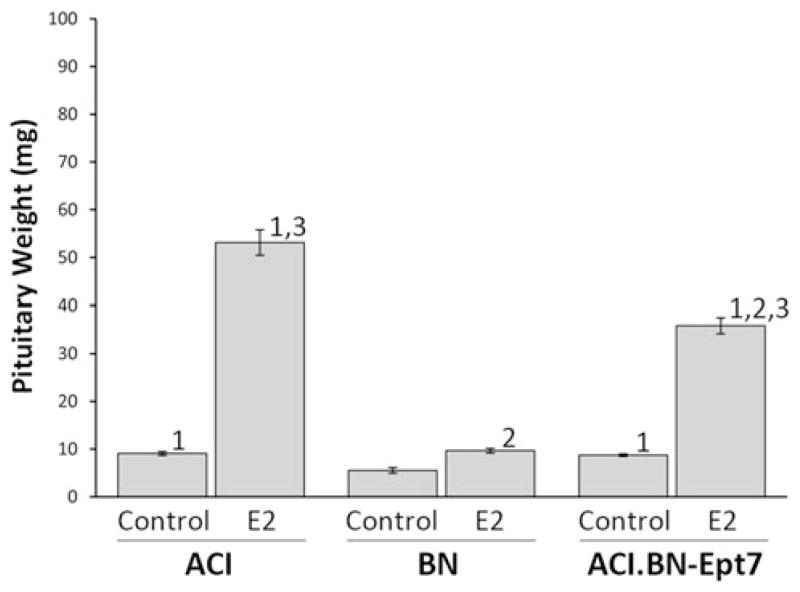
Pituitary mass was utilized as a phenotypic indicator of responsiveness to estrogen. It is well established that continuous treatment of female or male rats with naturally occurring or synthetic estrogens induces lactotroph hyperplasia and increases, in a rat strain specific manner, pituitary mass. Because pituitary mass in estrogen treated rats is highly correlated with pituitary DNA content, an indicator of total cell number, and the concentration of circulating PRL, the hormone product of the lactotroph, pituitary mass serves as a surrogate indicator of absolute lactotroph number (Kurz et al. 2008; Spady et al. 1999a; Tachibana et al. 2006). Treatment of female ACI rats with E2 for 12 weeks increased pituitary mass 5.8 fold, from 9.1 ± 0.4 mg in sham treated control rats to 53.1 ± 23.7 mg in treated rats (Fig. 2). By contrast, E2 treatment increased pituitary mass only 1.7-fold in female BN rats and 4.1-fold in female ACI.BN-Ept7 rats. Pituitary mass in treated ACI.BN-Ept7 rats was significantly less than observed in treated ACI rats, but greater than observed in treated BN rats. The differences in the impact of E2 treatment on pituitary mass in the three rat strains remained apparent when the data were corrected for body weight (data not shown, discussed further below). These data indicate that BN alleles at Ept7 attenuate induction of lactotroph hyperplasia in female rats treated for 12 weeks with the naturally occurring estrogen E2. Induction of lactotroph proliferation was also significantly attenuated in female ACI.BN-Ept7 rats treated with E2 for 28 weeks, when compared to treated ACI rats (data not shown).
Fig. 2.
Ept7 affects induction of pituitary growth in female rats by 17β-Estradiol. E2 was administered through continuous release from Silastic™ implants that were inserted subcutaneously when the rats were 9 weeks of age. Sham treated control rats received empty implants. The rats were euthanized 12 weeks later. Pituitary weight was evaluated as an indicator of E2-induced lactotroph hyperplasia. Each data bar represents the mean ± standard error of the mean, n = 2–26 animals per group. 1, p ≤ 0.05 for comparison between sham treated and 17β-Estradiol treated rats of same strain. 2, p ≤ 0.05 for comparison to ACI rats that received the same treatment. 3, p ≤ 0.05 for comparison to BN rats that received the same treatment
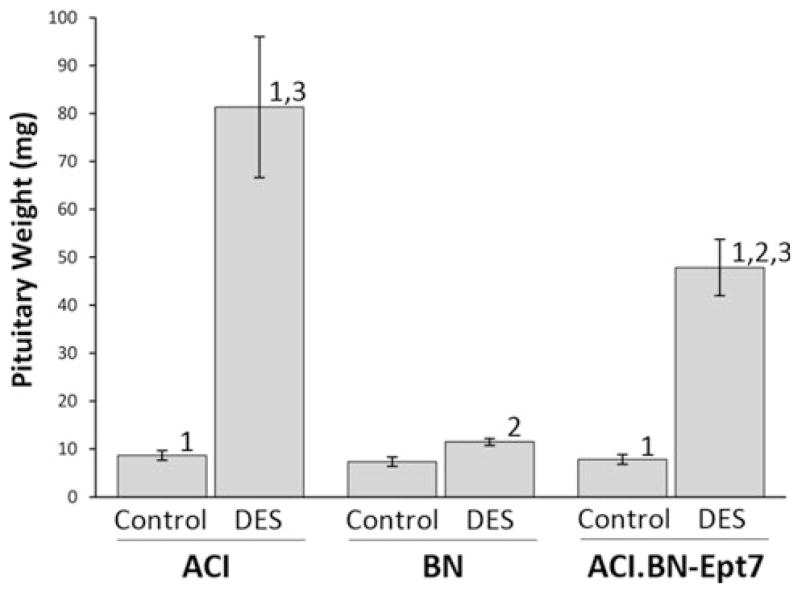
Parallel studies were performed using male rats treated with DES to determine if the impact of Ept7 on induction of lactotroph hyperplasia was specific to gender or the chemical form of estrogen used to induce lactotroph proliferation. The method used in this study to treat male rats with DES was identical to that used in multiple published studies on genetic control of estrogen action in the pituitary gland and was chosen to allow data generated in this study to be compared to data generated in the previous studies (Spady et al. 1999c; Strecker et al. 2005; Gould et al. 2006). Treatment of male ACI rats with DES for 12 weeks increased pituitary mass 9.4-fold, from 8.7 ± 0.3 mg in sham treated controls to 81.3 ± 14.7 mg in treated rats (Fig. 3). By contrast, treatment with DES increased pituitary mass only 1.6-fold in BN rats. Pituitary mass was increased 6.1-fold in ACI.BN-Ept7 congenic rats in response to DES treatment, from 7.8 ± 0.5 mg in control rats to 47.9 ± 5.9 mg in treated rats. Pituitary mass in ACI.BN-Ept7 rats was significantly less than in treated ACI rats, but was greater than observed in DES treated BN rats. The differences in the impact of DES treatment on pituitary mass in the three rat strains remained apparent when the data were corrected for body weight (data not shown). Photographs of representative tissues from each experimental group of male rats are illustrated in Supplemental Fig. 1. These data further support the conclusion that BN alleles at Ept7 significantly attenuate the ability of administered estrogens to increase pituitary mass, and indicate that this action of Ept7 is not specific to gender or to the chemical form of estrogen used to induce lactotroph proliferation.
Fig. 3.
Ept7 affects induction of pituitary growth in male rats by diethylstilbestrol. DES was administered through continuous release from Silastic™ implants that were inserted subcutaneously when the rats were 9 weeks of age. Sham treated control rats received empty implants. The rats were euthanized 12 weeks later. Pituitary weight was evaluated as an indicator of the effects of DES on pituitary growth resulting from lactotroph hyperplasia. Each data bar represents the mean ± standard error of the mean, n = 4–6 rats per group. 1, p ≤ 0.05 for comparison between sham treated and DES treated rats of same strain. 2, p ≤ 0.05 for comparison to ACI rats that received the same treatment. 3, p ≤ 0.05 for comparison to BN rats that received the same treatment
Ept7 does not affect DES-induced atrophy of male reproductive tissues
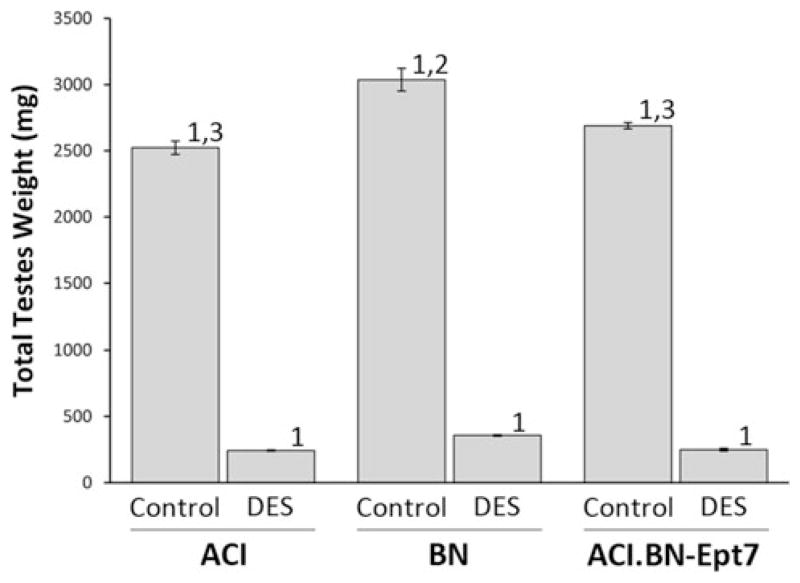
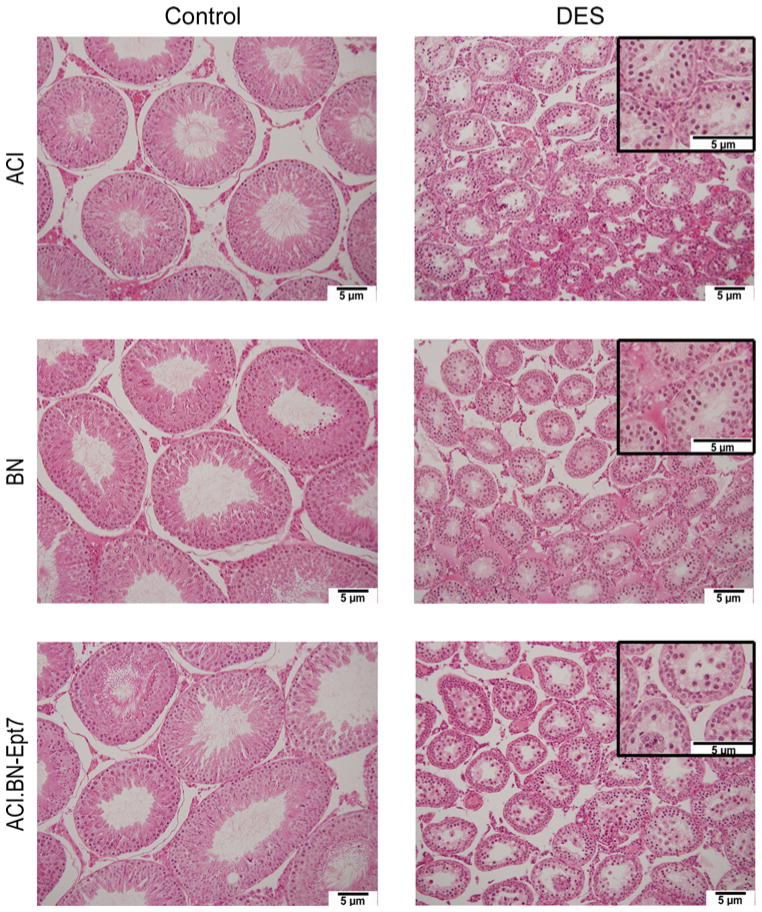
Treatment of male rats with estrogens is known to decrease production of the gonadotropins follicle stimulating hormone (FSH) and luteinizing hormone (LH), which in turn reduces production of androgens by the testes, resulting in atrophy of the androgen dependent reproductive tissues (Shin et al. 2009). In accord with this observation, micro-array data from our laboratory indicate the mRNAs encoding the beta subunits of both FSH and LH were dramatically reduced in response to DES treatment in both male ACI and male BN rats (manuscript in preparation; Tong et al. 2012). Total testes weight was reduced by 88–91% in response to 12 weeks of DES treatment in ACI, BN and ACI.BN-Ept7 rats and the degree to which DES treatment induced atrophy of the testes did not differ between the 3 rat strains (Fig. 4). Moreover, no significant differences in the degree to which testes weight was lost in response to DES were observed upon comparison of the 3 strains when total testes weight was normalized to body weight (data not shown). As expected, the effects of DES on atrophy of the right and left testes were equivalent in each of the 3 rat strains (data not shown). Interestingly, the weight of the testes in sham treated control BN rats was significantly greater than in treatment matched ACI and ACI.BN-Ept7 rats, and this difference remained apparent upon normalization to body weight. Histological evaluation of the testes revealed that treatment with DES resulted in a marked reduction in the size of the seminiferous tubules, in apparent proportion to the reduction in size of the testis, and depletion of developing germ cells (Fig. 5). No discernible differences in these responses to DES were observed upon comparison between the 3 rat strains. Together, these data indicate that Ept7 does not influence testes weight in control or DES treated rats or the degree to which treatment with DES induces testicular atrophy and germ cell depletion.
Fig. 4.
Ept7 does not affect atrophy of testes in response to DES. Rats were treated as described in Fig. 3. The combined weight of the right and left testes was evaluated as an indicator of DES induced atrophy. Each data bar represents the mean ± standard error of the mean, n = 5–6 rats per group. 1, p ≤ 0.05 for comparison between sham treated and DES treated rats of same strain. 2, p ≤ 0.05 for comparison to ACI rats that received the same treatment. 3, p ≤ 0.05 for comparison to BN rats that received the same treatment
Fig. 5.
DES treatment results in depletion of developing germ cells. Rats were treated as described in Fig. 3. Testes from representative sham treated control and DES treated ACI, BN and ACI.BN-Ept7 rats are illustrated. Higher magnification images for testes from DES treated rats are inset to illustrate depletion of germ cells
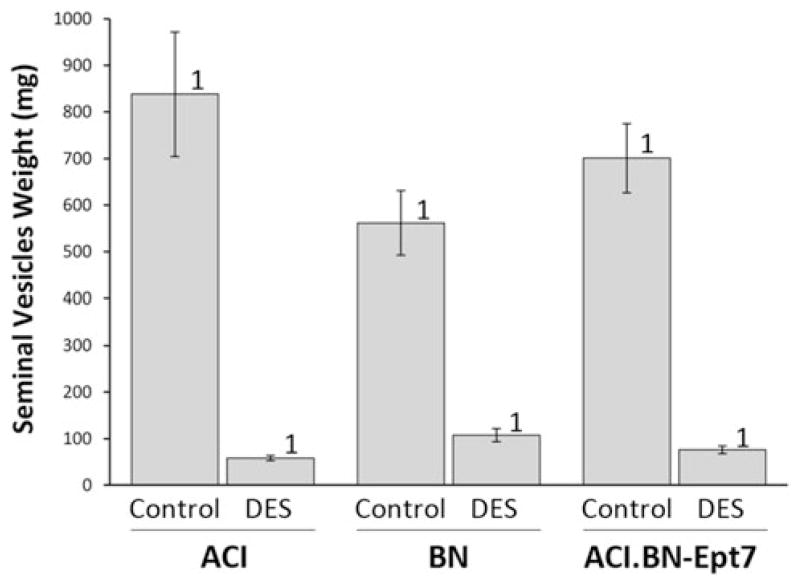
Treatment with DES also induced atrophy of the epididymides and seminal vesicles. The total weight of the epididymides was 85–90% lower in DES treated rats, compared to sham treated control rats, and no significant differences were observed upon comparison of the degree to which DES treatment reduced the weight of the epididymides in the 3 rat strains (Fig. 6). Similarly, the total weight of the seminal vesicles was reduced by 81 to 93% in response to DES treatment in each of the 3 rat strains (Fig. 7). No significant differences in these phenotypes were observed when organ weights were normalized to body weight (data not shown). Together, these data further indicate that Ept7 does not influence induction of atrophy in male genital tissues by DES.
Fig. 6.
Ept7 does not affect atrophy of epididymides in response to DES. Rats were treated as described in Fig. 3. The combined weight of the right and left epididymides was evaluated as an indicator of DES induced atrophy. Each data bar represents the mean ± standard error of the mean, n = 4–6 rats per group. 1, p ≤ 0.05 for comparison between sham treated and DES treated rats of same strain. 2, p ≤ 0.05 for comparison to ACI rats that received the same treatment. 3, p ≤ 0.05 for comparison to BN rats that received the same treatment
Fig. 7.
Ept7 does not affect atrophy of seminal vesicles in response to DES. Rats were treated as described in Fig. 3. The combined weight of the right and left seminal vesicles was evaluated as an indicator of DES induced atrophy. Each data bar represents the mean ± standard error of the mean, n = 5–6 rats per group. 1, p ≤ 0.05 for comparison between sham treated and DES treated rats of same strain. 2, p ≤ 0.05 for comparison to ACI rats that received the same treatment. 3, p ≤ 0.05 for comparison to BN rats that received the same treatment
Ept7 harbors one or more genetic determinants of body weight
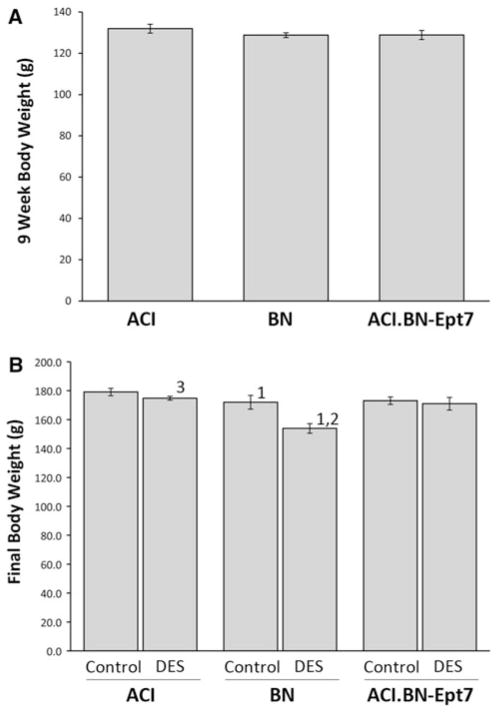
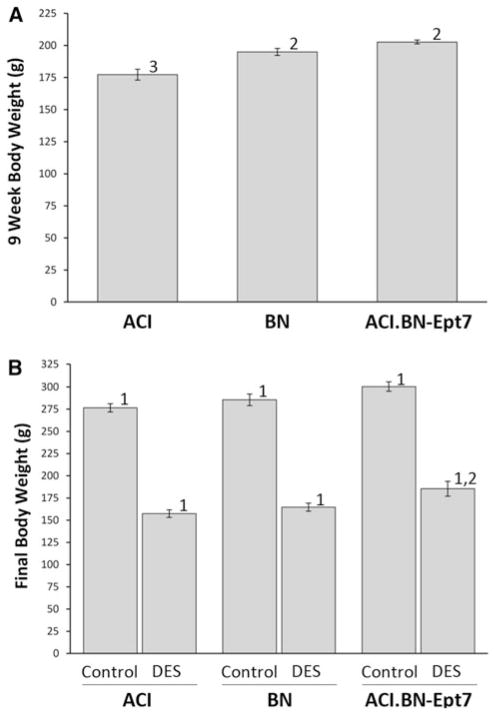
Interval mapping analyses of a previously described population of 251 female (BNxACI)F2 rats using body weight at 9 weeks of age as the phenotype provided suggestive evidence of a QTL on RNO7; the peak LOD score for this putative QTL was near D7Rat19 and ACI alleles at this marker were associated with higher body weight in the (BNxACI)F2 population (Schaffer et al. 2006; data not shown). To determine whether a body weight QTL resides within the Ept7 congenic interval, body weight was evaluated at 9 weeks of age, the time point at which treatment with estrogen was initiated, and 21 weeks of age, the time point at which the experiments were terminated. Female ACI rats weighed 2–4% more than BN and ACI.BN-Ept7 rats at both 9 weeks of age (Fig. 8a) and 21 weeks of age (Fig. 8b); however, these differences did not achieve statistical significance. The impact of E2 treatment on body weight in ACI and ACI.BN-Ept7 rats was negligible. By contrast, E2 treatment significantly inhibited growth of BN rats, resulting in an 11% difference in body weight between sham treated control and E2 treated BN rats by 21 weeks of age (Fig. 8b). Taken together, these data provide little additional support for the existence of a QTL within the Ept7 congenic interval that influences body weight in female rats. Body weight was similarly evaluated in male rats. At 9 weeks of age, BN and ACI.BN-Ept7 rats weighed significantly more than ACI rats (Fig. 9a). Moreover, sham treated control and DES treated ACI-BN-Ept7 rats weighed more, on average, than similarly treated ACI rats, although the difference between the sham treated control groups did not attain statistical significance (p = 0.057) (Fig. 9b). Treatment with DES attenuated the increase in body weight normally observed between 9 and 21 weeks of age and further resulted in a decrease in body weight relative to that observed at 9 weeks of age. The amount of weight lost was equivalent in ACI, BN and ACI.BN-Ept7 rats. These data suggest that the Ept7 congenic interval may harbor a QTL at which the BN allele increases body weight in male rats.
Fig. 8.
Effect of Ept7 on body weight in female rats. Rats were treated as described in Fig. 2. Body weight was evaluated at 9 weeks of age, the time treatment was initiated (a), and 21 weeks of age, the time the animals were euthanized (b). Each data bar represents the mean ± standard error of the mean; n = 6–35 rats per group in a, 2–26 rats per group in b. 1, p ≤ 0.05 for comparison between sham treated and DES treated rats of same strain. 2, p ≤ 0.05 for comparison to ACI rats that received the same treatment. 3, p ≤ 0.05 for comparison to BN rats that received the same treatment
Fig. 9.
Effect of Ept7 on body weight in male rats. Rats were treated as described in Fig. 3. Body weight was evaluated at 9 weeks of age, the time treatment was initiated (a), and 21 weeks of age, the time the animals were euthanized (b). Each data bar represents the mean ± standard error of the mean; n = 9–10 rats per group in a, 5–6 rats per group in b. 1, p ≤ 0.05 for comparison between sham treated and DES treated rats of same strain. 2, p ≤ 0.05 for comparison to ACI rats that received the same treatment. 3, p ≤ 0.05 for comparison to BN rats that received the same treatment
Ept7 genes and genetic variants
The known BN segment within the Ept7 congenic interval extends over 30.6 Mb from D7Rat164 (69.5 Mb) to D7Uwm27 (100.1 Mb). The maximum Ept7 interval extends over 32.1 Mb from D7Wox3 (68.2 Mb) to D7Rat17 (100.3 Mb). Using Ensembl BioMart and rat genome assembly version 3.4, it was determined that the maximal Ept7 interval contains 146 known protein coding genes and 43 genes that encode various RNA types other than mRNA (Supplemental Table 2). The genome ontology terms associated with these genes are provided in Supplemental Table 3. Several Ept7 resident genes are annotated in relation to regulation of cell proliferation and/or apoptosis, for examples Myc, Stk3 and Klf10, and two are annotated in relation to response to estrogen stimulus, Tnfrsf11b and Angpt1. Using the Variant Visualizer tool on Rat Genome Database, it was established that the maximal Ept7 congenic interval may harbor up to 55,115 variants between various genome sequence data sets for ACI and BN/NHsd strains, approximately 1.8 variants per 1,000 nucleotides (Supplemental Table 4). Non-synonymous nucleotide variants may exist in three of the protein coding genes residing within the Ept7 congenic interval, RGD1562404, Eif3e and Pkhd1l1 (Supplemental Table 5).
Discussion
Data presented herein indicate that BN alleles at Ept7 on RNO7 attenuate the ability of the naturally occurring estrogen E2 and the synthetic estrogen DES to induce gross enlargement of the anterior pituitary gland in female and male rats, respectively. It is well established that pituitary enlargement in ACI rats treated with estrogens results from induction of lactotroph hyperplasia/adenoma, which leads to a dramatic increase in total lactotroph number and hyperprolactinemia (Harvell et al. 2002; Kurz et al. 2008; Shull et al. 1997; Shull et al. 2007; Spady et al. 1999a; Spady et al. 1999b; Spady et al. 1999c; Strecker et al. 2005; Tong et al. 2013). Therefore, we conclude that Ept7 harbors a genetic variant or variants that influences, directly or indirectly, the responsiveness of the pituitary lactotroph to estrogens. Ept7 was originally mapped as a genetic determinant of estrogen responsiveness in the pituitary gland of female rats treated with E2. The data presented herein clearly indicate the actions of Ept7 are not specific to gender or the chemical form of the administered hormone. The site and mechanisms of action of Ept7 are not presently known. One possible site of action is the pituitary lactotroph itself, which is capable of proliferating in vitro in response to estrogens (Gersten and Baker 1970; Spady et al. 1999a). A second possible site of Ept7 action is the tuberoinfundibular dopaminergic neurons, which originate in the arcuate nucleus and terminate in the median eminence in association with the hypophyseal portal capillary network, which in turn transports released dopamine to the anterior pituitary gland where it acts to inhibit lactotroph proliferation, PRL gene transcription, and PRL secretion (Shaw-Bruha et al. 1996).
By contrast to its effects on induction of pituitary growth by estrogens, Ept7 did not exert a discernible effect on the ability of DES to induce atrophy of male reproductive tissues including testes, epididymides and seminal vesicles. These data indicate that the actions of this locus on responsiveness to DES are cell type or tissue specific. Interestingly, Teswt1, which was mapped by Tachibana and colleagues as a genetic determinant of testes weight in DES treated LEXF and FXLE recombinant inbred rats, did not affect induction of pituitary growth in the same experimental animals (Tachibana et al. 2006). Together, the data from these two studies strongly suggest that distinct genetic variants residing in the same region of RNO7 affect induction of pituitary growth and atrophy of the male reproductive tissues and further suggest the ACI and BN strains do not differ for the Teswt1 causal variants and F344 and Lewis strains do not differ for the Ept7 causal variants.
The Ept7 congenic interval was observed in this study to harbor a variant or variants that may exert a slight impact on body weight in female rats while exerting an opposing significant impact on body weight in male rats. The site(s) and mechanism(s) of action of this variant(s) are not presently known. Also not known is whether the same variant influences induction of pituitary growth by DES and body weight. The Rat Genome Database lists 4 reports of body weight QTL in this region of RNO7 (Laulederkind et al. 2013; Nigam et al. 2013). Interestingly, BN derived rats were utilized in each of the studies in which all 4 of these body weight QTL were identified, suggesting the BN strain may harbor a genetic variant on RNO7 that increases body weight in progeny that inherit this variant.
The peak LOD region of Ept7 and the distal segment of the Ept7 congenic interval are orthologous to the 8q24 locus in humans (Shull et al. 2007). As noted above, Emca4, a QTL that influences susceptibility to estrogen-induced mammary cancer in a BNxACI intercross, has been mapped to the same region of RNO7 as Ept7 (Schaffer et al. 2006). Many common diseases, including breast cancer, have been linked in genome wide association studies to single nucleotide polymorphisms (SNPs) residing within the 8q24 locus (Easton et al. 2007; Garcia-Closas and Chanock 2008). This 8q24 risk locus consists of a gene desert flanking the proto-oncogene Myc. It is frequently hypothesized that genetic variants residing in the 8q24 risk locus influence disease susceptibility by impacting the binding of trans-acting transcription factors to their cognate cis-acting elements, thereby exerting allele specific and cell type specific effects on expression of Myc and consequently modulating the downstream actions of Myc on regulation of cell proliferation and survival. Myc has been demonstrated to be co-expressed with Pit1 in lactotrophs (Mukdsi et al. 2004). Treatment with DES induces expression of Myc mRNA both in male ACI and male BN rats (manuscript in preparation; Tong et al. 2013). Ongoing studies are focused on fine mapping the locations of Ept7 and Emca4 loci on RNO7 so as to define the physical and functional relationships between these loci and better understand the mechanisms through which these QTL influence estrogen action in the anterior pituitary and mammary glands.
Supplementary Material
Acknowledgments
This work was supported by grant R01-CA77876 from the National Cancer Institute and a UCARE award from the University of Nebraska Foundation. Shared research resources at the University of Nebraska Medical Center were supported by Cancer Center Support Grant P30-CA036727, and those at the University of Wisconsin-Madison were supported by Cancer Center Support Grant P30-CA014520.
Footnotes
Electronic supplementary material The online version of this article (doi:10.1007/s00335-014-9504-4) contains supplementary material, which is available to authorized users.
Conflict of interest The authors have no conflicts of interest to declare.
Contributor Information
Scott G. Kurz, Department of Genetics, Cell Biology and Anatomy, University of Nebraska Medical Center, Omaha, NE 68198, USA. Eppley Institute for Research in Cancer, University of Nebraska Medical Center, Omaha, NE 68198, USA. Department of Animal Science, Institute of Agriculture and Natural Resources, University of Nebraska, Lincoln, NE 68583, USA
Kirsten L. Dennison, McArdle Laboratory for Cancer Research, Department of Oncology, School of Medicine and Public Health, University of Wisconsin, 1400 University Ave., Madison, WI 53706-1526, USA
Nyssa Becker Samanas, McArdle Laboratory for Cancer Research, Department of Oncology, School of Medicine and Public Health, University of Wisconsin, 1400 University Ave., Madison, WI 53706-1526, USA.
Maureen Peters Hickman, McArdle Laboratory for Cancer Research, Department of Oncology, School of Medicine and Public Health, University of Wisconsin, 1400 University Ave., Madison, WI 53706-1526, USA.
Quincy A. Eckert, McArdle Laboratory for Cancer Research, Department of Oncology, School of Medicine and Public Health, University of Wisconsin, 1400 University Ave., Madison, WI 53706-1526, USA
Tiffany L. Walker, Department of Animal Science, Institute of Agriculture and Natural Resources, University of Nebraska, Lincoln, NE 68583, USA
Andrea S. Cupp, Department of Animal Science, Institute of Agriculture and Natural Resources, University of Nebraska, Lincoln, NE 68583, USA
James D. Shull, Email: shull@oncology.wisc.edu, Department of Genetics, Cell Biology and Anatomy, University of Nebraska Medical Center, Omaha, NE 68198, USA. Eppley Institute for Research in Cancer, University of Nebraska Medical Center, Omaha, NE 68198, USA. Department of Animal Science, Institute of Agriculture and Natural Resources, University of Nebraska, Lincoln, NE 68583, USA. McArdle Laboratory for Cancer Research, Department of Oncology, School of Medicine and Public Health, University of Wisconsin, 1400 University Ave., Madison, WI 53706-1526, USA. UW Carbone Cancer Center, School of Medicine and Public Health, University of Wisconsin, Madison, WI, USA. Molecular and Environmental Toxicology Center, School of Medicine and Public Health, University of Wisconsin, Madison, WI 53706, USA
References
- Bott RC, McFee RM, Clopton DT, Toombs C, Cupp AS. Vascular endothelial growth factor and kinase domain region receptor are involved in both seminiferous cord formation and vascular development during testis morphogenesis in the rat. Biol Reprod. 2006;75:56–67. doi: 10.1095/biolreprod.105.047225. [DOI] [PMC free article] [PubMed] [Google Scholar]
- Cupp AS, Uzumcu M, Suzuki H, Dirks K, Phillips B, et al. Effect of transient embryonic in vivo exposure to the endocrine disruptor methoxychlor on embryonic and postnatal testis development. J Androl. 2003;24:736–745. doi: 10.1002/j.1939-4640.2003.tb02736.x. [DOI] [PubMed] [Google Scholar]
- Easton DF, Pooley KA, Dunning AM, Pharoah PD, Thompson D, et al. Genome-wide association study identifies novel breast cancer susceptibility loci. Nature. 2007;447:1087–1093. doi: 10.1038/nature05887. [DOI] [PMC free article] [PubMed] [Google Scholar]
- Garcia-Closas M, Chanock S. Genetic susceptibility loci for breast cancer by estrogen receptor status. Clin Cancer Res. 2008;14:8000–8009. doi: 10.1158/1078-0432.CCR-08-0975. [DOI] [PMC free article] [PubMed] [Google Scholar]
- Gersten BE, Baker BL. Local action of intrahypophyseal implants of estrogen as revealed by staining with peroxidase-labeled antibody. Amer J Anat. 1970;128:1–19. doi: 10.1002/aja.1001280102. [DOI] [PubMed] [Google Scholar]
- Gould KA, Tochacek M, Schaffer BS, Reindl TM, Murrin CR, et al. Genetic determination of susceptibility to estrogen-induced mammary cancer in the ACI rat: mapping of Emca1 and Emca2 to chromosomes 5 and 18. Genetics. 2004;168:2113–2125. doi: 10.1534/genetics.104.033878. [DOI] [PMC free article] [PubMed] [Google Scholar]
- Gould KA, Strecker TE, Hansen KK, Bynote KK, Peterson KA, et al. Genetic mapping of loci controlling sensitivity to diethylstilbestrol-induced thymic atrophy in the Brown Norway rat. Mamm Genome. 2006;17:451–464. doi: 10.1007/s00335-005-0183-z. [DOI] [PubMed] [Google Scholar]
- Harvell DME, Strecker TE, Xie B, Pennington KL, McComb RD, et al. Dietary energy restriction inhibits estrogen-induced mammary, but not pituitary, tumorigenesis in the ACI rat. Carcinogenesis. 2002;23:161–169. doi: 10.1093/carcin/23.1.161. [DOI] [PubMed] [Google Scholar]
- Kurz SG, Hansen KK, McLaughlin MT, Shivaswamy V, Schaffer BS, et al. Tissue-Specific Actions of the Ept1, Ept2, Ept6, and Ept9 Genetic Determinants of Responsiveness to Estrogens in the Female Rat. Endocrinology. 2008;149:3850–3859. doi: 10.1210/en.2008-0173. [DOI] [PMC free article] [PubMed] [Google Scholar]
- Laulederkind SJ, Hayman GT, Wang SJ, Smith JR, Lowry TF, et al. The rat genome database 2013–data, tools and users. Brief Bioinform. 2013;14:520–526. doi: 10.1093/bib/bbt007. [DOI] [PMC free article] [PubMed] [Google Scholar]
- Mukdsi JH, De Paul AL, Munoz S, Aoki A, Torres AI. Immunolocalization of Pit-1 in gonadotroph nuclei is indicative of the transdifferentiation of gonadotroph to lactotroph cells in prolactinomas induced by estrogen. Histochem Cell Biol. 2004;121:453–462. doi: 10.1007/s00418-004-0661-5. [DOI] [PubMed] [Google Scholar]
- Nigam R, Laulederkind SJ, Hayman GT, Smith JR, Wang SJ, et al. Rat genome database: a unique resource for rat, human and mouse quantitative trait locus (QTL) data. Physiol Genomics. 2013;45:809–816. doi: 10.1152/physiolgenomics.00065.2013. [DOI] [PMC free article] [PubMed] [Google Scholar]
- R Development Core Team. R: a language and environment for statistical computing 2011 [Google Scholar]
- Sarkar DK. Genesis of prolactinomas: studies using estrogen-treated animals. Front Horm Res. 2006;35:32–49. doi: 10.1159/000094307. [DOI] [PMC free article] [PubMed] [Google Scholar]
- Sarkar DK, Hentges ST, De A, Reddy RHR. Hormonal control of pituitary prolactin-secreting tumors. Front Biosci. 1998;3:d934–d943. doi: 10.2741/a334. [DOI] [PubMed] [Google Scholar]
- Schaffer BS, Lachel CM, Pennington KL, Murrin CR, Strecker TE, et al. Genetic bases of estrogen-induced tumorigenesis in the rat: mapping of loci controlling susceptibility to mammary cancer in a Brown Norway × ACI intercross. Cancer Res. 2006;66:7793–7800. doi: 10.1158/0008-5472.CAN-06-0143. [DOI] [PubMed] [Google Scholar]
- Schaffer BS, Leland-Wavrin KM, Kurz SG, Colletti JA, Seiler NL, et al. Mapping of three genetic determinants of susceptibility to estrogen-induced mammary cancer within the Emca8 locus on rat chromosome 5. Cancer Prevent Res. 2013;6:59–69. doi: 10.1158/1940-6207.CAPR-12-0346-T. [DOI] [PMC free article] [PubMed] [Google Scholar]
- Schlechte JA. Long-term management of prolactinomas. J Clin Endocrinol Metab. 2007;92:2861–2865. doi: 10.1210/jc.2007-0836. [DOI] [PubMed] [Google Scholar]
- Shaw-Bruha CM, Happe HK, Murrin LC, Rodriguez-Sierra JF, Shull JD. 17β-estradiol inhibits the production of dopamine by the tuberoinfundibular dopaminergic neurons of the male rat. Brain Research Bulletin. 1996;40:33–36. doi: 10.1016/0361-9230(96)00004-4. [DOI] [PubMed] [Google Scholar]
- Shin JH, Kim TS, Kang IH, Kang TS, Moon HJ, et al. Effects of postnatal administration of diethylstilbestrol on puberty and thyroid function in male rats. J Reprod Dev. 2009;55:461–466. doi: 10.1262/jrd.20169. [DOI] [PubMed] [Google Scholar]
- Shull JD, Spady TJ, Snyder MC, Johansson SL, Pennington KL. Ovary intact, but not ovariectomized female ACI rats treated with 17β-estradiol rapidly develop mammary carcinoma. Carcinogenesis. 1997;18:1595–1601. doi: 10.1093/carcin/18.8.1595. [DOI] [PubMed] [Google Scholar]
- Shull JD, Lachel CM, Murrin CR, Pennington KL, Schaffer BS, et al. Genetic control of estrogen action in the rat: mapping of QTL impacting pituitary lactotroph hyperplasia in a BN × ACI intercross. Mamm Genome. 2007;18:657–669. doi: 10.1007/s00335-007-9052-2. [DOI] [PubMed] [Google Scholar]
- Spady TJ, McComb RD, Shull JD. Estrogen action in the regulation of cell proliferation, cell survival, and tumorigenesis in the rat anterior pituitary gland. Endocrine. 1999a;11:217–233. doi: 10.1385/ENDO:11:3:217. [DOI] [PubMed] [Google Scholar]
- Spady TJ, Pennington KL, McComb RD, Birt DF, Shull JD. Estrogen induced pituitary tumor development in the ACI rat is not inhibited by dietary energy restriction. Mol Carcinog. 1999b;26:239–254. [PubMed] [Google Scholar]
- Spady TJ, Pennington KL, McComb RD, Shull JD. Genetic bases of estrogen-induced pituitary growth in an intercross between the ACI and Copenhagen rat strains: dominant Mendelian inheritance of the ACI phenotype. Endocrinology. 1999c;140:2828–2835. doi: 10.1210/endo.140.6.6757. [DOI] [PubMed] [Google Scholar]
- Strecker TE, Spady TJ, Schaffer BS, Gould KA, Kaufman AE, et al. Genetic bases of estrogen-induced pituitary tumorigenesis: identification of genetic loci determining estrogen-induced pituitary growth in reciprocal crosses between the ACI and Copenhagen rat strains. Genetics. 2005;169:2189–2197. doi: 10.1534/genetics.104.039370. [DOI] [PMC free article] [PubMed] [Google Scholar]
- Tachibana M, Lu L, Hiai H, Tamura A, Matsushima Y, et al. Quantitative trait loci determining weight reduction of testes and pituitary by diethylstilbesterol in LEXF and FXLE recombinant inbred strain rats. Exp Anim. 2006;55:91–95. doi: 10.1538/expanim.55.91. [DOI] [PubMed] [Google Scholar]
- Tong Y, Zheng Y, Zhou J, Oyesiku NM, Koeffler HP, et al. Genomic characterization of human and rat prolactinomas. Endocrinology. 2012;153:3679–3691. doi: 10.1210/en.2012-1056. [DOI] [PMC free article] [PubMed] [Google Scholar]
- Wendell DL, Gorski J. Quantitative trait loci for estrogen-dependent pituitary tumor growth in the rat. Mamm Genome. 1997;8:823–829. doi: 10.1007/s003359900586. [DOI] [PubMed] [Google Scholar]
- Wiklund JA, Gorski J. Genetic differences in estrogen-induced deoxyribonucleic acid synthesis in the rat pituitary: correlations with pituitary tumor susceptibility. Endocrinology. 1982;111:1140–1149. doi: 10.1210/endo-111-4-1140. [DOI] [PubMed] [Google Scholar]
- Wiklund J, Rutledge J, Gorski J. A genetic model for the inheritance of pituitary tumor susceptibility in F344 rats. Endocrinology. 1981a;109:1708–1714. doi: 10.1210/endo-109-5-1708. [DOI] [PubMed] [Google Scholar]
- Wiklund J, Wertz N, Gorski J. A comparison of estrogen effects on uterine and pituitary growth and prolactin synthesis in F344 and Holtzman rats. Endocrinology. 1981b;109:1700–1707. doi: 10.1210/endo-109-5-1700. [DOI] [PubMed] [Google Scholar]
Associated Data
This section collects any data citations, data availability statements, or supplementary materials included in this article.


