

Abstract
We describe a label-free relative quantification LC-MS/MS method for core-fucosylationin alpha-2-macroglobulin (A2MG) immunoprecipitated from human sera. The method utilizes endoglycosidase F partial deglycosylation to reduce glycosylation microheterogeneity, while retaining the innermost N-acetylglucosamine (GlcNAc) and core fucose. Precursor ion peak areas of partially deglycosylated peptides were obtained and site-specific core-fucosylation ratios based on the peak areas of core-fucosylated and non-fucosylated counterparts were calculated and evaluated for assay development. This assay was applied in a preliminary study of sera samples from normal controls and patients with pancreatic diseases, including pancreatic cancer and chronic pancreatitis. A2MG fucosylation levels at site N396 and N1424 were found to decrease in both chronic pancreatitis and pancreatic cancer compared to normal controls. The two sites were identified by two peptides and their core-fucosylation ratios were found to be internally consistent. This method provides a platform to quantify fucosylation levels and can be used to study site-specific core-fucosylation aberrations in other glycoproteins for other diseases.
Keywords: Label-free quantification, LC-MS/MS, alpha-2-macroglobulin, core-fucosylation, site-specific glycosylation
1. Introduction
Protein N-glycosylation, where polysaccharides attach to the Asn in the sequon of Asn-Xxx-Ser/Thr (Xxx is any amino acid except Pro), is a prevalent post-translational modification. Protein glycosylation mediates multiple protein and cell functions including protein folding, signal transduction, immune response, and cell metastasis.[1, 2] Protein glycosylation usually reflects the physiological and pathological environment of cells, and its alterations have been found to be involved in the pathogenesis of multiple diseases, including cancers.[3-6] Despite its importance in disease diagnostics, an understanding of protein glycosylation has lagged behind achievements in genomics and proteomics, mostly due to the complexity of glycosylation and the lack of sensitive characterization and quantification methods. One protein may have several glycosylation sites (glycosylation heterogeneity) with multiple possible glycans at each site (glycosylation microheterogeneity). In most glycosylation studies, N-glycans are released from the peptide backbone by peptide N-glycosidase F (PNGase F), followed by separate qualitative and quantitative analysis of glycans[7, 8] and deglycosylated peptides[9, 10]. This approach provides aggregate glycosylation information, but cannot identify site-specific glycosylation patterns. There are relatively few studies on intact glycopeptides due to low concentration and poor ionization efficiency.[11] Quantification of glycopeptides is usually performed with label free strategies using precursor ion intensities.[12, 13]
Core-fucosylation, wherein fucose attaches to the innermost GlcNAc via an α-1,6 linkage, is a subtype of N-glycosylation which has attracted research interest due to its potential as a cancer biomarker.[6, 14, 15] Notably, the core-fucosylation level of alpha-fetoprotein (AFP-L3) is an FDA-approved diagnostic tool for liver cancer.[16] To target site-specific core-fucosylation, endoglycosidase F3 (Endo F3) was used to partially deglycosylate the glycopeptides and retain only the core GlcNAc and fucose. This has been used qualitatively to identify glycosylation sites on both individual proteins[17] and complex protein mixtures such as human plasma[18-21]. Quantitative analysis of serum protein core-fucosylation level changes as a potential hepatocellular carcinoma marker has been performed using precursor intensity-based quantification with differential dimethylation.[22]
Alpha-2-macroglobulin (A2MG) is one of the most abundant proteins in human serum. It is a tetramer with a total molecular weight of 720 kDa with eight potential N-glycosylation sites occupied by complex-type N-glycans with or without core fucose.[17]’[23] As a protease inhibitor, it is reported to inhibit tumor cell proliferation when binding to low-density lipoprotein receptor-related protein 1 (LRP 1).[24] The N-glycosylation of A2MG has been chosen as an initial system to demonstrate our method for the study of fucosylation ratios since it is a relatively high abundance protein with eight potential fucosylation sites and is efficiently purified with an available commercial antibody. In this study, we utilized a label-free LC-MS/MS method to monitor changes of human A2MG core-fucosylation at specific glycosylation sites based on precursor ion intensities of Endo F3 treated glycopeptides. Exploiting the property that partially deglycosylated glycopeptides with the same peptide backbone approximately co-elute by reverse phase liquid chromatography, the core-fucosylation ratio at a particular glycosylation site was calculated by dividing the peak area of fucosylated peptide by the peak area of its non-core-fucosylated counterpart. This is a relative quantification method which eliminates the need for internal standards. The fucosylation ratios at two sites (N396 and N1424) of human serum A2MG were calculated from 20 normal controls, 20 pancreatic cancer patients and 20 chronic pancreatitis patients. Core-fucosylation ratios were found to be lower in both chronic pancreatitis and pancreatic cancer samples relative to normal controls for both sites. This assay could be utilized to monitor core-fucosylation changes in other proteins to identify aberrations in protein core-fucosylation in other diseases.
2. Materials and methods
2.1 Serum samples
Sixty human serum samples (20 normal controls, 20 chronic pancreatitis patients and 20 pancreatic cancer patients) were used; demographic information is given in Table 1. All samples were collected according to IRB approved protocols. Sample aliquots were stored in a -80 °C freezer and frozen and thawed only once.
Table 1.
Demographic information and cancer stage information of human serum samples enrolled in this study.
| Normal | Chronic pancreatitis | Pancreatic cancer | |
|---|---|---|---|
| Age (years) | |||
| <50 | 5 | 6 | 1 |
| 51-60 | 9 | 7 | 5 |
| 61-70 | 6 | 6 | 7 |
| >71 | 0 | 1 | 7 |
|
| |||
| Gender | |||
| Male | 8 | 13 | 13 |
| Female | 12 | 7 | 7 |
|
| |||
| Cancer stage | |||
| IIA | 2 | ||
| IIB | 6 | ||
| III | 6 | ||
| IV | 6 | ||
2.2 Sample preparation
The sample preparation was detailed in previous work.[17] Briefly, alpha-2-macroglobulin was immunoprecipitated (Abcam, Cambridge, MA) from 10 μL human serum which was depleted of IgG. The immunoprecipitation was performed using the cross-link IP kit of Pierce Scientific (Rockford, IL) according to the manufacturer’s instructions. The immunoprecipitated protein was desalted using a Zeba spin-column (Pierce Scientific,) and buffer-exchanged to 50mM ammonium bicarbonate. The protein was reduced with 10 mM dithiothreitol at 45 °C for 30 min, alkylated with 22mM iodoacetamide at room temperature for 45 min, and digested with chymotrypsin (Promega, Madison, WI) in a 37 °C water bath overnight. The digest was dried down using a SpeedVac (Thermo Fisher Scientific, San Jose, CA) and reconstituted in 80% acetonitrile with 2% formic acid. The glycopeptides were enriched using ZIC-HILIC microtips (Protea, Morgantown, WV), where the tip was equilibrated with 80% acetonitrile with 2% formic acid, followed by sample loading, washing and final elution using 2% formic acid in water. The glycopeptides were reconstituted in 50 mM sodium acetate and partially deglycosylated with Endo F3 (QAbio, Palm Desert, CA) in a 37°C water bath overnight.
2.3 NanoLC-LTQ-MS analysis of partially deglycosylated peptides
NanoLC-MS/MS conditions were described in previous work.[17] Gradient separation was performed with a Paradigm MG4 micropump system (Michrom Biosciences, Auburn, CA) with a C18 capillary column (75 μm i.d. × 10 cm; 5 μm particles) at a flow rate of 300 nL/min. Mobile phase A was 2% acetonitrile with 1% acetic acid in water and mobile phase B was 5% water with 1% acetic acid in acetonitrile. The analytical gradient was from 5% to 60% solvent B in 35 min, a rise to 95% in 1 min, a hold for 4 min, a drop to 5% B over 0.1 min, and a hold for 30 min.
An ESI-LTQ mass spectrometer (Thermo Fisher Scientific) was used for analysis. The positive ion mode was used with spray voltage of 2.2 kV and capillary voltage of 45 V. Following a full scan over the mass range of m/z 400 to 1800, the four most intense precursor ions were selected for CID MS/MS (35% NCE), with the strongest product ion further selected for MS3 fragmentation. The activation time for both MS/MS and MS3 is 30 ms.
2.4 Quantitative data analysis
Database search was performed using Proteome Discoverer (version 1.1, Thermo Fisher) with SEQUEST using the following search parameters: (1) static modification: carbamidomethylation (+57.0 Da, C); (2) dynamic modifications: oxidation (+16.0 Da, M), N-acetylglucosamine (+203.1 Da, N) or N-acetylglucosamine-fucose (+349.1 Da, N); (3) missed cleavages: three; (4) enzyme specificity: chymotrypsin (F, W, Y, L); (5) peptide ion tolerance (average mass): 1.4 Da; (6) fragmentation ion tolerance (average mass): 0.8 Da. The MS1 precursor mass was used for MS2, and the MS2 precursor mass was used for MS3. The MS/MS data was searched against SWISS-PROT Homo sapiens database (Release 2010_10, downloaded on Nov 2, 2010).
Identified partially deglycosylated glycopeptides were quantified using the peak areas from the extracted ion chromatogram (XIC). Peak area integration was performed manually using XCalibur Qual Browser (version 2.1) with the following parameters: (1) precursor peaks were extracted with a 1 Da (±0.5 Da) mass window; (2) scan filter was set as full MS; (3) boxcar averaging with 7 points was enabled; (4) peak detection algorithm was Genesis; (5) signal-over-noise ratio threshold was set at 3.
2.5 Statistical analysis of fucosylation ratios
The fucosylation ratio for each glycosylation site was calculated as:
where AXIC-Fucosylated and AXIC-Non-core-fucosylated are the peak areas of extracted precursor ion chromatograms of core-fucosylated peptide and non-core-fucosylated peptide with the same sequence, respectively.
Four fucosylation ratios were obtained for each sample and log10transformed. Each transformed ratio was compared across samples of different disease states using ANOVA with Prism 5 (GraphPad, La Jolla, CA). Correlation analysis of core-fucosylation patterns between different peptide sequences was performed using R.
2.6 Glycan analysis
Glycan analysis was detailed in previous work.[6] Briefly, peptide N-glycosidase F (PNGase F, New England BioLabs, Ipswich, MA) was used to cleave the N-glycans from the purified A2MG, and the glycans were enriched using porous graphitized carbon tips (Sigma Aldrich, St. Louis, MO). Glycans were permethylated and subjected to MALDI-QIT-TOF MS analysis. The MALDI analysis was performed using sodiated DHB as the matrix (10 mg/mL DHB in ACN/water (50/50), with 10 mM of sodium chloride) at positive ion mode.
3. Results and Discussion
We herein describe an endoglycosidase F assisted label-free LC-MS/MS analysis method to monitor site-specific core-fucosylation level change in A2MG, with the following steps as shown in Figure S1: (1) identification of the partially deglycosylated peptide m/z’s and retention times; (2) peak area integration of the extracted ion chromatogram (XIC) of the partially deglycosylated peptides; (3) calculation of the core-fucosylation ratio for each peptide sequence; (4) comparison of core-fucosylation ratios between samples.
3.1 Selection of enzyme for proteolysis
The non-core-fucosylated and core-fucosylated glycosylation sites were identified based on MS2 or MS3 as described in previous work.[17] In short, MS2 of the peptides with only GlcNAc attached generates fragmentation on the peptide backbone, enabling sequence and glycosylation site identification. MS2 of the peptides with GlcNAc-Fuc attached is dominated by defucosylation, hence a further MS3 on the defucosylated fragment is needed for peptide backbone fragment to achieve sequence and site identification. Digestion schemes using trypsin, chymotrypsin, trypsin/GluC and LysC/GluC were compared to find an optimal method for site identification. Chymotrypsin enabled identification of five glycosylation sites (N396, N410, N869, N991 and N1424), while trypsin/GluC and LysC/GluC both provided three sites and only one site was identified for trypsin (Table 2). Combining all four digestion methods, all eight potential N-glycosylation sites of A2MG were identified. It should be noted that sites N869 and N991 were not observed to have core-fucosylation, suggesting variation in the patterns of core-fucosylation between sites in A2MG. For this study, chymotrypsin was selected due to the number of sites identified.
Table 2.
Glycosylation sites identified with different proteolysis enzymes or enzyme combinations.
| Enzyme | Site | Sequence | Peptide Mass (NF/F) |
|---|---|---|---|
| Trypsin | 55 | GCVLLSYLNETVTVSASLESVR | 867.7/916.2 |
|
| |||
| Chymotrypsin | 991 | VLDYLNETQQL | 770/NA |
| DYLNETQQL | 664.1/NA | ||
|
| |||
| 396 | SNATTDEHGLVQF | 811.4/ 884.6 | |
| YSNATTDEHGLVQF | 893.0/966.0 | ||
|
| |||
| 410 | SINTTNVMGTSL | 720.9/794.0 | |
|
| |||
| 869 | AVTPKSLGNVNF | 725.7/NA | |
|
| |||
| 1424 | LDKVSNQTL | 611.0/684.0 | |
| IYLDKVSNQTL | 749.2/822.2 | ||
|
| |||
| Trypsin/GlucC | 247 | MNVSVCGLYTYGK | 848.2/921.4 |
|
| |||
| 396 | ANYYSNATTDE | 726.3/799.6 | |
|
| |||
| 869 | SLGNVNFTVSAE | 721.1/NA | |
|
| |||
| LysC/GluC | 396 | VIFIRGNEANYYSNATTDE | 1189.5/1262.6 |
|
| |||
| 70 | SVRGNRSLFTDLEAE | 633.5/682.2 | |
|
| |||
| 55 | GCVLLSYLNE | 685.8/758.8 | |
Glycosylation site is labeled as N. F and NF indicate core-fucosylated glycopeptide and non-core-fucosylated glycopeptide respectively. NA indicates that no fucosylated peptide was detected.
3.2 Label-free quantitative analysis
The goal is to monitor the relative glycoform ratio change at each glycosylation site to identify disease-related glycosylation aberrations. For this comparative purpose, semi-quantification methods, such as the label free method based on peak areas of glycopeptide extracted ion chromatograms, was considered appropriate.
While most studies of site-specific glycosylation quantification are performed on intact glycopeptides, the high heterogeneity, low concentration and poor ionization efficiency of individual glycopeptides complicates the LC-MS analysis. Since the glycosylation subtype of interest in this study is core-fucosylation, exoglycosidases and endoglycosidases could be used to remove secondary features. To quantify core-fucosylation, endoglycosidase F was used to leave only core GlcNAc or GlcNAc-Fuc, if there is core-fucosylation, to significantly reduce glycosylation microheterogeneity. This approach has three major advantages compared to intact glycopeptide analysis: (1) the ionization efficiency of partially deglycosylated peptides was significantly increased; (2) the sensitivity of the assay was improved due to the signal stacking effect; (3) data analysis was greatly simplified.
Label-free quantification based on the precursor ion peak intensity has been used in quantification of both the protein abundance and protein post-translational modifications, including glycosylation.[13] The peak areas of ten partially deglycosylated peptides (five pairs, both fucosylated and non-core-fucosylated) from each of the sixty samples (twenty normal control, twenty chronic pancreatitis, and twenty pancreatic cancer) were extracted. A low-resolution instrument could be used in this case because of the low sample complexity due to the effective isolation of a single protein and purification of glycopeptides. Over 90% of partially deglycosylated peptides quantified were identified by database searching. The peak areas of the few unidentified peptides were extracted based on the protein correlation profiling using similarity in both retention time (±1.5 min) and precursor mass (±0.5 Da), which is made possible due to the affinity purification of A2MG.
3.3 Core-fucosylation ratio indices
Fucosylation degree, the relative abundance of fucosylated glycans in a mixture of oligosaccharides, has been used to provide a quantitative description of fucosylation changes of N-glycans in various disease states.[6, 25] In this study, core-fucosylation ratios were obtained for glycopeptides and quantification of site-specific core-fucosylation is reported for the first time. Prior work has quantified only the core-fucosylated peptides, but not the non-core-fucosylated counterparts.[22] Hence, it was unclear if changes occurred in the protein amount or extent of core-fucosylation. The work reported in this study quantifies the frequency of core-fucosylation without being influenced by the underlying protein amount.
It was found that the core-fucosylated and non-core-fucosylated peptides with the same peptide backbone approximately co-eluted (Figure 1) by RPLC probably because the retention behavior was largely determined by the peptide backbone. Among five pairs of deglycosylated peptides detected, the mean absolute differences in retention times of the four pairs of peptides (Figure 1; Panels 1, 2, 4, and 5) were 6 seconds, while the mean absolute difference in retention time for another pair (Panel 3) was larger at 30 seconds. Due to the relatively large difference in the retention time, the fucosylation ratios at site 410 (Panel 3) were excluded from further discussion. It is generally believed that appropriate normalization either by an internal standard or total peak area is needed in the LC-MS label-free quantification. However, such need is eliminated in this study because core-fucosylated and non-core-fucosylated peptides have similar chromatographic behavior and serve as a reference for each other for relative ratio construction.
Figure 1. Extracted ion chromatograms (XIC) of four pairs of partially deglycosylated peptides.
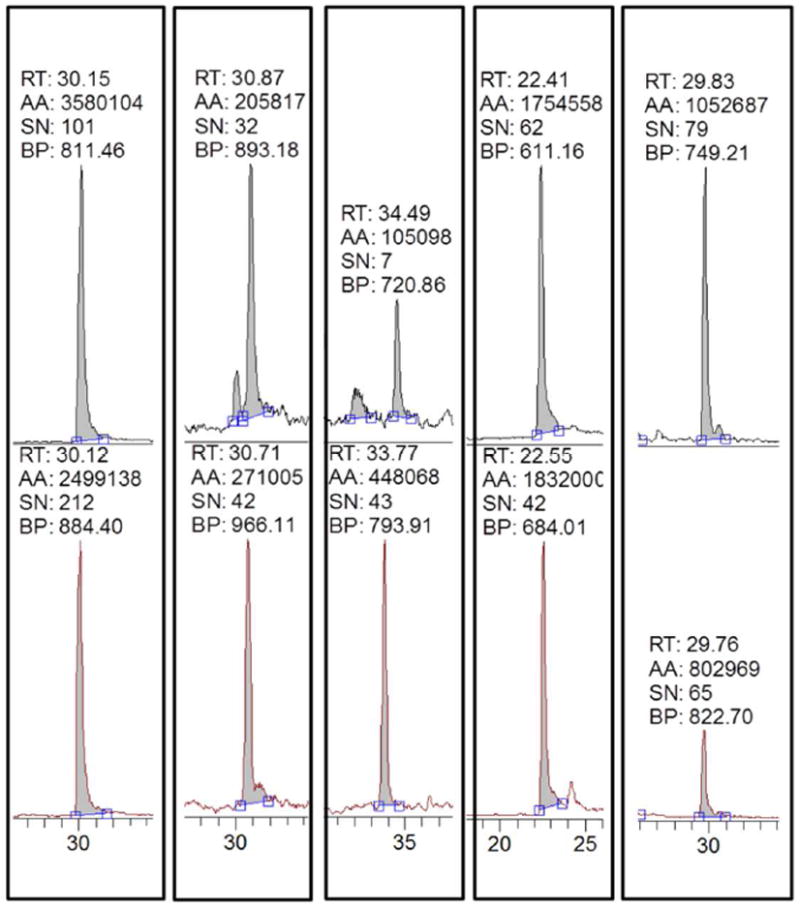
The top panel is the non-core-fucosylated peptide and the bottom is the fucosylated counterpart with the same peptide backbone. (RT: retention time, in mins, AA: peak area, SN: signal over noise ratio, BP: base peak m/z)
It was recently reported that core fucose in intact glycans is vulnerable to in-source loss, resulting in decrease of fucosylation ratio[26]. However, we observed that the core fucose remained stable when the glycan was attached to the peptides. As described above, there was a minor but noticeable retention time difference between the fucosylated and non-fucosylated peptides with the same peptide sequence. If there was significant in-source fragmentation, non-fucosylated peaks at both the retention time of non-fucosylated and fucosylated peptides would have been observed. We did not observe such peak splitting in our study.
Inter-day reproducibility by analyzing four aliquots of the same serum sample were analyzed on different days; a coefficient of variation (CV) less than 11% (Supplementary Table S1) was found. The variation originates from steps including enzymatic digestion, ZIC-HILIC solid phase extraction, LC-MS instrumentation and peak integration. Chymotrypsin generates a reproducible, but overlapping, set of peptides due to its moderate specificity (Table 2). To compare the core-fucosylation degree at a particular site, all corresponding peptide sequences were included. Pearson’s r correlation analysis was performed to evaluate the correlation of core-fucosylation ratios between peptides with the same glycosylation site (N396 and N1424) respectively as shown in Figure 2, and between peptides corresponding to different sites (Figure S1). A Pearson’s r value between 0.5 and 1 indicates positive correlation. The core-fucosylation ratios of peptides containing the same glycosylation site were positively correlated (r~0.8), indicating high internal consistency of the quantification results. With regards to inter-site correlation, fucosylation ratios at N396 and N1424 are also positively correlated, ranging from 0.72 to 0.95 (Figure S1).
Figure 2. Correlation analysis of fucosylation ratios between peptide sequences with the same site.
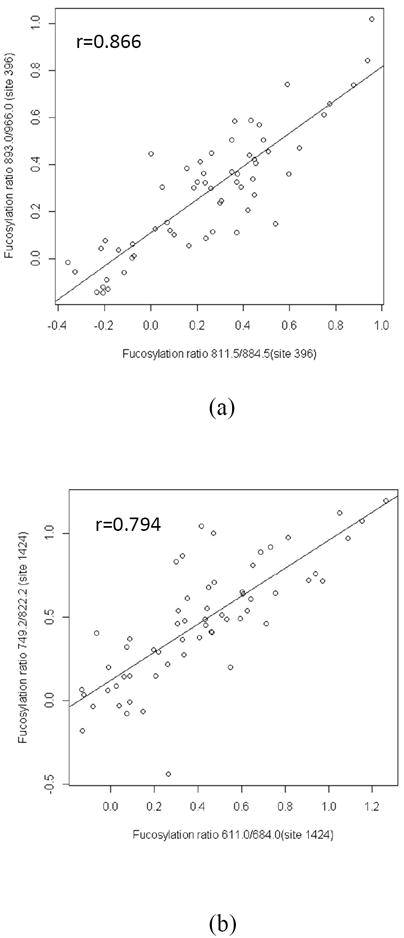
Fucosylation ratios of peptide sequences corresponding to the same site (site 396: m/z 811.5/884.5 and m/z 893.0/966.0 in (a) and site 1424: m/z 611.0/684.0 and m/z 749.2/822.2 in (b)) are positively correlated.
3.4 Statistical analysis
Fucosylation ratios of four pairs of peptides from two glycosylation sites were compared across 60 samples categorized in the three disease states to generate a 4×60 data matrix (Supplementary Table S2). The fucosylation ratios ranged from 0.1 to 20, revealing high diversity in the distribution of core-fucosylation. A log10 transformation was performed to correct the deviation from normality for most populations (Supplementary Tables S3, S4, and S5) except for the population of chronic pancreatitis with peptide sequence YSNATTDEHGLVQF (m/z: 893.0/966.0) due to one extremely low value. This value was considered as an outlier and was removed (Supplementary Table S6).
To compare the fucosylation ratio changes between groups, a one-way ANOVA F-test was applied to compare the means of three different groups (normal, chronic pancreatitis and pancreatic cancer) and multiple comparisons were performed with Tukey’s test. Briefly, the null hypothesis of the F-test is that the three groups involved in comparison have the same mean (not statistically different). F test compares the between-group variance against in-group variance, and the higher the F-value, the stronger the likelihood to reject the null hypothesis, indicating that the difference in the means of three groups is statistically significant. In this study, a p-value (false positive rate) of 5% was used. In conjunction with F-test, Tukey’s test compares all the pairwise means and identifies these pairs with mean differences greater than the standard errors.
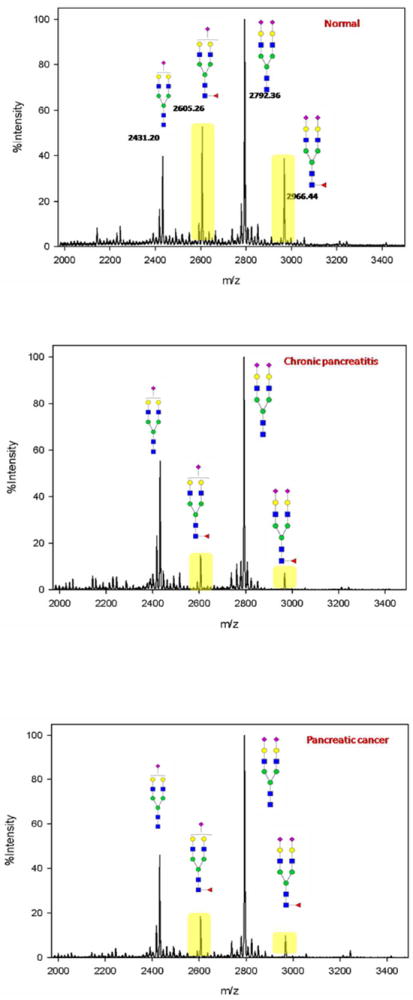
In general, a statistically significant fucosylation decrease was observed in all four pairs of peptides corresponding to two sites (site 396 and 1424) of A2MG in pancreatic diseases (including pancreatic cancer and chronic pancreatitis) compared to normal controls, while the pancreatic cancer and chronic pancreatitis were indistinguishable. Scatterplots in Figure 3 provide a graphical comparison of the transformed fucosylation ratios of the four pairs of peptides, with the brackets showing the statistically significant comparison (p-value<0.05). Core-fucosylation decreases in both chronic pancreatitis and pancreatic cancer at both sites. A decrease of core-fucosylation was also observed in the global A2MG N-glycan level where N-glycans were extracted, permethylated, analyzed using MALDI MS, and compared between normal control, chronic pancreatitis and pancreatic cancer as shown in Figure 4.
Figure 3. Scatterplots of log fucosylation ratios at four peptide sequences from 2 glycosylation sites.
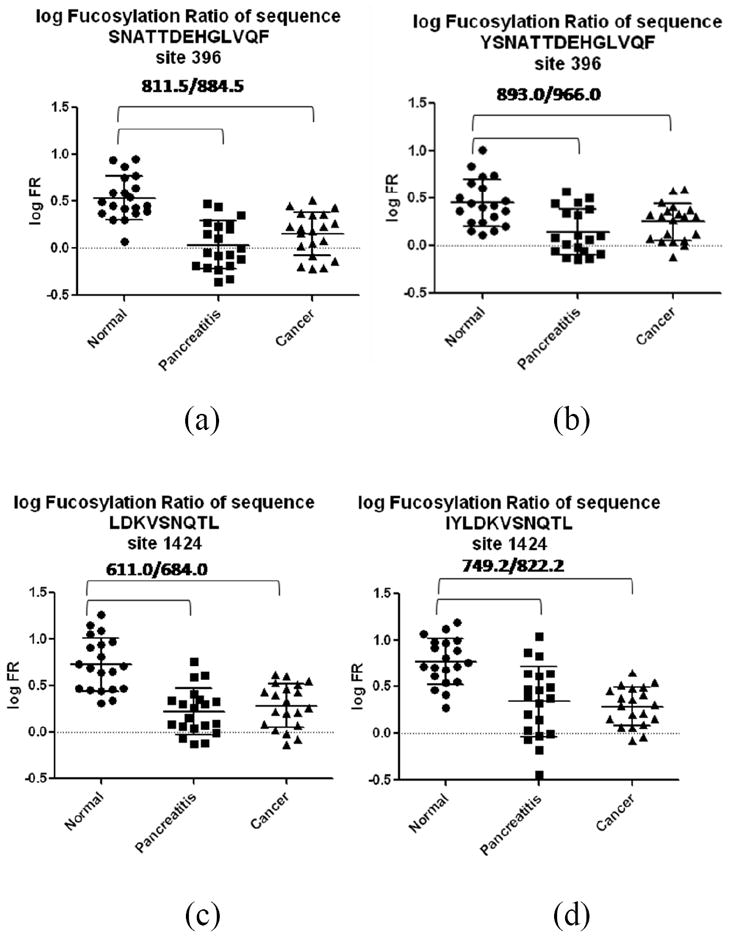
Twenty samples per disease states (normal, chronic pancreatitis and pancreatic cancer) were included in comparison, except in Figure 3(b) where only 19 data points are shown in the pancreatitis group due to removal of an outlier.
Figure 4. Comparison of A2MG N-glycan profiles between normal control (top), chronic pancreatitis (middle) and pancreatic cancer (bottom).
The effect sizes were calculated as follows to quantify the extent of fucosylation decrease:
where and are the means of core-fucosylation ratios at a particular peptide sequence for disease groups involved in comparison, and S is the average standard deviation. As shown in Table 3, alpha-2-macroglobulin shows a 1-2 standard deviation decrease in fucosylation ratio in chronic pancreatitis and pancreatic cancer patients for all the 3 glycosylation sites studied. A2MG core-fucosylation ratios of chronic pancreatitis and pancreatic cancer decrease to anywhere from 6% to 65% of the normal control values.
Table 3.
Statistical summary of core-fucosylation ratios in different disease states.
| Site 396 | Site 396 | Site 1424 | Site 1424 | |
|---|---|---|---|---|
|
| ||||
| 811.5/884.5 | 893.0/996.0 | 611.0/684.0 | 749.2/822.2 | |
| σ(normal) | 0.232 | 0.251 | 0.285 | 0.250 |
| σ(pancreatitis) | 0.253 | 0.242 | 0.248 | 0.383 |
| σ(Cancer) | 0.231 | 0.196 | 0.237 | 0.206 |
| μ(normal) | 0.535 | 0.448 | 0.728 | 0.770 |
| μ(pancreatitis) | 0.034 | 0.145 | 0.286 | 0.341 |
| μ(Cancer) | 0.154 | 0.247 | 0.474 | 0.284 |
| Effect size(N-CP) | 2.069 | 1.233 | 1.656 | 1.354 |
| Effect size(N-C) | 1.576 | 0.922 | 1.047 | 1.648 |
| Percentage(CP/N) | 6.3% | 32.3% | 39.3% | 44.3% |
| Percentage(C/N) | 28.8% | 55.0% | 65.1% | 37.0% |
| Power of ANOVA | 99.9% | 97.5% | 99.9% | 99.9% |
| n(power 90%) | 6 | 14 | 9 | 7 |
N stands for normal controls, CP stands for chronic pancreatitis, PC stands for pancreatic cancer, Percentage CP/N (or PC/N) is calculated as the mean of core-fucosylation ratios of chronic pancreatitis (or pancreatic cancer) divided by the mean of core-fucosylation ratios of normal controls.
Power analysis was performed to justify the sample size used in this study (20 samples per disease state). The power analysis of an ANOVA test involves the following five parameters: sample size, power, statistical significance (false positive rate, which is set at 5%), and the effect size calculated as below.
pi=1/3, μi is the mean of group i, μ is the mean of all groups, and σ2 is the variance.
The statistical powers for all four ANOVA tests of core-fucosylation ratios are higher than 95% as shown in Table 3. Thus, if we fix the significance level at 5%, with a sample size of 20 for each disease state, the probability to detect such an effect size is over 95%. Conversely, we can obtain the number of samples per group to detect a given effect size at a statistical power of 90% and significance level of 5%. As illustrated in Table 3, up to 14 samples per group are required, which provides the statistical support for the number of samples included in our study.
4. Concluding remarks
An endoglycosidase-assisted label-free LC-MS/MS assay for relative quantification of site-specific core-fucosylation was developed and applied to human serum alpha-2-macroglobulin. The strategy described herein was utilized in a preliminary study of alpha-2-macroglobulin core-fucosylation changes in pancreatic diseases, including pancreatic cancer and chronic pancreatitis, wherein core-fucosylation levels were found to be decreased at sites 396 and 1424 in both chronic pancreatitis and pancreatic cancer compared to normal controls. Although pancreatic cancer cannot be distinguished from chronic pancreatitis in this study, this described strategy could be effectively applied to other glycoproteins to monitor the aberration in site-specific core-fucosylation, which may lead to improved pancreatic cancer diagnostics by utilizing a panel of proteins.
Supplementary Material
Acknowledgments
We acknowledge support by the National Cancer Institute grant 1 R01 CA154455 01 (DML), through the SPORE program grant 1 P50CA130810 (SN, DML, MTR), the National Institutes of Health through grant R01 GM49500 (DML), grant 1 R01 CA160254 (DML) and Dr. Kerby Shedden for helpful discussions.
Abbreviations
- A2MG
alpha-2-macroglobulin
- LC-MS
liquid chromatography-mass spectrometry
- GlcNAc
N-acetylglucosamine
- Endo F3
endoglycosidase F3
- NCE
normalized collision energy
- ANOVA
analysis of variances
Footnotes
The authors have declared no conflict of interest.
References
- 1.Ohtsubo K, Marth JD. Cell. 2006;126:855–867. doi: 10.1016/j.cell.2006.08.019. [DOI] [PubMed] [Google Scholar]
- 2.Dwek RA, Butters TD, Platt FM, Zitzmann N. Nat Rev Drug Dicov. 2002;1:65–75. doi: 10.1038/nrd708. [DOI] [PubMed] [Google Scholar]
- 3.Yang Z, Harris LE, Palmer-Toy DE, Hancock WS. Clin Chem. 2006;52:1897–1905. doi: 10.1373/clinchem.2005.065862. [DOI] [PubMed] [Google Scholar]
- 4.Tousi F, Hancock WS, Hincapie M. Analytical Methods. 2011;3:20–32. doi: 10.1039/c0ay00413h. [DOI] [PubMed] [Google Scholar]
- 5.Zhao J, Simeone DM, Heidt D, Anderson MA, Lubman DM. J Proteome Res. 2006;5:1792–1802. doi: 10.1021/pr060034r. [DOI] [PubMed] [Google Scholar]
- 6.Lin ZX, Simeone DM, Anderson MA, Brand RE, Xie XL, Shedden KA, Ruffin MT, Lubman DM. J Proteome Res. 2011;10:2602–2611. doi: 10.1021/pr200102h. [DOI] [PMC free article] [PubMed] [Google Scholar]
- 7.Adamczyk B, Struwe WB, Ercan A, Nigrovic PA, Rudd PM. J Proteome Res. 2013;12:444–454. doi: 10.1021/pr300813h. [DOI] [PubMed] [Google Scholar]
- 8.Barkauskas DA, An HJ, Kronewitter SR, de Leoz ML, Chew HK, de Vere White RW, Leiserowitz GS, Miyamoto S, Lebrilla CB, Rocke DM. Bioinformatics. 2009;25:251–257. doi: 10.1093/bioinformatics/btn610. [DOI] [PMC free article] [PubMed] [Google Scholar]
- 9.Zhang H, Li XJ, Martin DB, Aebersold R. Nat Biotechnol. 2003;21:660–666. doi: 10.1038/nbt827. [DOI] [PubMed] [Google Scholar]
- 10.Zhao J, Qiu W, Simeone DM, Lubman DM. J Proteome Res. 2007;6:1126–1138. doi: 10.1021/pr0604458. [DOI] [PubMed] [Google Scholar]
- 11.Desaire H. Molecular & Cellular Proteomics. 2013;12:893–901. doi: 10.1074/mcp.R112.026567. [DOI] [PMC free article] [PubMed] [Google Scholar]
- 12.Ivancic MM, Gadgil HS, Halsall HB, Treuheit MJ. Anal Biochem. 2010;400:25–32. doi: 10.1016/j.ab.2010.01.026. [DOI] [PubMed] [Google Scholar]
- 13.Ozohanics O, Turiak L, Puerta A, Vekey K, Drahos L. J Chromatogr. 2012;1259:200–212. doi: 10.1016/j.chroma.2012.05.031. [DOI] [PubMed] [Google Scholar]
- 14.Wen CL, Chen KY, Chen CT, Chuang JG, Yang PC, Chow LP. J Proteomics. 2012;75:3963–3976. doi: 10.1016/j.jprot.2012.05.015. [DOI] [PubMed] [Google Scholar]
- 15.Saldova R, Fan Y, Fitzpatrick JM, Watson RWG, Rudd PM. Glycobiology. 2011;21:195–205. doi: 10.1093/glycob/cwq147. [DOI] [PubMed] [Google Scholar]
- 16.Li D, Mallory T, Satomura S. Clin Chim Acta. 2001;313:15–19. doi: 10.1016/s0009-8981(01)00644-1. [DOI] [PubMed] [Google Scholar]
- 17.Lin Z, Lo A, Simeone DM, Ruffin MT, Lubman DM. J Proteomics Bioinform. 2012;5:127–134. doi: 10.4172/jpb.1000224. [DOI] [PMC free article] [PubMed] [Google Scholar]
- 18.Segu ZM, Hussein A, Novotny MV, Mechref Y. J Proteome Res. 2010;9:3598–3607. doi: 10.1021/pr100129n. [DOI] [PubMed] [Google Scholar]
- 19.Zhang W, Wang H, Zhang L, Yao J, Yang PY. Talanta. 2011;85:499–505. doi: 10.1016/j.talanta.2011.04.019. [DOI] [PubMed] [Google Scholar]
- 20.Jia W, Lu Z, Fu Y, Wang HP, Wang LH, Chi H, Yuan ZF, Zheng ZB, Song LN, Han HH, Liang YM, Wang JL, Cai Y, Zhang YK, Deng YL, Ying WT, He SM, Qian XH. Molecular & Cellular Proteomics. 2009;8:913–923. doi: 10.1074/mcp.M800504-MCP200. [DOI] [PMC free article] [PubMed] [Google Scholar]
- 21.Hagglund P, Matthiesen R, Elortza F, Hojrup P, Roepstorff P, Jensen ON, Bunkenborg J. J Proteome Res. 2007;6:3021–3031. doi: 10.1021/pr0700605. [DOI] [PubMed] [Google Scholar]
- 22.Chen R, Wang F, Tan Y, Sun Z, Song C, Ye M, Wang H, Zou H. J Proteomics. 2012;75:1666–1674. doi: 10.1016/j.jprot.2011.12.015. [DOI] [PubMed] [Google Scholar]
- 23.Borth W. FASEB J. 1992;6:3345–3353. doi: 10.1096/fasebj.6.15.1281457. [DOI] [PubMed] [Google Scholar]
- 24.Lindner I, Hemdan NY, Buchold M, Huse K, Bigl M, Oerlecke I, Ricken A, Gaunitz F, Sack U, Naumann A, Hollborn M, Thal D, Gebhardt R, Birkenmeier G. Cancer Res. 2010;70:277–287. doi: 10.1158/0008-5472.CAN-09-1462. [DOI] [PubMed] [Google Scholar]
- 25.Imre T, Kremmer T, Heberger K, Molnar-Szollosi E, Ludanyi K, Pocsfalvi G, Malorni A, Drahos L, Vekey K. J Proteomics. 2008;71:186–197. doi: 10.1016/j.jprot.2008.04.005. [DOI] [PubMed] [Google Scholar]
- 26.Wang Y, Santos M, Guttman A. Journal of separation science. 2013;36:2862–2867. doi: 10.1002/jssc.201300528. [DOI] [PubMed] [Google Scholar]
Associated Data
This section collects any data citations, data availability statements, or supplementary materials included in this article.