

Abstract
Monkeys were trained to select one of three targets by matching in color or matching in shape to a sample. Because the matching rule frequently changed and there were no cues for the currently relevant rule, monkeys had to maintain the relevant rule in working memory to select the correct target. We found that monkeys' error commission was not limited to the period after the rule change and occasionally occurred even after several consecutive correct trials, indicating that the task was cognitively demanding. In trials immediately after such error trials, monkeys' speed of selecting targets was slower. Additionally, in trials following consecutive correct trials, the monkeys' target selections for erroneous responses were slower than those for correct responses. We further found evidence for the involvement of the cortex in the anterior cingulate sulcus (ACCs) in these error-related behavioral modulations. First, ACCs cell activity differed between after-error and after-correct trials. In another group of ACCs cells, the activity differed depending on whether the monkeys were making a correct or erroneous decision in target selection. Second, bilateral ACCs lesions significantly abolished the response slowing both in after-error trials and in error trials. The error likelihood in after-error trials could be inferred by the error feedback in the previous trial, whereas the likelihood of erroneous responses after consecutive correct trials could be monitored only internally. These results suggest that ACCs represent both context-dependent and internally detected error likelihoods and promote modes of response selections in situations that involve these two types of error likelihood.
Keywords: cognitive control, error, lesion, prefrontal cortex, response selection, response time
Introduction
The cortex in and around the anterior cingulate sulcus, which we hereby refer to as ACC, is known as the source of the error-related negativity that occurs when participants first notice that an ongoing action is erroneous (Gemba et al., 1986; Falkenstein et al., 1990; Gehring et al., 1993; Dehaene et al., 1994). Even in correct trials, ACC is activated when participants face conflict between responses (Pardo et al., 1990; Carter et al., 1998; Botvinick et al., 1999). Later studies showed that ACC is generally activated when participants realize that error likelihood (Brown and Braver, 2005) or uncertainty about the environment (Behrens et al., 2007) is higher. These studies suggest that ACC is important for monitoring uncertainty in action selection.
However, ACC might be more directly involved in cognitive control of action selection (Shallice et al., 1989; Paus, 2001; Oliveira et al., 2007). In changing environments, uncertainty arises about the value of potential actions due to alterations in action-reward contingencies. Indeed, ACC-lesioned monkeys exhibited deficits in reward-based action selection when the action-reward contingency was frequently reversed (Kennerley et al., 2006). Cells in ACC showed strong activities when the monkeys were determining the correct sequence to touch three targets by trial and error (Procyk et al., 2000) or when selecting appropriate actions based on recent action-outcome contingencies (Matsumoto et al., 2003). Therefore, ACC might have a crucial role in enhancing action selection under uncertainty (Mansouri et al., 2009).
Here we examined the possibility that ACC contributes to cognitive control of rule-based action selection under conditions of high uncertainty. We combined lesion-behavioral and cell-recording experiments in a cognitively demanding task, a version of Wisconsin Card Sorting Test (WCST) (Mansouri and Tanaka, 2002; Mansouri et al., 2006, 2007; Buckley et al., 2009). In this task, macaque monkeys selected one of three test items based on which one of two abstract matching rules was currently reinforced. Because the frequent rule changes were not cued, the monkeys had to discover the rule by trial and error and then maintain it in working memory across trials, which was cognitively demanding. Activation of ACC has been seen in a wide range of cognitively demanding tasks (e.g., Corbetta et al., 1991).
Even after months of training, monkeys made occasional errors amid successive correct responses and the performance on the first trial immediately after these errors recovered only to chance level. We found that intact monkeys' speed of target selection was modulated by both the recent response history (i.e., after an error trial vs after successive correct trials) and the nature of upcoming response (i.e., erroneous vs correct). However, these behavioral modulations were abolished after bilateral lesions of the cortex in the anterior cingulate sulcus (ACCs). We also found that groups of ACCs neurons showed activity modulations correlated with these behavioral modulations. We suggest that ACCs monitors the internal state of information processing as well as the response type (correct/error) history to represent the error likelihood and consequently engages executive control processes to optimize action selection in uncertain conditions.
Materials and Methods
The experimental plan was approved by the Experimental Animal Committee of RIKEN, and all animal training, surgery, and experimental procedures were conducted in accordance with the guidelines of the Japan Neuroscience Society. All the procedures in the part of lesion-behavioral experiments conducted in Oxford were licensed in compliance with the United Kingdom Animals (Scientific Procedures) Act, 1986. We used 15 adult male macaque monkeys (Macaca fuscata and M. mulatta). We also partly refer to the results obtained with other eight adult male macaque monkeys (M. fuscata and M. mulatta) used in other projects.
Task
Main task in lesion-behavioral experiments.
The task was a computerized version of 2D WCST (Mansouri and Tanaka, 2002; Buckley et al., 2009), in which the monkey matched a sample with one of three test items according to either color or shape. The monkey was placed in a test cage and worked on a touch screen monitor placed in front of the cage. We used 36 stimuli composed of all the possible combinations of six colors and six simple geometrical shapes. The sample and test items were randomly selected from the 36 stimuli, with the constraints described below. The positions of each of the three test items were also randomly determined between the three possible slots. The size of the stimuli was 5–6 cm on the monitor, and the center-to-center distance between the items was 15 cm.
A trial started when a sample appeared at the center of the monitor. When the monkey touched it, three test items were added to the left, bottom, and right of the sample. In the main task, one of the test items matched the sample in color, a second one in shape, and the third one did not match the sample in either color or shape. The monkey had to touch, within 5 s, the correct test item that matched the sample either in color or in shape depending on the currently reinforced rule. The matching rule was consistent across trials, but whenever the monkey reached 85% correct in 20 consecutive trials, the rule changed. A set of consecutive trials with one rule is referred to as a block of trials, or simply block, in this paper. Trials in which the monkey made time-out errors were not included in the rule-change criterion and were rare. The currently relevant rule and rule changes were never cued. A correct response was immediately rewarded with a food pellet and then a 6 s intertrial interval (ITI) started. After an erroneous response, a visual error signal (a large white circle for 1 s) was presented and then a 12 s ITI started. There were no correction trials (repeating the same condition until the monkey made a correct response). Each daily session was comprised of 300 trials.
Second task in lesion-behavioral experiments.
The task was modified in a second (varying conflict level) version such that there were trials with two different levels of response conflict (Mansouri et al., 2006, 2007). High-conflict trials were identical to the trials in the main task. In low-conflict trials, one of the three test items matched the sample both in color and shape (i.e., it was identical to the sample). The other two test items did not match the sample either in color or in shape. High- and low-conflict trials were randomly intermingled with each other and provided in the same mean frequency.
In low-conflict trials, the correct response could be found based on the identity of object, rather than by applying a color- or shape-matching rule. The monkeys might use an identity-matching strategy in low-conflict trials, and a difference in the monkeys' behavior between low-conflict and high-conflict trials might reflect a difference in strategy, rather than a difference in conflict level. However, in the version of WCST used in the present study, high-conflict trials were randomly intermingled with low-conflict trials, and there was no cue for the currently relevant rule; therefore, the monkeys had to maintain the relevant rule across trials, in working memory, to respond correctly in high-conflict trials. If the monkeys had used an identity-matching strategy in low-conflict trials, the working memory of the relevant rule should nonetheless have been maintained for upcoming high-conflict trials while the monkeys performed the unrelated strategy of identity matching in low-conflict trials. We tested the fragility of the working memory of the relevant rule in two modified versions of the WCST analog. First, when the monkey's performance reached 85% for a particular rule, we asked the monkey to perform two trials of a face-detection task (select a face from two stimuli presented side by side) and then return to WCST and continue with the same rule that was relevant before the interruption. In the first WCST trial after the interruption, the monkey's performance dropped to chance level (unpublished observation). Second, in another version of WCST, when the monkey's performance reached 85% by a rule, we gave a free reward (two food pellets) during the usual ITI and then allowed it to continue WCST with the same rule that was relevant before the interruption. In the first WCST trial after the free-reward, the monkey's performance dropped to chance level (unpublished observation). Both results indicated that the maintenance of the currently relevant rule was disrupted by performing an additional task or by a free reward. Given this fragility of rule working memory, the performance in high-conflict trials following a low-conflict trial should have been close to chance level if the monkeys had implemented another strategy to perform low-conflict trials. However, the percentage of correct responses in such high-conflict trials was very high in later parts of individual blocks. The fragility of rule working memory and the high performance in high-conflict trials following a low-conflict trial, together, suggest that the monkeys consistently used the working memory of the relevant rule in low-conflict as well as in high-conflict trials.
Task in cell-recording experiments.
The version of the WCST task used in cell-recording experiments was similar to that used in lesion-behavioral experiments, but with a few differences. (1) To facilitate eye-gaze recording and neuronal recording, the monkey was placed in a monkey chair with its head fixated using a titanium block implanted on the skull. (2) Pressing a lever to initiate trials and fixating the gaze during the trial were requirements during key phases of the trial. (3) The monkey did not touch the sample to reveal the test items; instead, the test items automatically appeared with a delay after the sample onset. (4) An interval (see below) was inserted between the monkey's test item touch and feedback onset. (5) We used four fixed test item arrangements.
Each trial commenced with the presentation of a start cue (a big gray disk). When the monkey pressed a lever, the start cue was replaced with a fixation spot (0.9° square). If the monkey continued pressing the lever and fixating the gaze to the fixation spot (within ±3–4°) for 731 ms, a stimulus was added to the fixation spot as the sample. If the monkey further continued lever pressing and gaze fixation for 564 ms, the test items were added to the screen. The monkey had to touch the correct test item within 5 s. After an 802 ms delay from the first touch, a drop of juice was provided when the response was correct and a visual error signal (a big magenta ring) was presented for 300 ms when the response was wrong. The sample and test items remained on the monitor during the delay from touch to feedback. The ITI, which is defined here as the time of reward or error signal onset to the start-cue onset in the next trial, was 2725 ms after both correct and erroneous responses. The monkey had to release the lever before the start of next trial. The criterion for rule changes was the same as that in the lesion-behavioral experiments (i.e., 85% correct in 20 consecutive trials). Trials in which the monkey made errors in gaze fixation or bar release or time-out were not included in calculation of the rule change criterion.
The monitor was placed 29.5 cm from the eyes, and the stimulus size was 3.8°–5.5°. We used four fixed test item arrangements in the recording experiments. Each of the four fixed test item arrangements included three different colors and three different shapes, and it was presented in combination with the samples composed of these colors and shapes. The four arrangements as a whole covered all six colors and six shapes. We did not use samples identical to any of the test items; therefore, six stimuli for each test item arrangement, 24 stimuli altogether, were used as samples.
The test items were presented 18.5° to the left, 14.8° below, and 18.5° to the right of the sample for Monkey R2. One test item was presented 14.8° below and 18.5° to right of the sample (instead of to the left of the sample) for Monkey R1 because this monkey used the right hand for touching the target on the screen and had previously shown a selection bias against the left position.
The task was controlled by CORTEX, and the gaze position was monitored by an infrared system (i_rec; http://staff.aist.go.jp/k.matsuda/eye/). The monkeys performed the task for 30–70 min in each daily session.
Procedures of lesion-behavioral experiments
Thirteen monkeys (M. fuscata and M. mulatta) were trained for the WCST analog. The training started with familiarization to the apparatus and went through a series of phases, including delayed matching to sample task, elimination of the delay, matching only in color or shape, introduction of conflict, and introduction of rule changes within a daily session. The prelesion data were taken only in the main task composed exclusively of high-conflict trials in the last 15 consecutive daily sessions before surgery. The four monkeys in the ACCs lesion group received bilateral lesions of anterior cingulate cortex limited to all cortex in both the upper and lower banks of the anterior cingulate sulcus and excluding cortex in the gyrus, after which they took a rest for 2–3 weeks. The four ACCs-lesioned monkeys had been used in the study partly published by Mansouri et al. (2007) and Buckley et al. (2009). The nine monkeys in the intact group simply took a rest of a comparable period. In the postlesion tests, the monkeys were again tested in the main task for 15 consecutive daily sessions. They were then exposed to low-conflict trials for a few days, after which data were collected during the task having both high- and low-conflict trials for eight daily sessions. Six of the intact monkeys had been used in the study partly published by Mansouri et al. (2007) and Buckley et al. (2009) and the remaining three in another unpublished study.
Lesion surgery.
The operations were performed in sterile conditions with the aid of an operating microscope. The monkeys were first sedated with both ketamine (10 mg/kg i.m.) and xylazine (0.25–0.5 mg/kg i.m.), intubated, and then artificially respirated and anesthetized throughout surgery with isoflurane (1.0–2.0% to effect). Steroids (methyl-prednisolone, 20 mg/kg) were given the night before surgery intramuscularly, and three doses were given 4–6 h apart (i.v. or i.m.) on the day of surgery to protect against intraoperative edema and postoperative inflammation. The monkey was given atropine (0.05 mg/kg) to reduce secretions, antibiotic (amoxicillin, 8.75 mg/kg) for prophylaxis of infection, opioid (buprenorphine 0.01 mg/kg i.v., repeated twice at 4 to 6 h intervals on the day of surgery, i.v. or i.m.) and nonsteroidal anti-inflammatory (meloxicam, 0.2 mg/kg i.v.) agents for analgesia, and an H2 receptor antagonist (ranitidine, 1 mg/kg i.v.) to protect against gastric ulceration as a side effect of the combination of steroid and nonsteroidal anti-inflammatory treatment. Heart rate, oxygen saturation of hemoglobin, end-tidal CO2, body temperature, and respiration rate were monitored continuously throughout surgery. The arterial blood pressure was monitored every 5 min.
A bone flap was raised to expose the dorsal surface of the brain; the dura mater was cut and retracted, and veins draining into the sagittal sinus were cauterized and cut. A hemisphere was carefully retracted from the falx and a small-gauge metal aspirator was used to aspirate the cortex within the dorsal and ventral banks of the anterior cingulate sulcus (areas 24c, 24c′) in that hemisphere. The falx was then sectioned to expose the same region in the other hemisphere, which was ablated in a similar manner. The caudal limit of the lesion in the cingulate sulcus was at the level of the midpoint of the precentral dimple, and the lesion extended rostrally for the full extent of the cingulate sulcus. The dura mater was then sewn back, the bone flap replaced, and the wound closed in layers.
Lesions in other cortical areas.
To examine how the effects of ACCs lesions on monkeys' behavioral modulations are specific to ACCs, we have analyzed effects of bilateral lesions to the cortex in the principal sulcus (PS, n = 4), to the superior dorsolateral part of the prefrontal cortex (sdlPFC, n = 3), to area 10 located at the frontal pole (FPC, n = 4), to the posterior cingulate cortex (PCC, n = 3), and to the premotor cortex (preM, n = 2) on RT modulations depending on the response-type history or the response type in the current trial. The experimental procedures for these lesion experiments were identical to those for the ACCs-lesioned monkeys. The 4 PS-lesioned monkeys, which had been used in the study partly published by Mansouri et al. (2007) and Buckley et al. (2009), and the 4 FPC-lesioned monkeys were different from the 15 monkeys used in the main part of this paper. The three sdlPFC-lesioned and three PCC-lesioned monkeys had been used in the main part as intact monkeys before prelesion data for these lesion experiments were taken. The bilateral lesions to the premotor cortex were made, as the second surgery, on the PCC-lesioned monkeys, which did not show any significant differences from intact monkeys.
Cell-recording experiments
Two other macaque monkeys (M. fuscata) were trained to perform the version of WCST analog designed specifically for the cell-recording study. They were first trained without head fixation and gaze control. After a titanium block for head fixation was implanted to the dorsocaudal aspect of the skull in a preparatory surgery, the training continued with the head fixed and the gaze fixation requirement in place. A titanium chamber for cell recordings was fixed to the dorsal surface of the skull, and the bone above the recoding site was removed in a second preparatory surgery, and then cell recordings started. The preparatory surgeries were conducted in sterile conditions under anesthesia with sodium pentobarbital (35 mg/kg followed by 10 mg/kg when necessary) or with isoflurane (1.0%–2.0%). MRI of the brain was taken before the first preparatory surgery to determine the location of cell recordings. In the surgeries, the monkey's head was fixed in a stereotaxic frame (Narishige) to place the chamber at an appropriate position.
Recordings were made from the dorsal bank of the anterior cingulate sulcus (A35, 35 mm anterior to the ear bar position, to A41 in Monkey R1 and from A35 to A42 in Monkey R2) in the left hemisphere. Glass-coated tungsten microelectrodes (α ω) were advanced by oil-drive manipulator (MO-81; Narishige) with stainless steel guide tubes, which were held in a grid placed in the chamber. We simultaneously inserted four electrodes with four independent manipulators. The recording chamber was filled with saline during recordings. Extracellularly recorded action potentials were amplified and isolated with a MAP system (Plexon). Signals were monitored during recordings, but the final isolation of cell activities was done off-line. After electrodes were advanced to the recording positions, we waited for 20–40 min before starting data acquisition to obtain good stability. We did not introduce bias in cell sampling apart from avoiding the cells with very low firing rate.
Data analyses
We focused on trials in which the monkey selected the test item based on the currently relevant rule (correct trials) or the item that matched the sample according to the currently irrelevant rule (error trials). Trials in which the monkey made other types of errors were excluded from the analyses unless otherwise described. The proportion of trials in which the monkey selected the test item that did not match the sample either in color or in shape was 2.0 ± 2.0% (mean ± SD across monkeys, including the monkeys used in lesion-behavioral and cell-recording experiments). The proportion of errors in bar release, gaze fixation, and time-out in the cell-recording experiments was in total 9.6% in Monkey R1 and 16.0% in Monkey R2. To focus on phenomena in the main parts of individual blocks, we excluded the initial trials after rule changes until the monkeys had made the first two consecutive correct responses in each block, unless otherwise noted.
The following notations are used in this paper to indicate different trial sequences. C and c represent correct trials, and E and e represent error trials. C or E (uppercase) indicates the trial in which the response time of the monkey or cell activities were analyzed, whereas c and e (lowercase) indicate the monkey's response that belonged to the context of the analyzed response. For example, cC is a correct trial following a correct trial; eccC is a correct trial following a sequence of an error and then two consecutive correct trials. The initial trials after rule changes until the monkeys had made the first two consecutive correct responses in each block were not included in the context parts of trial sequences, either.
Analyses of monkeys' response time (RT).
We analyzed the monkey's RT, which was defined in this paper as the duration from the onset of test items to the first touch of the monkey on the monitor. To remove its variations among daily sessions and blocks, we routinely subtracted the mean RT averaged over all cC trials in the block (block mean) from RTs in individual trials. We also calculated the mean RT averaged over all cC trials in the daily session (day mean), the mean RT averaged, in the daily session, over all cC trials in each of the three response directions (direction mean), and the mean RT averaged, in the daily session, over samples belonging to each of four sample groups (sample-group mean) for later processing. The sample groups used to obtain the sample-group means were made by dividing sample stimuli into four quarters according to the percentage of correct responses calculated for individual samples. The grouping was made separately in each monkey, separately for shape- and color-rule blocks (for both lesion and recording experiments), and separately for prelesion and postlesion tests (for lesion experiments only).
To examine effects of the error likelihood component determined by the response-type history, we first subtracted differences of the direction mean and sample-group mean from the day mean (direction mean − day mean, and sample-group mean − day mean) from RTs in individual trials to remove variations among the response directions and the sample groups. We then compared the RT averaged for eC trials with the RT averaged for eciC trials immediately after the percentage of correct responses (%C) recovered by >20% from that in trials immediately after an error trial (ci means “i” times of correct trials). The “i” that matched this condition ranged from 1 to 6 among monkeys. i, rather than n, was used in the notation for this analysis, as “i” was determined in each monkey referring to the recovery of %C in that monkey.
RTs in individual trials were not recorded in the prelesion sessions for two of the four monkeys that later received ACCs lesions and for three of the nine monkeys in the intact group. Only the mean RTs averaged over all correct trials and over all error trials in each session were recorded in these five monkeys. However, the difference between the median RT in eC trials and the median RT in ecnC trials (with n of 1–6) was highly correlated, across monkeys, with the difference between the mean RT over all correct trials and the RT over all error trials, in prelesion data of 17 intact monkeys (r = 0.91–0.93, p < 0.00010), in which RTs in individual trials were recorded in prelesion sessions. We therefore estimated the prelesion difference in median RTs between eC and ecnC trials of the five monkeys from their prelesion difference in mean RTs between all error and correct trials.
Effects of the response type in the current trial were analyzed by comparing RTs between ccE and ccC trials, after differences of the direction mean and sample-group mean from the day mean (direction mean − day mean, and sample-group mean − day mean) were subtracted from RTs in individual trials. We put two consecutive correct trials in the context part of trial sequences, so that effects of the response types in earlier trials became insignificant (see Results). Effects of the error likelihood component determined by the sample in the current trial were analyzed by calculating the correlation between the mean RT and %C across samples in ccC trials after the direction mean was subtracted from RTs in individual trials.
When a difference in RT between two trial conditions (e.g., eC trials vs eciC trials) was examined for the consistency across monkeys within a monkey group, or when it was compared between two monkey groups, we determined a median RT for each of the two conditions in each monkey and conducted statistical tests based on the median RTs. Medians, rather than means, were used because distributions of RTs in each monkey were clearly distorted from the normal distribution. When two-sample t test was used for the median-based statistics, we first tested the two samples for equal variance with an F test, and we used a Welch two-sample t test if F > F(0.050) and an ordinary two-sample t test if F ≤ F(0.050). We will describe the F ratio, t value, and p value for each case. When RTs in individual trials were compared between two trial conditions within each monkey, we used a Mann–Whitney test because of the non-normality of the RT distribution. p values <0.00010 were just noted as p < 0.00010.
Analyses of cell activities.
We used one wide time window and four narrower time windows. The wide window, which we will refer to as the postfeedback window, started at the feedback onset and lasted for 1600 ms. The narrower windows, which we will refer to as Epochs 1–4, were all 800 ms long. Epoch 1 started at 1400 ms before the fixation start (late ITI period), Epoch 2 started at the fixation start (covering mostly the fixation-only period), Epoch 3 started at 150 ms after the sample onset (covering mostly the decision-making period), and Epoch 4 started at the monkey's touch (covering the period in which the monkey was waiting for the feedback). Epochs 1–4 were all located before the feedback onset.
We first calculated the mean firing rate, for individual trials, in each of the relevant time windows. Then, to remove slow changes in activities across blocks, we calculated mean activities in each window averaged over all cC trials in the block (block mean) and subtracted the block mean from activities in individual trials. This preprocessing was not applied when the modulation by the currently relevant matching rule was analyzed. We also calculated, in each window, mean activities averaged over all cC trials in the daily session (day mean), mean activities averaged over all cC trials with each of the three response directions (direction mean), and mean activities averaged over all cC trials with samples belonging to each of the four sample groups (sample-group mean) for later processing (described in the following three paragraphs). The sample groups used to obtain the sample-group means were determined by dividing samples into four groups according to the averaged percentage of correct responses in each monkey, separately for shape-rule blocks and color-rule blocks, but otherwise based on the whole data obtained in all recording sessions.
Modulation by the response-type history or by the response type in the current trial was examined for activities in Epochs 1–4. Differences of the direction mean and sample-group mean from the day mean (direction mean − day mean, or sample-group mean − day mean) were subtracted from activities in individual trials to remove the variations among the response directions and the sample groups. After the compensation for the RT difference (see below in this section), the activities were compared between eC and ccC trials to examine the modulation by the response-type history and between ccE and ccC trials for the effects of the response type in the current trial by using a two-way ANOVA (with the trial sequence as a between-subject factor and the epoch as a within-subject factor). The reasons to select these combinations of trial sequences are described in Results. The direction of difference was determined based on mean activities averaged over the four epochs. When we determined the number of epochs in which each cell showed significant activity modulation in a consistent difference direction, we used a one-tailed t test by assuming the difference direction determined by the averaged activities. The threshold of p value was lowered to 0.0125 to compensate the multiple comparison in four epochs.
Modulation by the error likelihood component determined by the sample in the current trial was examined by calculating the correlation between the mean activities in Epoch 3 or 4 of ccC trials averaged for each sample and the %C for the sample, after a difference of the direction mean from the day mean was subtracted from the activities and the correction for RT differences was made. Cells with significant correlation were determined with p < 0.025 for each epoch, and those with significant correlation either in Epoch 3 or Epoch 4 are reported.
Modulation by the response direction in the current trial was examined by applying a nested ANOVA (with the sample nested under the response direction, both as between-subject factors, and the epoch as a within-subject factor) to activities in Epochs 3 and 4 of ccC trials, after the correction for the RT difference. Significant dependence on response direction was determined by contrasting the variance among the response directions to the variance among the samples.
Because RTs varied among different response type histories, between correct and error trials, and among trials of the same response-type history and response type in the current trial, an analysis of cell activities with a time window locked to the test items onset or to the monkey's touch might have produced a pseudo-dependency of cell activities on the monkey's response type (correct/erroneous) by truncating rising or falling activities locked to one event by the window locked to another event. To exclude such effects, we first examined the correlation between cell activities and RTs, after subtracting the difference in mean values among different conditions that were the target of the analysis for both cell activities and RTs. If there was a significant correlation (p < 0.10), we calculated the slope of the linear regression line and subtracted RT-dependent components of cell activities from the original (before the condition mean subtraction) values of cell activities in individual error and correct trials. This correction was conducted separately for each window and applied to the analyses with Epochs 3 and 4.
Effects of the currently relevant rule were analyzed in 274 cells for which activities were recorded in no less than six complete blocks. Activities in Epochs 1–4 of ccC trials were used. Differences of the direction mean and sample-group mean from the day mean were subtracted from activities in individual trials. To remove slow changes in activities, we calculated the local mean activities by averaging the mean activities in cC trials in the previous, current, and subsequent blocks with weights of 0.25:0.5:0.25 and subtracted the local mean from activities in individual trials. The activities in the first and last complete blocks were used for the calculation of the local mean, but not for the final examination of the rule dependence. We also removed possible effects of overall differences in RT between color and shape blocks. Possible correlation between cell activities and RTs and that between RTs and relevant rule might have resulted in a pseudo-correlation between cell activities and relevant rule. To exclude such effects, we first examined the correlation between cell activities and RTs, after subtracting the difference between mean value in shape blocks and that in color blocks from values in individual trials for both cell activities and RTs. If there was significant correlation (p < 0.10), we calculated the slope of the linear regression line and subtracted RT-dependent components of cell activities from the original values of cell activities in individual trials. Seventy-six cells that showed significant block-to-block changes among the blocks of the same rule after all these corrections (one-way ANOVA, p < 0.050 for color or shape blocks) were excluded. Finally, a two-way ANOVA (the rule as a between-subject factor and the epoch as a within-subject factor) was applied to the activities in Epochs 1–4 together, and a two-tailed t test was applied to the activities in each epoch separately.
Responses to the feedback (the juice reward or visual error signal) were evaluated by calculating a difference of the mean firing rate in the postfeedback window from that in the epoch immediately before the feedback onset (Epoch 4) in individual trials. The day mean, block mean, direction mean, and sample-group mean of the responses were then calculated, and the block mean and differences of the direction mean and sample-group mean from the day mean were subtracted from the responses in individual trials. Finally, the responses were compared between ccE and ccC trials.
Results
To examine cognitive control functions of the cortex in the anterior cingulate sulcus (ACCs), we conducted complementary lesion-behavioral and single-cell-recording experiments with a version of the WCST analog as the behavioral task. In the WCST analog (Fig. 1A), a sample stimulus first appeared and then three test items were added surrounding the sample. One of the test items matched the sample in color, a second one matched it in shape, and the third one matched it in neither color nor shape. The monkey then had to touch one of the test items by matching in color or matching in shape with the sample to get a reward. The matching rule was consistent across trials, but whenever the monkey reached 85% correct (17 of 20 consecutive trials), the rule changed.
Figure 1.
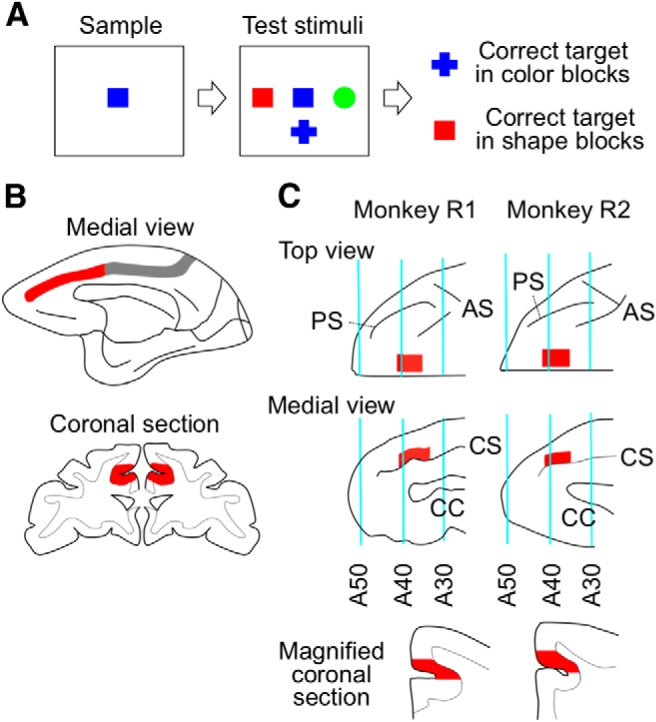
Task, lesion extent, and recording regions. A, Events in a trial of WCST analog. A sample was first presented, and then three test items were added. The monkeys had to select one of the test items that matched the sample in color or in shape depending on the currently relevant rule. The matching rule was consistent across trials within a block but changed whenever the monkey reached 85% correct in the last 20 trials. B, The extent of ACCs lesions (red). Gray represents the intact part of the cortex within the cingulate sulcus. C, The site of cell recordings (red). The coronal sections at the bottom were taken from A37. CS, Cingulate sulcus; AS, arcuate sulcus; CC, corpus callosum.
We found in a previous study that the overall performance of monkeys in the WCST analog, measured by the number of rule changes per daily session (with fixed 300 trials per session), decreased after ACCs lesions (Fig. 1B) (Buckley et al., 2009). Here we further analyzed the behavior, particularly the response time, of the intact and ACCs-lesioned monkeys, including three more intact monkeys.
Percentage of correct responses in trials following an error trial
The %C depended on the success or failure in recent past trials. Figure 2A plots the %C in trials following a trial sequence of ecn (an error trial followed by consecutive correct trials) in the postlesion tests. The %C was ∼50% in trials immediately following an error trial (i.e., n = 0; Fig. 2A). Although there were three test items, because the monkeys rarely selected the item that did not match the sample in either color or shape, the practical chance level was 50%, rather than 33%. Thus, the performance in trials immediately following an error trial was around chance level. This occurred regardless of the success/failure experiences in trials previous to the error trial: in intact monkeys as the group (grand averages in individual monkeys as data points), the %C after een was not significantly different from the %C after cen (p > 0.82 for each of n = 1–3, two-tailed t test; Fig. 2B).
Figure 2.

%C in trials following an error trial. A, %C, averaged over nine intact monkeys (solid line) and over four ACCs-lesioned monkeys (broken line) in trials after a trial sequence of ecn (an error trial and then n times of correct trials). B, Difference in %C, averaged over the intact monkeys (solid line) and over the ACCs-lesioned monkeys (broken line), between trials after a trial sequence of cen and those after a trial sequence of een. Shading represents SEM across monkeys.
The %C in trials following an error trial was around chance level even immediately after rule change. Approximately 90% of the responses in the first trials after rule changes were erroneous. This was expected as there was no cue to indicate the rule change, and so the monkeys continued to apply the matching rule that was relevant in the previous block. When the response in the first trial after the rule change was erroneous, the %C in the second trial after rule change averaged 49% in intact monkeys. The %C in trials following an error trial slightly increased toward the end of block, yet even in the period from the 16th to the 20th trial after rule changes, the %C after an error trial was 53% in the intact monkeys. These results suggest that, in the WCST analog, the monkeys' choice behavior was mainly influenced by the immediately preceding trials. Nevertheless, to exclude the possible processes occurring immediately after rule changes, we removed the trials after rule changes from analyses until the monkeys made two consecutive correct responses.
The %C rapidly increased as the monkey made correct responses and reached ∼90% after two consecutive correct trials (n = 2) in intact monkeys (Fig. 2A, solid line). These results suggest that the monkeys accumulated knowledge across consecutive successful experiences and thereby achieved higher performance in the following trials. After the ACCs lesions, this process of recovery after an error trial, or learning from successive correct trials, became less efficient: the %C increased more slowly and remained ∼85% even after five or six successive correct trials (Fig. 2A, broken line). The prelesion values of both groups were very similar to the postlesion values of the intact monkeys, so we show only the postlesion results in Figure 2A for simplicity. The ACCs lesions significantly reduced the speed of recovery: a significant interaction (F(3,32) = 3.16, p = 0.038) was obtained when a two-way ANOVA (with monkey group [intact/ACCs-lesioned] as a between-subject factor and n as a within-subject factor) was applied to pre-post %C differences in individual monkeys from n = 0 to 3.
Figure 2A also shows that the ACCs-lesioned monkeys continued to make occasional erroneous responses even after several consecutive correct trials. A two-way ANOVA (monkey group as a between-subject factor and n as a within-subject factor) applied to pre-post %C differences in individual monkeys from n = 4 to 6 showed significant main effects of monkey group (F(1,12) = 9.60, p = 0.0092) without a significant interaction between monkey group and n (F(2,21) = 3.06, p = 0.068).
In addition to the degradation in the process of recovering from an error trial, ACCs lesions degraded the function of a single error experience to reset the previous response-type history. In the ACCs-lesioned monkeys, the %C after a trial sequence starting with a correct trial remained slightly higher than that after a trial sequence starting with an error trial even with one to three error trials between the first and current trials (t(3) = 6.04, p = 0.0091 for n = 1; t(3) = 2.82, p = 0.067 for n = 2; t(3) = 6.74, p = 0.0067 for n = 3, two-tailed paired t test) (Fig. 2B). This made a contrast with the case of intact monkeys, in which there were no differences at n = 1–3 (see above). However, because the difference between the two monkey groups reached significance only for n = 3 (F(8,3) = 19.8 for equal variance test, t(10) = −2.10, p = 0.061 for n = 1; F(8,3) = 14.1, t(10) = −1.26, p = 0.24 for n = 2; F(8,3) = 19.3, t(10) = −4.08, p = 0.0022 for n = 3, two-tailed t test), the conclusion here is not very definite.
Dependence of RT on the response type (correct/error) history
We then examined whether the RT of monkeys reflected the error likelihood of the response, by analyzing changes of RT along the course of %C recovery after an error trial. The RT was measured by the time from the test items' onset to the monkey's touch. We focused on correct trials to avoid the effects of the response type (correct or error) in the current trial (see the next section and the last paragraph of this section). Effects of other factors (i.e., the sample, response direction, and currently relevant rule) were removed by subtracting mean RTs for each value of each factor from RTs in individual trials (see Materials and Methods).
We found that RTs in eC trials were long, that the RT in ecnC trials decreased as n increased, and that there was a significant negative correlation between these averaged RT differences and %C in each of the intact monkeys (r < − 0.84, p < 0.017; Fig. 3A, left). The monkeys may have learned the association between the response-type history and the error likelihood of the upcoming response through the long experience of the task performance and accordingly slowed their response when the perceived error likelihood was high. It appears that some of the intact monkeys also perceived the error likelihood of the upcoming response based on the presented sample and slowed the response when the error likelihood was high: for each of the three intact monkeys in which the %C significantly varied depending on the sample in the current trial (in after-cc trials, p < 0.050 by a one-way ANOVA with 72 samples; each sample was regarded to be different depending on the rule), there were significant correlations between the averaged RT (in ccC trials, each sample was regarded to be different depending on the rule) and the %C (in after-cc trials) for each sample (r = −0.49 to −0.30, p ≤ 0.012). These results showed that the RT of monkeys reflected both the error likelihood component determined by the response-type history and that determined by the sample in the current trial.
Figure 3.
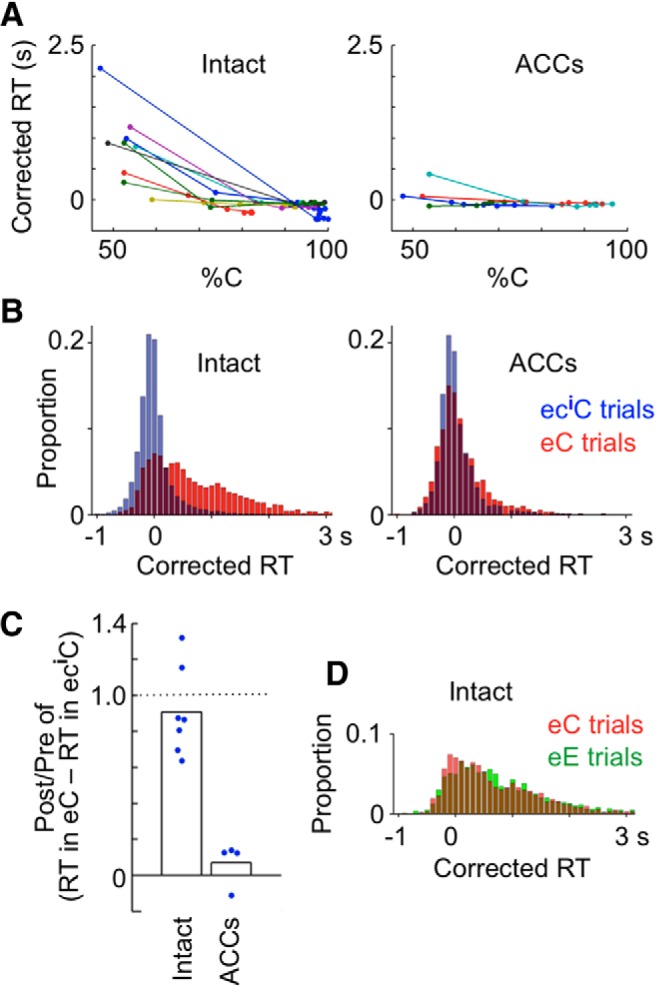
Dependence of RT on the error likelihood component determined by the response type (correct or error) history. A, RT in ecnC trials (correct trials following a sequence of an error trial and n consecutive correct trials) plotted against %C in after-ecn trials (n = 0–6) for nine intact monkeys (left) and for four ACCs-lesioned monkeys (right). The lines connect data points of each monkey in the order of n. Different colors indicate data in different monkeys. RT was corrected in that the mean RT averaged over all cC trials in each block was subtracted from RTs in individual trials. Mean RTs in cC trials were on average 1.01 ± 0.25 s in intact monkeys and 1.08 ± 0.21 s in ACCs-lesioned monkeys. B, RTs in eC trials compared with those in eciC trials. The number of trial sequences (eC or eciC) with RTs in the bin (100 ms) divided by the total number of the trial sequences is plotted against RT. Trials were pooled for nine intact monkeys (left) and for four ACCs-lesioned monkeys (right). The “i” was determined in each monkey so that the difference in %C between after-e and after-eci trials just exceeded 20%. C, Postlesion versus prelesion ratio of differences between median RTs in eC trials and median RTs in eciC trials in individual monkeys. The postlesion value was divided by the prelesion value in each monkey, and the ratio was averaged across monkeys in each group. Bars represent the averaged ratio, and dots indicate the ratios in individual monkeys. D, RTs in eE trials (error trials following an error trial), compared with those in eC trials, in the nine intact monkeys.
To further examine the relationship between the RT and error likelihood determined by the response-type history and to examine effects of ACCs lesions on it, we focused on the comparison between after-e trials (trials after an error trial) and the trials immediately after the %C recovered >20% from that in after-e trials in each monkey. Half of the intact monkeys exceeded this level in trials after ec and the remaining half after ecc. As for ACCs-lesioned monkeys, two of them exceeded the level after ec, whereas the other two did so only in after ecccc or after ecccccc. A fair evaluation of ACCs lesion effects required the mean error likelihood difference to be balanced between the intact and ACCs groups. We therefore made two further adjustments. First, we removed two intact monkeys that already showed 97% or 91% correct responses in after-ec trials in the second set of (“postoperative”) tests. Thus, the number of intact monkeys in this analysis was seven. Second, we added one more correct trial for two intact monkeys in the preoperative tests (i.e., after-eccc trials instead of after-ecc trials for one monkey and after-ecc trials instead of after-ec trials in the other monkey). By these adjustments, the averaged reduction in the error likelihood was very similar between the two groups, both preoperatively (0.286 for the ACCs group and 0.282 for the intact group) and postoperatively (0.236 for the ACCs group and 0.235 for the intact group). Again, we focused on correct trials to avoid the effects of response type in the current trial (see the next section). The change in RT associated with these changes in error likelihood remained unchanged from the prelesion tests to the postlesion tests in the intact group (with a mean post-pre ratio of 0.908), whereas there was a big reduction (with a mean post-pre ratio of 0.069) in the ACCs group (Fig. 3B,C). This difference between the two groups of monkeys was highly significant (F(8,3) = 4.10 for equal variance test, t(10) = 6.31, p = 0.00014, two-tailed t test). These results indicate that ACCs was essential for the response slowing that occurred under the high error likelihood determined by the response-type history.
The response slowing in trials following an error trial consistently occurred regardless of the response type in the current trial: RTs in eE trials were not different from those in eC trials (Fig. 3D). A paired t test applied to the median RTs in eE trials and eC trials in individual intact monkeys did not show a significant difference (t(8) = 1.25, p = 0.25, two-tailed). There was no significant difference between RTs in eE and eC trials in each monkey for seven of the nine intact monkeys (p ≥ 0.25, Mann–Whitney test), although RTs in eE trials were significantly longer than those in eC trials in two intact monkeys (p = 0.035, 0.047).
The absence of correlation between the RT and response type in trials following an error trial (Fig. 3D) makes a contrast with the clear presence of such a correlation in trials following a correct trial, which will be described in the next section (Fig. 4A). The %C was near chance level in trials following an error trial (Fig. 2). In these trials, there may have been no differences in the subjective value of each rule when an erroneous response was selected compared with when a correct response was selected. The monkeys selected a response by trial and error, and the response just happened to be correct or erroneous. This also suggests that the response slowing in trials following an error trial observed in our study may be different from the “posterror slowing” previously observed in easier tasks (Rabbitt and Rogers, 1977; Laming, 1979; Brewer and Smith, 1984; Hajcak et al., 2003), in which the %C remained high after an error trial. Therefore, the intact posterror slowing found in patients with ACCs lesions in easier tasks (Swick and Turken, 2002; Modirrousta and Fellows, 2008) is not inconsistent with the present finding of significant reduction, by ACCs lesions, of response slowing in trials following an error trial.
Figure 4.

Distributions of RT in erroneous and correct responses. A, RTs in ccE trials (error trials following two consecutive correct trials) and ccC trials (correct trials following two consecutive correct trials) for nine intact monkeys (left) and for four ACCs-lesioned monkeys (right). B, Differences in median RT between ccE and ccC trials in individual monkeys. Bars represent the mean averaged over the nine intact monkeys and that averaged over the four ACCs-lesioned monkeys. Dots indicate the values in individual monkeys.
We could not draw a conclusion regarding whether the ACCs lesions degraded the RT adjustment based on the error likelihood component determined by the sample. The %C in after-cc trials significantly varied depending on the sample in two of the four ACCs-lesioned monkeys (p < 0.00010; p ≥ 0.059 in the other two monkeys) postoperatively. There was a significant correlation between the RT in ccC trials and %C in after-cc trials for each sample in one of the two monkeys (r = −0.620, p < 0.00010), whereas the correlation was insignificant in the other monkey (r = −0.215, p = 0.070).
We did not use a multiregression method to separate effects of the response-type history from those of the response type in the current trial, as there were significant interactions. When we applied a two-way ANOVA (with the response-type history and the response type in the current trial as across-subject factors) to RTs in ccC, ccE, eC, and eE trials for each of the nine intact monkeys, all the monkeys showed significant interactions (p < 0.00010). It is thus more straightforward to analyze the effects of response-type history separately within the pair of eC versus ccC trials and within the pair of eE versus ccE trials. We further focused on the eC versus ccC comparison in this paper, as correct trials after consecutive correct trials (ccC trials) can be a common reference in which the task was ideally performed. The difference between median RTs in eC and ccC trials (ec − ccC) was significantly longer (905 ms on average) than that between median RTs in eE and ccE trials (eE − ccE, 518 ms on average) (t(8) = 2.86, p = 0.021, two-tailed paired t test). The dependence of the response type in the current trial on the response-type history was within a range for which an application of multiregression method is usually allowed; r was 0.43 ± 0.07 (mean ± SD) in the nine intact monkeys.
Dependence of RT on the response type in the current trial
We then examined whether the RT was correlated with the type (correct/erroneous) of the current response. To discriminate the dependency of RT on the response type in current trial from the effects of the response types in previous trials, we compared RTs between ccE and ccC trials (error trials following two consecutive correct trials and correct trials following two consecutive correct trials, respectively). Because RTs in eccC trials were not significantly different from those in cccC trials in any of the intact or ACCs-lesioned monkeys (p ≥ 0.13, Mann–Whitney test), the response type in the trial three trials before the current trial did not have significant influence on the RT in the current trial. Thus, the comparison between ccE and ccC trials could not be influenced by the history before the two consecutive correct trials. Effects of other factors (i.e., the sample, response direction, and currently relevant rule) were also removed by subtracting mean RTs for each value of each factor from RTs in individual trials (see Materials and Methods).
We found that RTs in error trials tended to be longer than those in correct trials (Fig. 4A, left) and that this difference was also largely reduced in ACCs-lesioned monkeys (Fig. 4A, right). Statistical tests were conducted on median RTs in individual monkeys. The median RT in ccE trials was consistently longer than that in ccC trials across monkeys in the intact group (Fig. 4B; t(8) = 3.25, p = 0.012, two-tailed paired t test), whereas there were no such consistent differences in the ACCs-lesion group (Fig. 4B; t(3) = 1.54, p = 0.22). Also, the ccE-ccC RT differences in ACCs-lesioned monkeys were significantly smaller than those in intact monkeys (Fig. 4B; F(8,3) = 16.3 for equal variance test, t(10) = 2.51, p = 0.031, by two-tailed t test applied to differences between median RTs in individual monkeys). Our analyses in this section were limited to the postlesion comparison between the two groups of monkeys because we did not record some information necessary for the analyses in the prelesion test for two monkeys in the ACCs group. Removal of the intact monkey with the largest difference between median RTs in ccE and ccC trials, which may appear to be an outlier, did not change the conclusions: median RTs in ccE trials were significantly longer than those in ccC trials in the intact group (t(7) = 6.55, p = 0.00032, two-tailed paired t test) and the differences in ACCs-lesioned monkeys were significantly smaller than those in intact monkeys (F(7,3) = 1.79 for equal variance test, t(10) = 3.05, p = 0.012).
Dependence of RT on the conflict level in the current trial
The WCST analog has two matching rules upon which the monkeys first acquired extensive pretraining. The majority of errors in the task were selections of the items that matched the sample in the currently nonreinforced rule. Hence, two response plans, based on the two rules, may have been activated regardless of the currently relevant rule, thereby generating conflict. Might the slowing of responses we found in trials immediately following an error trial and in error trials be attributed to ACCs detecting higher levels of conflict between two responses in these trials? We considered this possibility by examining RTs in another version of the WCST analog that included two different levels of conflict.
In this version, one of the three test items matched the sample in color and a second item matched in shape in half of the trials, as in the main task, whereas one of the test items matched the sample in both color and shape in the other half of trials. We call the former “high-conflict trials” and the latter “low-conflict trials.” The remaining two test items did not match the sample either in color or shape in low-conflict trials. Because the two types of trials were intermingled, the monkey could not know the type of trial until test items appeared. To exclude possible effects from the previous trial, we focused on correct trials that followed a high-conflict correct trial. RTs were not corrected for the samples in this analysis because we did not record some information necessary for this correction. Otherwise, the analysis procedures were the same as those in other analyses.
RTs in high-conflict trials were significantly longer than those in low-conflict trials in each of the nine intact monkeys (p ≤ 0.00071, Mann–Whitney test, Fig. 5A, left). The difference between median RTs in low- and high-conflict trials in individual monkeys was 149 ± 23 ms (mean ± SEM). These differences in RT between low- and high-conflict trials were also observed in ACCs-lesioned monkeys (Fig. 5A, right). The differences were significant in each of the four ACCs-lesioned monkeys (p ≤ 0.00010). The difference between median RTs in low- and high-conflict trials in ACCs-lesioned monkeys was 113 ± 24 ms (mean ± SEM). The differences in the four ACCs-lesioned monkeys were not significantly different from those in the nine intact monkeys (F(8,3) = 2.6 for equal variance test, t(11) = 0.86, p = 0.41, by two-tailed t test applied to the differences between median RTs in individual monkeys; Figure 5B).
Figure 5.
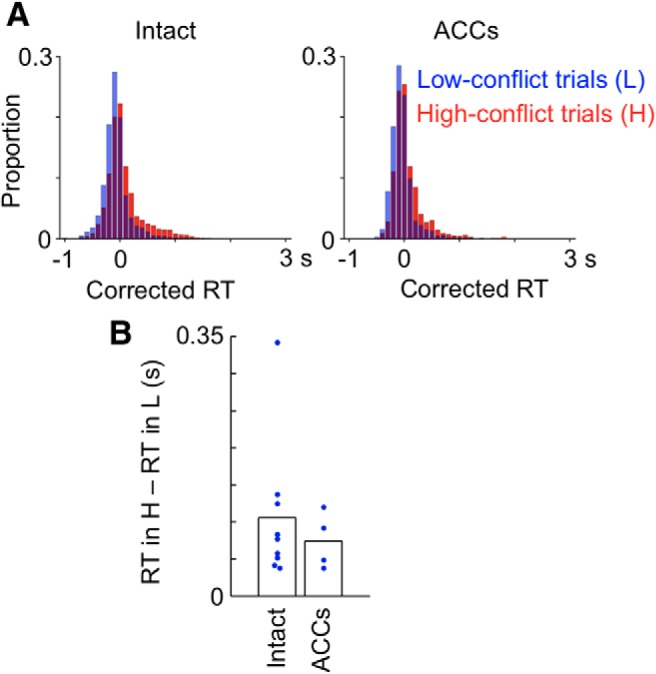
Distributions of RT in high-conflict and low-conflict trials. RT was compared between correct trials of the high-conflict condition following a correct trial of the high-conflict condition (H trials) and correct trials of the low-conflict condition following a correct trial of the high-conflict condition (L trials). A, RTs in individual trials for nine intact monkeys (left) and for four ACCs-lesioned monkeys (right). B, Differences in median RT between H trials and L trials in the postlesion tests.
Dependence of RT on the response-type history and response type in the current trial in monkeys with lesions in other cortical areas
To examine the specificity of the effects of lesions to ACCs, the correlation between the RT and error likelihood component determined by the response-type history was also compared between preoperative and postoperative tests in monkeys with bilateral lesions given to several other cortical areas. As in the analyses for ACCs and intact monkey groups, we compared RT between eC trials and the eciC trials immediately after the %C recovered >20% from that in after-e trials in each monkey. One of the four monkeys with lesions to the principal sulcus was removed from this analysis because it did not reach this level of %C, even after six consecutive correct trials. None of the bilateral lesions to the PS regions (n = 3), sdlPFC (n = 3), FPC (n = 4), PCC (n = 3), or preM (n = 2) showed consistent changes in the difference between RTs in eC trials and RTs in eciC trials comparable with those observed after the ACCs lesions (Fig. 6A). When the postlesion/prelesion ratio of the difference between median RTs in eC and eciC trials in each monkey was compared between monkey groups, the values in each of the PS, sdlPFC, FPC, and PCC groups were not significantly smaller than those in the intact group (F(2,6) = 5.0 for equal variance test, t(2) = 0.85, p = 0.79 for PS, F(2,6) = 2.04, t(8) = 1.73, p = 0.94 for sdlPFC, F(3,6) = 5.56, t(3) = 0.010, p = 0.50 for FPC, and F(2,6) = 11.0, t(2) = 2.13, p = 0.91 for PCC, one-tailed t test). Although similar statistical comparisons with the premotor group cannot be applied because it contained only two monkeys, Figure 6A shows that the values of the two individual monkeys in the premotor group were not as small as any of the values in individual ACCs-lesioned monkeys. The values in each of the PS, sdlPFC, FPC, and PCC groups were significantly larger than those in the ACCs group (F(2,3) = 20.8, t(2) = 3.26, p = 0.042 for PS, F(2,3) = 8.33, t(5) = 6.38, p = 0.00070 for sdlPFC, F(3,3) = 21.7, t(3) = 2.81, p = 0.034 for FPC, and F(2,3) = 45.4, t(2) = 3.93, p = 0.030 for PCC, one-tailed t test). These results show that the reduction of response slowing in trials following an error trial was specific to lesions in ACCs.
Figure 6.

Effects on RT of lesions in various cortical regions. Bilateral lesions were made in ACCs, PS, sdl PFC, FPC, PCC, and preM. A, Postlesion versus prelesion ratio of differences between median RTs in eC trials and median RTs in eciC trials in individual monkeys. The postlesion value was divided by the prelesion value in each monkey, and the ratio was then averaged across monkeys in each group. Bars represent the averaged ratio in each monkey group, and dots indicate the ratios in individual monkeys. The “i” was determined in each monkey so that the difference in %C between after-e and after-eci trials just exceeded 20%. B, Differences between median RTs in ccE trials and median RTs in ccC trials in individual monkeys in postlesion sessions. Bars represent the averaged differences in each monkey group, and dots indicate the differences in individual monkeys. C, Extent of lesions.
None of the lesion groups, other than the ACCs group, showed consistently smaller differences between RTs in ccE trials and RTs in ccC trials compared with those in the intact group (Fig. 6B). When the difference between median RTs in ccE and ccC trials calculated for each monkey's performance in the postlesion sessions was compared between monkey groups, the values in each of these other lesion groups were not significantly smaller than those in the intact group (F(8,3) = 9.12 for equal variance test, t(11) = 1.31, p = 0.11 for PS, F(8,2) = 14.4, t(10) = −0.27, p = 0.51 for sdlPFC, F(8,3) = 4.58, t(11) = 0.92, p = 0.19 for FPC and F(2,8) = 2.5, t(10) = −0.37, p = 0.64 for PCC, one-tailed t test). Similarly, Figure 6B shows that the values of the two individual monkeys in the premotor group were not as small as any of the values in individual ACCs-lesioned monkeys. The values in each of the PS and sdlPFC groups were significantly larger than those in the ACCs group (F(3,3) = 1.79, t(6) = −1.97, p = 0.048 for PS and F(2,3) = 11.4, t(5) = −4.69, p = 0.0027 for sdlPFC), although the values in each of the FPC and PCC groups were not significantly different from those in the ACCs group (F(3,3) = 0.28, t(6) = −1.51, p = 0.090 for FPC and F(2,3) = 41.7, t(2) = −1.27, p = 0.17 for PCC, one-tailed t test). These results suggest that the reduction of response slowing in erroneous responses following consecutive correct trials was also specific to lesions in ACCs, although the data were less conclusive than those for the reduction of response slowing in trials following an error trial.
ACCs cell activities recorded in intact monkeys performing the WCST analog
A total of 343 cells were recorded from the dorsal bank of the anterior cingulate sulcus in two intact monkeys performing the WCST analog (Fig. 1C). The task used in these recording experiments was similar to that used in the lesion experiments but with the differences described in Materials and Methods. In particular, because of the additional requirement of gaze fixation, the monkeys could not achieve a high performance when test items were randomly sampled from the stimulus pool and placed in random arrangements; therefore, we used four sets of test items with fixed spatial arrangements, and each sample was coupled with a particular test item arrangement. Accordingly, the monkeys could determine the direction of response only from the sample. The test items were added to the monitor 564 ms after the sample onset. There was also an 802 ms delay from the monkey's touch on the monitor to the onset of feedback.
The two monkeys (R1 and R2) used in the recording experiments behaved similarly to the intact control monkeys in the lesion experiments (Fig. 7). However, although the %C was approximately chance level in trials immediately following an error trial (Fig. 7A), as in the intact monkeys in the lesion experiments, the RT slowing in these trials was smaller in R1 and R2 (Fig. 7B). Also, the recovery of high %C was slower in R1 and R2 (Fig. 7A) compared with the intact monkeys used in the lesion experiments. These differences may have been due to the head fixation, requirement of eye fixation, shorter ITI, and smaller value of reward in each trial in the recording experiments.
Figure 7.

%C and its correlation with RT in trials following an error trial in the two intact monkeys during cell recordings. The data of Monkey R1 are indicated by crosses and solid lines, and those of Monkey R2 by circles and broken lines. A, %C in trials after a sequence of ecn. B, RT in ecnC trials plotted against %C in after-ecn trials (n = 0–6). RT was corrected in that the mean RT averaged over all cC trials in each block was subtracted from RTs in individual trials. Mean RTs in cC trials were on average 0.395 s in Monkey R1 and 0.474 s in Monkey R2.
Most (334 of 343 cells) of the recorded ACCs cells showed significant modulation of activities along the course of the trial. We added two postfeedback epochs to the Epochs 1–4 in the analysis here: Epoch 5 starting at the feedback onset and Epoch 6 starting 1000 ms after the feedback onset (both, 800 ms long). A two-way ANOVA (with the response type as a between-subject factor and epoch as a within-subject factor) applied to activities in Epochs 1–6 showed either significant main effects of epoch (p < 0.025) or significant interactions (p < 0.025) in these cells. The position of higher activities varied widely among the cells and covered all the phases of the trial (Fig. 8). We have further analyzed the activities with one large window (postfeedback window) and four narrower (800 ms) windows (Epochs 1–4).
Figure 8.

Peak positions of cell activities along the course of trial. For each cell, the raw firing rate (without the corrections described in Materials and Methods) in individual trials and its mean and SD across trials were calculated in a 200-ms-long window moving with steps of 20 ms. The overall mean firing rate was also calculated by averaging the firing rate over all time positions. The deviation of the mean firing rate at each time position from the overall mean firing rate was divided by the SD at the position, and this normalized difference is indicated by color. The darkest red and the darkest blue indicate 2 and −2, respectively. Parts with nonsignificant deviations (p > 0.050) are indicated by white. In this and the following figures, small arrowheads under the horizontal axis indicate, from left to right, the fixation start (blue), sample onset (green), test item onset (orange), monkey's touch on the screen (black), and feedback onset (red). The lines and horizontal axis are cut in the middle because RT varied among trials.
Responses to feedback
Different feedback was given in correct and error trials, namely, juice reward in correct trials and no reward and visual error signal in error trials. When we compared the mean firing rate in a 1600 ms window starting at the feedback onset subtracted by the mean firing rate in a 800 ms window immediate before the feedback onset (Epoch 4) between ccE and ccC trials, approximately one-third of the recorded cells (113 cells) showed significant differences (p < 0.050, two-tailed t test). Approximately three-fourths of the 113 cells (83 cells) showed higher activities after the error signal and the remainder (30 cells) showed higher activities after the reward.
ACCs cell responses to feedback have previously been shown to represent prediction errors in action values (Matsumoto et al., 2007; Quilodran et al., 2008). The 83 cells described above might have shown larger responses to the error signal because the error signal occurred less frequently and brought larger prediction errors than the reward given in the correct trials (the %C in trials following a correct trial was 87.6% in Monkey R1 and 76.8% in Monkey R2). However, 57 of the 83 cells did not show significantly larger responses to the reward in eC trials than in ccC trials (p > 0.10) (Fig. 9, Population 1). Because the %C in the trials following an error trial was significantly smaller than that in the trials following two consecutive correct trials (53.7% vs 91.3% in Monkey R1 and 56.0% vs 83.4% in Monkey R2), the reward occurred less frequently and then was more informative in eC trials than that in ccC trials. If the larger responses in ccE trials than in ccC trials were the result of the larger prediction errors in ccE trials than in ccC trials, the cells should also have shown larger responses to the reward in eC trials than in ccC trials. Also, 23 of the 30 cells did not show significantly larger responses to the reward in ccC trials than in eC trials (p > 0.10) (Fig. 9, Population 2). We conclude that the differential activities after the feedback in these 80 (57 + 23) cells between ccE and ccC trials represented the reward or no reward + error signal, including their meanings for response selection.
Figure 9.
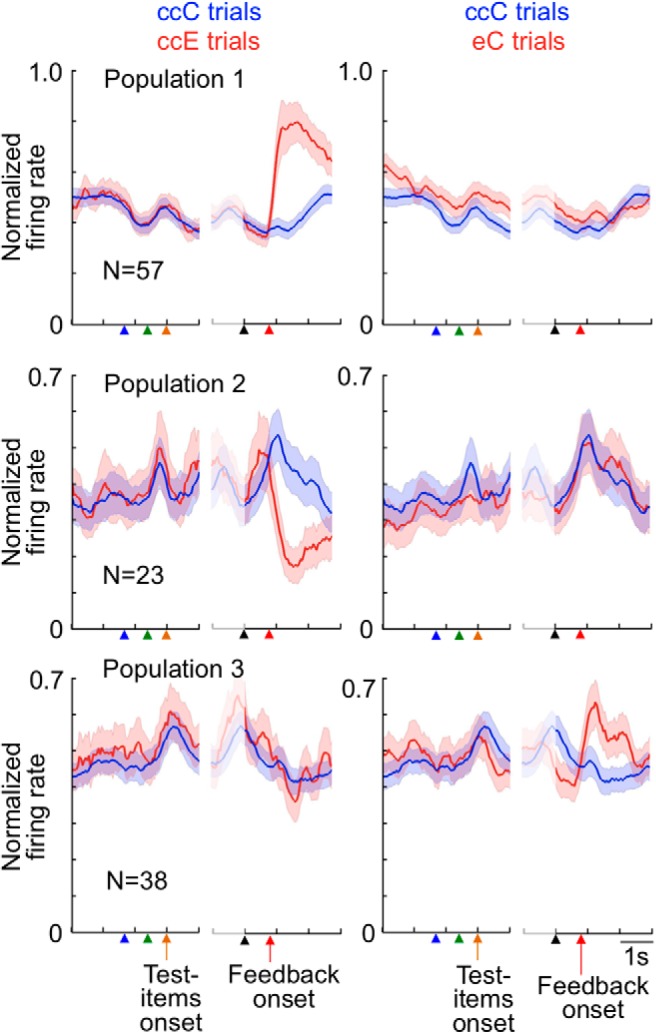
Differential cell responses to the reward and error signal. Averaged activities in three cell populations are shown. Graphs in row panel represent responses of the same cell population. Red lines indicate activities in ccE trials in the left column and those in eC trials in the right column, whereas blue lines indicate activities in ccC trials in both columns. Shadows represent SEM across cells for populations. Activities in the left part of each graph were aligned to the fixation onset, sample onset, and test item onset, whereas those in the right part were aligned to the monkey's touch on the screen and feedback onset. Cells in Population 1 showed significantly larger responses to the error signal in ccE trials than their responses to the reward in ccC trials (p < 0.050), and their responses to the reward were not significantly larger in eC trials than in ccC trials (p > 0.10). Cells in Population 2 showed significantly larger responses to the reward in ccC trials than their responses to the error signal in ccE trials (p < 0.050), and their responses to the reward were not significantly larger in ccC trials than in eC trials (p > 0.10). Cells in Population 3 showed significantly larger responses to the same reward in eC trials than in ccC trials (p < 0.050), and their responses to the error signal were not significantly larger in ccE trials than in ccC trials (p > 0.10). Bin width, 50 ms. In this figure and Figures 10A and 11A, the firing rate was smoothed over seven bins with equal weights, and then the value in each bin was normalized by the maximum in the two histograms in each cell and then averaged over the cells.
When we compared cell responses with the reward between eC and ccC trials, we found in 63 cells significantly larger responses to the reward in eC trials than their responses to the same reward in ccC trials (in the 1600 ms window starting at the feedback onset, p < 0.050). Of these 63 cells, 38 cells did not show responses to the error signal in ccE trials significantly larger than their responses to the reward in ccC trials (p > 0.10) (Fig. 9, Population 3). Because the responses to the feedback were not significantly larger in ccE trials than in ccC trials in these 38 cells, their larger responses in eC trials could not reflect more information, or larger prediction error, given by the reward in eC trials compared with that in ccC trials. The monkeys identified the correct rule for the first time when the positive feedback was provided in eC trials. The activities that specifically occurred in the 38 cells following the reward in eC trials may have represented the process of identifying the correct rule after an error trial.
Activities depending on the response-type history
We here turn to activities during task performance before feedback onset. We first describe our finding that many ACCs cells changed their activities along the course of %C recovery after an error trial. In Monkey R1, the %C recovered from 54% to 81% after two consecutive correct trials following an error trial. Based on that level of recovery to >80% we selected ccC trials to be compared with eC trials. The %C in after-cc trials was 91%. The %C recovered less in Monkey R2 after two consecutive correct trials (from 56% to 75%). However, because the %C after two consecutive correct trials, when averaged over all cases regardless of the response type before them, was 83%, we also used ccC trials in Monkey R2. We focused on activities in correct trials to analyze modulation by the response-type history in isolation from effects of the response type in the current trial, as we did in the analyses of monkeys' RTs (see the last paragraph of this section).
When activities in the Epochs 1–4 were compared between eC trials and ccC trials by a two-way ANOVA (with the sequence type as a between-subject factor and the epoch as a within-subject factor), more than a half (189 cells) of the recorded cells showed either significant main effects of sequence type (p < 0.025) or interaction (p < 0.025). The direction of difference was then determined by the averaged activities in the four Epochs. Approximately half of them (94 cells) showed higher activities in eC trials, and the remaining half (95 cells) showed lower activities in eC trials.
Most of these 189 cells did not show significant differences when activities in the same windows (Epochs 1–4) were compared between ccE and ccC trials. Of the 94 cells with significantly higher activities in eC trials, 73 cells did not show significantly larger activities in ccE trials compared with their activities in ccC trials (p > 0.10) (Fig. 10, Population 1). Of 95 cells with significantly lower activities in eC trials, 80 cells did not show significantly lower activities in ccE trials (Fig. 10, Population 2). The absence of significant differences in the ccE versus ccC comparisons suggests that their higher or lower activities in eC trials did not reflect error likelihood in general (see the next section) but were associated with the component of error likelihood specifically associated with response-type history (see Discussion).
Figure 10.

Larger or smaller activities in trials following an error trial during the task performance. A, Top two rows, Activities of two example cells. Bottom two rows, Averaged activities of two cell populations. Graphs in each row represent activities of the same cell or cell group. Shadows represent SEM across trials for example cells and SEM across cells for populations. Cells in Populations 1 and 2 were selected by comparing activities in Epochs 1–4 between eC and ccC trials. Cells in Population 1 showed significantly larger activities in eC trials than their activities in ccC trials (p < 0.050), and their activities in ccE trials were not significantly larger than their activities in ccC trials (p > 0.10). Cells in Population 2 showed significantly smaller activities in eC trials than their activities in ccC trials (p < 0.050), and their activities in ccE trials were not significantly smaller than their activities in ccC trials (p > 0.10). B, The proportion, among all the recorded cells (343 cells), of the cells with significant differences between eC and ccC trials (p < 0.050), without significant differences between ccE and ccC trials (p > 0.10), at each epoch. Leftmost bar represents the proportion of cells in Populations 1 and 2 selected by applying a two-way ANOVA to activities in Epochs 1–4 together. C, The proportion, among the 153 cells in the Populations 1 and 2, of the cells that showed significant differences in one, two, three, or four of the epochs. B, C, Open parts of the bars represent the cells with larger activities in eC trials than in ccC trials; shaded parts represent the cells with smaller activities in eC trials than in ccC trials. D, Averaged activities of cells in Populations 1 and 2 (shown by solid and broken lines, respectively) in Epochs 2 and 3 of eC, ecC, eccC, and ecccC trials. The activities were normalized in each cell by setting its maximum and minimum activities to 1 and 0, respectively, and then averaged across cells in each cell population. Shadows represent SEM across cells.
Of the 73 cells with higher activities specific to eC trials, some cells (25 cells) showed significantly larger responses to the error signal presentation in the previous trial compared with their activities after the reward (p < 0.050), and the higher activities continued into the current task period (Fig. 10, Cell 1). The others either showed significantly lower activities after the error signal (p < 0.050, 3 cells; Fig. 10, Cell 2) or showed no differential activities to the reward and error signal (45 cells) in the previous trial. In these latter cells, the higher activities started sometime during the ITI. Of the 80 cells with lower activities specific to eC trials, 15 cells showed significantly lower activities after the error signal in the previous trial compared with their activities after the reward (p < 0.050). Others showed either significantly larger responses to the error signal (p < 0.050, 19 cells) compared with their activities after the reward or showed no differential activities to the reward and error signal (46 cells).
To examine the time course of the differential activities in relation to the events during task performance, we then compared activities in individual epochs (all 800 ms long) by two-tailed t test. The proportion of the cells with significantly different activities between eC and ccC trials (p < 0.050), without significant differences between ccE and ccC trials (p > 0.10), was almost constant from Epoch 1 to Epoch 3 (26%–31%), and it dropped to 19% in Epoch 4 (Fig. 10B). When activities of the 153 cells (73 + 80) were analyzed in individual epochs (by one-tailed t test assuming the difference direction determined by averaged activities in the four epochs with p < 0.0125, see Materials and Methods), more than one-third of them (35.9%) showed significant differences in a consistent difference direction (either eC > ccC or ccC > eC) in multiple epochs (2 epochs for 26.1% cells, 3 epochs for 7.2%, and 4 epochs for 2.6%), although others (47.7%) showed significant differences in only one epoch (Fig. 10C).
Along the course of recovery from an error trial, activities of the 73 cells selected above by eC>ccC AND not ccE>ccC were the largest in eC trials, decreased to ecC trials (p < 0.00010, paired t test), and further decreased from ecC trials to eccC trials (p = 0.00010) (Fig. 10D, solid line). These results of gradual decrease support the interpretation that the activity modulation reflected the response-type history-dependent error likelihood, rather than only the outcome in the immediately preceding trial. Activities of the 80 cells selected by ccC>eC AND not ccC>ccE were also the smallest in eC trials and increased to ecC trials (p < 0.00010), but the changes from ecC trials to ecccC trials were not significant (p = 0.64). The activity modulation of the latter group of cells might represent the memory of the outcome that the monkey received in the immediately preceding trial. However, because in most of them there was no activity modulation by the previous outcome immediately after it and the modulation appeared during the ITI or after the current trial started (see the fourth paragraph in this section), the activity modulation of the latter group of cells might also have reflected the response-type history-dependent error likelihood, rather than the memory of the outcome in the last previous trial. The results described here were obtained with activities averaged between Epochs 2 and 3, during which the monkeys selected the response, and with normalization by the maximum and minimum in each cell (Fig. 10D). Similar results were obtained by epoch-by-epoch analyses, in which cells were selected by significant modulation in each epoch and their activities in that epoch were analyzed, and by analyses without normalization.
The response slowing after an error trial consistently occurred regardless of the response type (correct or error) in the current trial (Fig. 3D). Correspondingly, when activities in eE trials were compared with those in eC trials in Epochs 1–4, the number of cells with either significant main effects of sequence type (p < 0.025) or significant interaction (p < 0.025) was not significantly different from that expected to occur by chance (4.4%, p = 0.65, binominal test). Thus, there were few cell activities in ACCs that distinguished eE trials from eC trials before the feedback onset.
We did not use a multiregression method to separate effects of the response-type history from those of the response type in the current trial, as there were significant interactions. When we applied a three-way ANOVA (with the response-type history and the response type in the current trial as between-subject factors and the epoch as a within-subject factor) to activities in ccC, ccE, eC, and eE trials, 38 of the 343 cells showed either significant interaction between the response-type history and the response type in the current trial (p < 0.025) or significant three-way interaction (p < 0.025). Also, the number of cells that showed significantly different activities between eE and ccE trials (71, eE > ccE in 32 cells and ccE > eE in 39 cells) was significantly smaller than the number of cells that showed significantly different activities between eC and ccC trials (181, p < 0.00010, χ2 test). Third, whereas many cells showed significantly different activities between ccE and ccC trials (see the next section), few cells showed different activities between eE and eC trials (as described in the previous paragraph).
Activities correlated with the response type (correct or error) in the current trial
Here, we report activities during the task performance period correlated with the response type in the current trial. We have seen that the monkeys' RT depended on the type of the response, even after the effects of the response-type history and those of the sample and response direction in the current trial were removed. This suggests that the monkeys perceived the residual variation of error likelihood in the response and thereby controlled the speed of response. To find neuronal substrates of this link, we compared ACCs cell activities between ccE and ccC trials. Because the effects of response type difference in a previous trial on the %C in the current trial became insignificant only after five consecutive correct trials in Monkey R1 and only after six consecutive correct trials in Monkey R2, we should have compared activities between cccccE and cccccC trials in Monkey R1 and between ccccccE and ccccccC trials in Monkey R2. However, the sensitivity of analysis would have significantly decreased in these cases because of the smaller numbers of such trial sequences during recording from each cell. We then decided to compare neuronal activities between ccE and ccC trials but exclude the effects of earlier histories by removing the cells that showed significant differences (p < 0.10) in the same direction in the second trial of the trial sequences (cCe vs cCc).
A two-way ANOVA (with the sequence type as a between-subject factor and the epoch as a within-subject factor) applied to activities in the four epochs before the feedback onset (Epochs 1–4) in ccE and ccC trials showed either significant main effects of response type (p < 0.025) or significant interactions (p < 0.025) in 65 cells. Fifty-five of the 65 cells did not show significant (p < 0.10) differences in the same direction for the cCe versus cCc comparison. The direction of difference was determined by the averaged activities in the four epochs. A majority of the 55 cells (36 cells) showed higher activities in ccE trials (as Populations 1 and 3 in Fig. 11A), and the remaining 19 cells showed higher activities in ccC trials (as Populations 2 and 4 in Fig. 11A).
Figure 11.
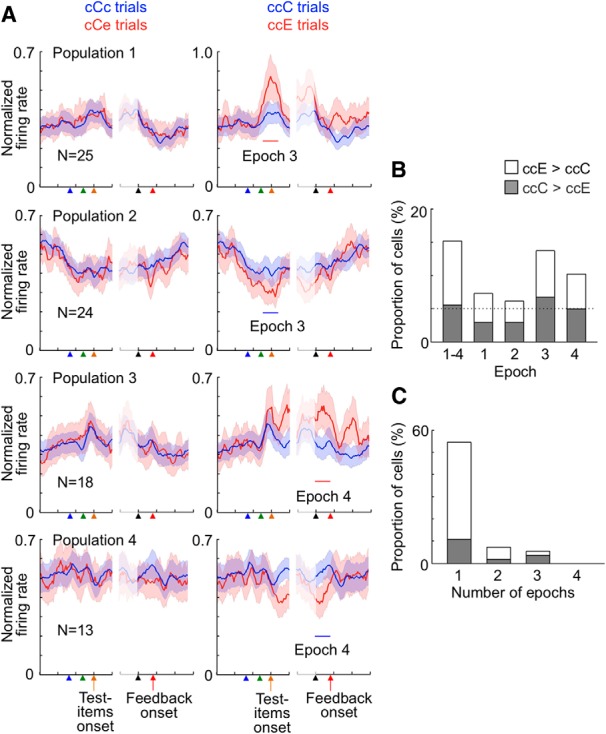
Larger or smaller activities during selection of erroneous responses. A, Averaged activities of four groups of cells. Graphs in each row represent activities of the same group. The criteria of cell selection were that: (1) they showed significantly larger (for Populations 1 and 3) or smaller (for Populations 2 and 4) activities in ccE trials than in ccC trials (p < 0.050); and (2) their activities in cCe trials were not significantly larger (for Populations 1 and 3) or smaller (for Populations 2 and 4) than their activities in the same epoch in cCc trials (p > 0.10). Cells were selected based on their activity modulations in the Epoch 3 for Populations 1 and 2 and Epoch 4 for Populations 3 and 4. Red and blue horizontal bars represent the relevant epoch. B, The proportion, among all the recorded cells (343 cells), of the cells with significant differences between ccE and ccC trials (p < 0.050), without significant differences between eC and ccC trials (p > 0.10), at each epoch. Leftmost bar represents the proportion of cells selected by applying a two-way ANOVA to activities in Epochs 1–4 together (55 cells). C, The proportion, among the 55 cells, of the cells that showed significant differences in one, two, three, or four of the epochs. B, C, Open parts of the bars represent the cells with larger activities in ccE trials than in ccC trials, and the shaded parts represent the cells with larger activities in ccC trials than in ccE trials.
Epoch-by-epoch analyses showed that the correlation of cell activities with the response type in the current trial (p < 0.050), without significant difference between cCe and cCc trials (p > 0.10), had started even before the fixation started (Epoch 1, 27 cells, significantly larger than the number expected by chance, p = 0.0081, binominal test), but the proportion of cells increased toward the time of response (Fig. 11B). The differential activities tended to appear rather transiently in a relatively short time period. Most of the 55 cells showed significant correlations only in one epoch (Fig. 11C; one-tailed t test with p < 0.0125). The ratio of the cells with significant correlations in multiple epochs to those with significant correlations only in one epoch was significantly smaller for the modulation by the response type in the current trial than that for the modulation by the response-type history (p = 0.0078, χ2 test), suggesting that the modulation by the response type in the current trial occurred more transiently than the modulation by the response-type history.
Modulation of activities by sample, response direction, and currently relevant rule
The %C of both Monkeys R1 and R2 in after-cc trials varied depending on the sample (p ≤ 0.010, χ2 test; in any of the direction-rule combinations). Moreover, there was a significant correlation between the RT in ccC trials and %C in after-cc trials for each sample in both monkeys (r = −0.288, p = 0.045 for Monkey R1 and r = −0.396, p = 0.0053 for Monkey R2; there were 48 data points as each sample was regarded to be different depending on the rule). We then examined the correlation between the firing rate of each cell in Epochs 3 and 4 of ccC trials (after the sample presentation and before the feedback onset) and the %C in after-cc trials for each sample. Eighty-three cells showed significant correlation either in Epoch 3 (p < 0.025) or Epoch 4 (p < 0.025). Forty-four of them showed negative correlation (smaller the %C larger the firing rate) and 39 cells showed positive correlation. No cell showed significant correlations in inconsistent polarity in the two epochs. Thus, there was a group of ACCs cells that represented the error likelihood component determined by the sample in the course of response selection and during the period while the monkey was waiting the feedback after completing the response.
There were also ACCs cells that showed activity modulations in association with the response direction (left, right, and bottom). A nested ANOVA (with the sample nested under the response direction, both as between-subject factors, and the epoch as a within-subject factor) applied to activities in Epochs 3 and 4 of ccC trials showed significant main effects of response direction (p < 0.025) or significant interaction between response direction and epoch (p < 0.025) in 142 cells. Because the %C of monkeys in after-cc trials varied depending on the response direction under both rules in both Monkeys R1 and R2 (p < 0.0032, χ2 test), the modulation of neuronal activities by the response direction might be related to the variation of error likelihood among the response directions. However, we cannot analyze the correlation as there were only three response directions.
We also examined neuronal modulations in association with the currently relevant rule (color-matching and shape-matching). A two-way ANOVA (the rule as a between-subject factor and the epoch as a within-subject factor) was applied to the activities in Epochs 1–4 of ccC trials for the 154 cells for which we had successfully removed slow changes in activities (see Methods and Materials). Thirty-eight cells (24.7%) showed either significant main effects of rule (p < 0.025) or significant interactions (p < 0.025). Because the %C was significantly different between color and shape blocks in both monkeys (p = 0.029 for Monkey R1 and p = 0.048 for Monkey R2, χ2 test), the rule-related activities could be related with error likelihood.
Relative magnitudes and localization of different types of neuronal activity modulations
The relative magnitudes of the different types of neuronal activity modulations were examined by calculating the R2, the ratio of the regression sum of squares to the total sum of squares of variances, for each modulation in Epoch 3. The calculation was conducted after removing the other factors as in the analyses to identify the modulation, and then the ratio should be understood to be relative to the residual trial variances. The R2 value averaged over the cells that showed significant modulations for each factor was 0.062 for the response-type history, 0.050 for the response type in the current trial, 0.047 for the error likelihood determined by the sample, 0.133 for the response direction, and 0.051 for the current rule. Within the extent of recordings (A35–41 in Monkey R1 and A35–42 in Monkey R2, and 2–6 mm from the midline in both monkeys), there was no clear localization of cells, consistent to the two monkeys, with a particular type of activity modulation.
Discussion
In the WCST analog, the %C in trials immediately following an error trial (after-error trials) was at chance, and it recovered as correct trials were accumulated (Fig. 2). We found that the RT of monkeys also changed in correlation with the change in %C in the process of recovery from an error trial: it was long in after-error trials, and it returned to the normal range as correct trials were accumulated (Fig. 3). We also found that many cells in ACCs changed their activities around response selection during the process of recovery from an error trial (Fig. 10) and that bilateral lesions of ACCs largely abolished the response slowing in trials following an error trial (Fig. 3). The monkeys may have learned the relation between the error likelihood of the upcoming response and the recent history of response types and associated outcomes through the long-term experience of the task performance and slowed the response when the perceived error likelihood was high. These results suggest that ACCs played an essential role in representation of the response-type history-dependent error likelihood component and possibly ensuing response slowing as well.
We also found that intact monkeys were slower to respond in error trials than in correct trials after the effects of response-type history were excluded and that the ACCs lesions significantly reduced this response slowing (Fig. 4). This modulation remained even after the effects of the sample, response direction, and currently relevant rule were excluded. In the WCST analog, even highly trained intact monkeys occasionally committed errors amid consecutive correct responses. The slow responses in these error trials may also have reflected high error likelihood, or high uncertainty, in the response selection. However, the high error likelihood inferences in these error trials were unaccompanied by any environmental cues indicating high error likelihood and hence were generated entirely internally. We also found that groups of ACCs cells showed distinctive activities around the erroneous selection but before the monkey could discover, by feedback, that the selection was erroneous (Fig. 11). Lesions of ACCs probably reduced slowing of erroneous selections by eliminating the contributions of these ACCs cell activities. The ACCs cells that showed activities associated with internally detected high error likelihood only partly overlapped with those that showed activities associated with context-dependent high error likelihood. Thus, the internally detected high error likelihood was represented independently from the context-dependent high error likelihood in ACCs. As we inferred the higher error likelihood in error trials from the longer RT in these trials, there remains a possibility that some degradation in cognitive control, which resulted in erroneous response selection, directly slowed the response without a process to monitor the higher error likelihood.
The cell activities correlated with error likelihood that we report here are distinct from error-related negativity (ERN) signals previously observed in speeded tasks (Gemba et al., 1986; Gehring et al., 1993; Dehaene et al., 1994). Although early studies found that ERNs commenced before action initiation, the stimulus arrangement explicitly indicated the response to be erroneous in these studies. ERNs were recorded after feedback in later studies (Miltner et al., 1997; Luu et al., 2003), and it has been suggested that ERN is the response to the earliest sign of prediction error in success/failure (Holroyd and Coles, 2002). In addition to responses to feedback, we found ACCs cell activities representing high uncertainty in the response that the monkey was going to generate. ACCs cell activities correlated with the error likelihood in the upcoming response selection (Procyk et al., 2000; Shidara and Richmond, 2002; Matsumoto et al., 2003) and those representing the reward history (Seo and Lee, 2007; Donahue et al., 2013) have been reported.
We have considered whether the role of ACCs in response slowing in after-error trials and in error trials might be more associated with conflict level rather than with error likelihood. In a second version of WCST analog, in which trials with low conflict were intermingled with trials with high conflict, responses in high-conflict trials were slower than those in low-conflict trials, whereas the ACCs lesions did not change this response slowing (Fig. 5). The conflict level in the second version of WCST analog was explicitly indicated by the combination of test items and sample, whereas the high error likelihood in the original WCST analog was indicated either remotely by the error feedback given in the previous trial or only internally in the course of response selection in the current trial. These differences may have made one type of response slowing independent from ACCs and the other types of response slowing dependent on ACCs.
When the error likelihood decreased as correct trials were accumulated after an error trial, the reward expectation and/or motivation might have increased as well. The recovery of short RTs along this course might reflect the increase in reward expectation and/or motivation. However, because responses in after-error trials became as fast as those in consecutive correct trials after ACCs lesions, it has then to be assumed that, after ACCs lesions, the reward expectation and motivation remained high regardless of the response-type history. The other changes in monkeys' behavior after ACCs lesions (i.e., slower recovery of high %C after an error trial and more frequent error commissions after consecutive correct trials) cannot be explained by a common mechanism as those for RT changes in this case. In the following paragraph, we suggest a single idea that might explain all of the main deficits after ACCs lesions as well as all of the ACCs cell activities observed.
ACCs cell activities during response selection might be involved in selecting and supporting modes, or strategies, of response selection. We reason that intact monkeys may have used two modes of response selections in the WCST analog: one based on working memory of the currently relevant rule and the other based on trial and error of selecting one of the two possible responses indicated by the two rules. In after-error trials, the high error likelihood was perceived and then the trial-and-error mode was used. In consecutive correct trials, in which the error likelihood was low, the working-memory-dependent mode was maintained. The monkeys were not simply responding without cognitive control in the trial-and-error mode that we suppose here because they overcame the perseverative tendency (Passingham, 1972; Roberts et al., 1988), the RT was longer, and the ACCs lesions loosened the reset of response history. The ACCs lesions caused two types of changes in the percentage of correct responses: one was a slower recovery after an error trial and the other was an increase in the occasional errors committed even after several successive correct trials. The slower recovery could be caused by a deficit in reestablishing the working-memory-dependent mode after the trial-and-error mode. The occasional commission of errors after successive correct trials could represent easier slips from the working-memory-dependent mode into the trial-and-error mode. The control of response speed is assumed to be coupled with these two modes. The ACCs lesions degraded the switching from the trial-and-error mode to the working-memory-dependent mode and the energizing each of the two modes, and thereby abolished the response speed control.
The abundant representation of error feedback and reward and the unique representation of the first reward after an error trial in ACCs might be useful for implementing switches between working-memory-dependent and trial-and-error modes. The error feedback might initiate the trial-and-error mode, and the reward might promote the working-memory-dependent mode. The first reward after an error trial, in particular, should terminate the trial-and-error mode and initiate the working-memory-dependent mode. The ACCs cell activities in response to feedback and those through the course of response selection may be tightly coupled with each other in organizing the action selection strategies (for a related discussion, see Quilodran et al., 2008).
There are several previous studies relevant to our hypothesized functions of ACCs. In two studies (Shima and Tanji, 1998; Hayden et al., 2011), the amount of reward decreased while monkeys repeated the same action and the reward amount was reset to maximum by alternating actions, or by selecting a particular target that did not provide a reward by itself. ACCs cells showed increased activity correlated with these alternations or resetting actions, which are themselves reasoned to have required greater cognitive control/drive. Human fMRI studies also suggest that ACCs plays a role in exploration when this requires heightened cognitive drive (Daw et al., 2006; Kolling et al., 2012). Hence, an emerging view is that ACCs suppresses automatic actions and promotes action selection strategies that require strong cognitive control, a cognitive function that also involves the presupplementary motor area (Isoda and Hikosaka, 2007). When a task requires the system to alternatively activate different cognitively demanding modes, as in our present study and studies by Procyk et al. (2000) and Matsumoto et al. (2003), different groups of ACCs cells become active in support of the different modes. Our empirical evidence from lesion-behavioral and recording studies presented here suggests that ACCs is involved in organizing action selection strategies, particularly in the presence of high levels of uncertainty or error likelihood.
Footnotes
This work was supported by the Funding Program for World-Leading Innovative R&D on Science from the Japanese government. We thank fMRI Support Unit for taking MRI and T. Hashikawa for histology.
The authors declare no competing financial interests.
References
- Behrens TE, Woolrich MW, Walton ME, Rushworth MF. Learning the value of information in an uncertain world. Nat Neurosci. 2007;10:1214–1221. doi: 10.1038/nn1954. [DOI] [PubMed] [Google Scholar]
- Botvinick M, Nystrom LE, Fissell K, Carter CS, Cohen JD. Conflict monitoring versus selection-for-action in anterior cingulate cortex. Nature. 1999;402:179–181. doi: 10.1038/46035. [DOI] [PubMed] [Google Scholar]
- Brewer N, Smith GA. How normal and retarded individuals monitor and regulate speed and accuracy of responding in serial choice tasks. J Exp Psychol Gen. 1984;113:71–93. doi: 10.1037/0096-3445.113.1.71. [DOI] [PubMed] [Google Scholar]
- Brown JW, Braver TS. Learned predictions of error likelihood in the anterior cingulate cortex. Science. 2005;307:1118–1121. doi: 10.1126/science.1105783. [DOI] [PubMed] [Google Scholar]
- Buckley MJ, Mansouri FA, Hoda H, Mahboubi M, Browning PG, Kwok SC, Phillips A, Tanaka K. Dissociable components of rule-guided behavior depend on distinct medial and prefrontal regions. Science. 2009;325:52–58. doi: 10.1126/science.1172377. [DOI] [PubMed] [Google Scholar]
- Carter CS, Braver TS, Barch DM, Botvinick MM, Noll D, Cohen JD. Anterior cingulate cortex, error detection, and the online monitoring of performance. Science. 1998;280:747–749. doi: 10.1126/science.280.5364.747. [DOI] [PubMed] [Google Scholar]
- Corbetta M, Miezin FM, Dobmeyer S, Shulman GL, Petersen SE. Selective and divided attention during visual discriminations of shape, color, and speed: functional anatomy by positron emission tomography. J Neurosci. 1991;11:2383–2402. doi: 10.1523/JNEUROSCI.11-08-02383.1991. [DOI] [PMC free article] [PubMed] [Google Scholar]
- Daw ND, O'Doherty JP, Dayan P, Seymour B, Dolan RJ. Cortical substrates for exploratory decisions in humans. Nature. 2006;441:876–879. doi: 10.1038/nature04766. [DOI] [PMC free article] [PubMed] [Google Scholar]
- Dehaene S, Posner MI, Tucker DM. Localization of a neural system for error detection and compensation. Psychol Sci. 1994;5:303–305. doi: 10.1111/j.1467-9280.1994.tb00630.x. [DOI] [Google Scholar]
- Donahue CH, Seo H, Lee D. Cortical signals for rewarded actions and strategic exploration. Neuron. 2013;80:223–234. doi: 10.1016/j.neuron.2013.07.040. [DOI] [PMC free article] [PubMed] [Google Scholar]
- Falkenstein M, Hohnsbein J, Hoormann J, Blanke L. Effects of errors in choice reaction task on the ERP under focused and divided attention. In: Brunia CHM, Gaillard AWK, Kok A, editors. Psychophysiological brain research. Tilburg: Tilburg UP; 1990. pp. 192–195. [Google Scholar]
- Gehring WJ, Goss B, Coles MGH, Meyer DE, Donchin E. A neural system for error detecdtion and compensation. Psychol Sci. 1993;4:385–390. doi: 10.1111/j.1467-9280.1993.tb00586.x. [DOI] [Google Scholar]
- Gemba H, Sasaki K, Brooks VB. ‘Error’ potentials in limbic cortex (anterior cingulate area 24) of monkeys during motor learning. Neurosci Lett. 1986;70:223–227. doi: 10.1016/0304-3940(86)90467-2. [DOI] [PubMed] [Google Scholar]
- Hajcak G, McDonald N, Simons RF. To err is autonomic: error-related brain potentials, ANS activity, and post-error compensatory behavior. Psychophysiology. 2003;40:895–903. doi: 10.1111/1469-8986.00107. [DOI] [PubMed] [Google Scholar]
- Hayden BY, Pearson JM, Platt ML. Neuronal basis of sequential foraging decisions in a patchy environment. Nat Neurosci. 2011;14:933–939. doi: 10.1038/nn.2856. [DOI] [PMC free article] [PubMed] [Google Scholar]
- Holroyd CB, Coles MG. The neural basis of human error processing: reinforcement learning, dopamine, and the error-related negativity. Psychol Rev. 2002;109:679–709. doi: 10.1037/0033-295X.109.4.679. [DOI] [PubMed] [Google Scholar]
- Isoda M, Hikosaka O. Switching from automatic to controlled action by monkey medial frontal cortex. Nat Neurosci. 2007;10:240–248. doi: 10.1038/nn1830. [DOI] [PubMed] [Google Scholar]
- Kennerley SW, Walton ME, Behrens TE, Buckley MJ, Rushworth MF. Optimal decision making and the anterior cingulate cortex. Nat Neurosci. 2006;9:940–947. doi: 10.1038/nn1724. [DOI] [PubMed] [Google Scholar]
- Kolling N, Behrens TE, Mars RB, Rushworth MF. Neural mechanisms of foraging. Science. 2012;336:95–98. doi: 10.1126/science.1216930. [DOI] [PMC free article] [PubMed] [Google Scholar]
- Laming D. Autocorrelation of choice-reaction times. Acta Psychol (Amst) 1979;43:381–412. doi: 10.1016/0001-6918(79)90032-5. [DOI] [PubMed] [Google Scholar]
- Luu P, Tucker DM, Derryberry D, Reed M, Poulsen C. Electrophysiological responses to errors and feedback in the process of action regulation. Psychol Sci. 2003;14:47–53. doi: 10.1111/1467-9280.01417. [DOI] [PubMed] [Google Scholar]
- Mansouri FA, Tanaka K. Behavioral evidence for working memory of sensory dimension in macaque monkeys. Behav Brain Res. 2002;136:415–426. doi: 10.1016/S0166-4328(02)00182-1. [DOI] [PubMed] [Google Scholar]
- Mansouri FA, Matsumoto K, Tanaka K. Prefrontal cell activities related to monkeys' success and failure in adapting to rule changes in a Wisconsin Card Sorting Test analog. J Neurosci. 2006;26:2745–2756. doi: 10.1523/JNEUROSCI.5238-05.2006. [DOI] [PMC free article] [PubMed] [Google Scholar]
- Mansouri FA, Buckley MJ, Tanaka K. Mnemonic function of the dorsolateral prefrontal cortex in conflict-induced behavioral adjustment. Science. 2007;318:987–990. doi: 10.1126/science.1146384. [DOI] [PubMed] [Google Scholar]
- Mansouri FA, Tanaka K, Buckley MJ. Conflict-induced behavioural adjustment: a clue to the executive functions of the prefrontal cortex. Nat Rev Neurosci. 2009;10:141–152. doi: 10.1038/nrn2538. [DOI] [PubMed] [Google Scholar]
- Matsumoto K, Suzuki W, Tanaka K. Neuronal correlates of goal-based motor selection in the prefrontal cortex. Science. 2003;301:229–232. doi: 10.1126/science.1084204. [DOI] [PubMed] [Google Scholar]
- Matsumoto M, Matsumoto K, Abe H, Tanaka K. Medial prefrontal cell activity signaling prediction errors of action values. Nat Neurosci. 2007;10:647–656. doi: 10.1038/nn1890. [DOI] [PubMed] [Google Scholar]
- Miltner WH, Braun CH, Coles MG. Event-related brain potentials following incorrect feedback in a time-estimation task: evidence for a “generic” neural system for error detection. J Cogn Neurosci. 1997;9:788–798. doi: 10.1162/jocn.1997.9.6.788. [DOI] [PubMed] [Google Scholar]
- Modirrousta M, Fellows LK. Dorsal medial prefrontal cortex plays a necessary role in rapid error prediction in humans. J Neurosci. 2008;28:14000–14005. doi: 10.1523/JNEUROSCI.4450-08.2008. [DOI] [PMC free article] [PubMed] [Google Scholar]
- Oliveira FT, McDonald JJ, Goodman D. Performance monitoring in the anterior cingulate is not all error related: expectancy deviation and the representation of action-outcome associations. J Cogn Neurosci. 2007;19:1994–2004. doi: 10.1162/jocn.2007.19.12.1994. [DOI] [PubMed] [Google Scholar]
- Pardo JV, Pardo PJ, Janer KW, Raichle ME. The anterior cingulate cortex mediates processing selection in the Stroop attentional conflict paradigm. Proc Natl Acad Sci U S A. 1990;87:256–259. doi: 10.1073/pnas.87.1.256. [DOI] [PMC free article] [PubMed] [Google Scholar]
- Passingham R. Non-reversal shifts after selective prefrontal ablations in monkeys (Macaca mulatta) Brain Res. 1972;92:89–102. doi: 10.1016/0028-3932(72)90041-3. [DOI] [PubMed] [Google Scholar]
- Paus T. Primate anterior cingulate cortex: where motor control, drive and cognition interface. Nat Rev Neurosci. 2001;2:417–424. doi: 10.1038/35077500. [DOI] [PubMed] [Google Scholar]
- Procyk E, Tanaka YL, Joseph JP. Anterior cingulate activity during routine and non-routine sequential behaviors in macaques. Nat Neurosci. 2000;3:502–508. doi: 10.1038/74880. [DOI] [PubMed] [Google Scholar]
- Quilodran R, Rothé M, Procyk E. Behavioral shifts and action valuation in the anterior cingulate cortex. Neuron. 2008;57:314–325. doi: 10.1016/j.neuron.2007.11.031. [DOI] [PubMed] [Google Scholar]
- Rabbitt PMA, Rodgers B. What does a man do after he makes an error? An analysis of response programming. Q J Exp Psychol. 1977;29:727–743. doi: 10.1080/14640747708400645. [DOI] [Google Scholar]
- Roberts AC, Robbins TW, Everitt BJ. The effects of intradimensional and extradimensional shifts on visual discrimination learning in humans and non-human primates. Q J Exp Psychol. 1988;40:321–341. [PubMed] [Google Scholar]
- Seo H, Lee D. Temporal filtering of reward signals in the dorsal anterior cingulate cortex during a mixed-strategy game. J Neurosci. 2007;27:8366–8377. doi: 10.1523/JNEUROSCI.2369-07.2007. [DOI] [PMC free article] [PubMed] [Google Scholar]
- Shallice T, Burgess PW, Schon F, Baxter DM. The origins of utilization behaviour. Brain. 1989;112:1587–1598. doi: 10.1093/brain/112.6.1587. [DOI] [PubMed] [Google Scholar]
- Shidara M, Richmond BJ. Anterior cingulate: single neuronal signals related to degree of reward expectancy. Science. 2002;296:1709–1711. doi: 10.1126/science.1069504. [DOI] [PubMed] [Google Scholar]
- Shima K, Tanji J. Role for cingulate motor area cells in voluntary movement selection based on reward. Science. 1998;282:1335–1338. doi: 10.1126/science.282.5392.1335. [DOI] [PubMed] [Google Scholar]
- Swick D, Turken AU. Dissociation between conflict detection and error monitoring in the human anterior cingulate cortex. Proc Natl Acad Sci U S A. 2002;99:16354–16359. doi: 10.1073/pnas.252521499. [DOI] [PMC free article] [PubMed] [Google Scholar]