Abstract
The upper airway is often modeled as a classical Starling resistor, featuring a constant inspiratory airflow, or plateau, over a range of downstream pressures. However, airflow tracings from clinical sleep studies often show an initial peak before the plateau. To conform to the Starling model, the initial peak must be of small magnitude or dismissed as a transient. We developed a method to simulate fast or slow inspirations through the human upper airway, to test the hypothesis that this initial peak is a transient. Eight subjects [4 obstructive sleep apnea (OSA), 4 controls] slept in an “iron lung” and wore a nasal mask connected to a continuous/bilevel positive airway pressure machine. Downstream pressure was measured using an epiglottic catheter. During non-rapid eye movement (NREM) sleep, subjects were hyperventilated to produce a central apnea, then extrathoracic pressure was decreased slowly (∼2–4 s) or abruptly (<0.5 s) to lower downstream pressure and create inspiratory airflow. Pressure-flow curves were constructed for flow-limited breaths, and slow vs. fast reductions in downstream pressure were compared. All subjects exhibited an initial peak and then a decrease in flow with more negative pressures, demonstrating negative effort dependence (NED). The rate of change in downstream pressure did not affect the peak to plateau airflow ratio: %NED 22 ± 13% (slow) vs. 20 ± 5% (fast), P = not significant. We conclude that the initial peak in inspiratory airflow is not a transient but rather a distinct mechanical property of the upper airway. In contrast to the classical Starling resistor model, the upper airway exhibits marked NED in some subjects.
Keywords: obstructive sleep apnea, Starling resistor, negative effort dependence, pharyngeal upper airway, lung
obstructive sleep apnea (OSA) is a common disease characterized by repetitive collapse of the upper airway during sleep, leading to arousals, sleep fragmentation, and intermittent hypoxia. OSA has multiple contributing factors, but compromised upper airway anatomy is likely the dominant factor in many cases (10). To understand better the impact of pharyngeal anatomy, the upper airway has been modeled as a classical Starling resistor, i.e., a tube with rigid upstream and downstream segments and a collapsible midsection (28). Applied to the upper airway, the classical Starling resistor model emphasizes flow limitation during inspiration and a single effective peri-airway pressure (7). Specifically, once downstream (e.g., epiglottic or tracheal pressure at the thoracic inlet) and intraluminal pressures in the collapsible midsection drop below this surrounding tissue pressure, then flow limitation occurs. Despite further decreases in downstream pressure, airflow remains constant. The constant flow rate is determined only by the difference between the upstream (i.e., airway opening, usually atmospheric) pressure and surrounding tissue pressure, as well as the resistance of the upstream segment. It is therefore independent of downstream effort.
Applied to the upper airway, the Starling resistor model has been useful to explain snoring, hypopneas, and obstructive apneas as arising from the same pathophysiology but along a spectrum of severity. The model also provides a mechanism for the benefit of continuous positive airway pressure (CPAP) in the treatment of OSA (flow is increased by raising the upstream pressure above atmospheric pressure). Likewise, experimentally decreasing the upstream pressure to below atmospheric pressure via a nasal mask can also induce flow limitation and obstructive apneas in healthy subjects (27). Finally, the model allows for an estimation of the upper airway surrounding tissue pressure, the pharyngeal critical closing pressure (Pcrit), by varying the nasal pressure during sleep, observing the change in inspiratory flow, and extrapolating the pressure to zero flow. Measurement of Pcrit in a number of subjects has confirmed its value in predicting OSA, and it may explain the mechanism of benefit observed with various therapies for OSA such as weight loss or upper airway surgery (6, 25, 26).
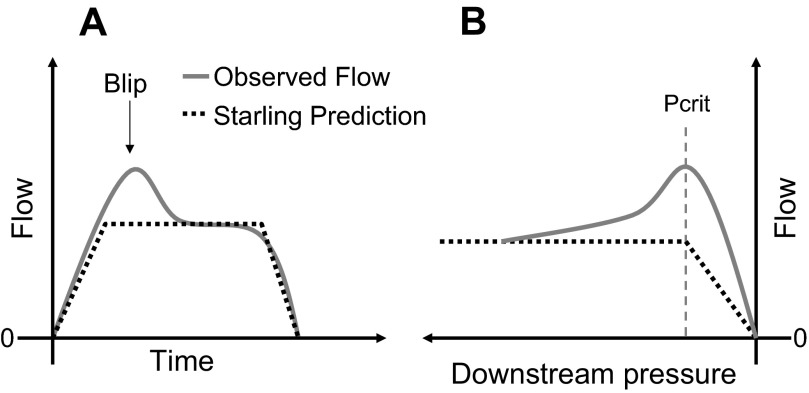
If the upper airway is indeed a classical Starling resistor, then flow-limited inspiratory airflow should be relatively constant, i.e., have a characteristic “flattened” pattern when the downstream pressure is reduced below Pcrit. As noted above, once the downstream pressure falls below Pcrit, airflow will be determined only by the difference between the nasal pressure and Pcrit, divided by the resistance of this upper airway segment. Further decreases in pressures downstream do not influence airflow (28). However, it is generally recognized that many OSA patients have a significantly different pattern of flow limitation (Fig. 1), in which flow actually decreases as downstream pressure becomes more negative (1, 17). This phenomenon, referred to as negative effort dependence (NED), is often of substantial magnitude and, when marked, is inconsistent with the Starling resistor model. One way to reconcile these observations with the Starling resistor model is to hypothesize that the observed early peak (the “blip” in Fig. 1) in flow is a transient. That is, this early peak in flow might represent air that flows through the upper airway before the walls (which have some finite mass and viscosity) can collapse and form a Starling resistor choke point.
Fig. 1.
A: example of an inspiratory blip during inspiratory airflow limitation compared with the Starling Resistor model prediction (dotted line). B: Starling resistor model predicts that once downstream pressure falls below the pharyngeal critical closing pressure (Pcrit) that airflow will plateau. However, we observed decreasing airflow with further decreases in downstream pressure in some patients.
Another practical question arising from this early peak in flow is how to measure the Pcrit of the upper airway. Pcrit is usually measured using a series of airway pressure drops to induce flow limitation. The peak flow and mask pressure are then plotted to determine the Pcrit by extrapolation to zero flow. Some investigators have used the peak flow (the “blip” for those with NED) (15), while others have used the flow at midinspiration (the plateau), thus ignoring the early peak (28, 29). Understanding the nature of the early peak could better inform this debate.
One hypothesis is that the early peak or blip is a transient. This hypothesis can be supported or disproved experimentally by examining downstream pressure/flow relationships as a function of inspiratory speed. Specifically, an observed dependence on the dynamics of inspiration (with fast changes in downstream pressure increasing the transient peak magnitude, and slow changes diminishing it) would support the hypothesis; independence of the dynamics of inspiration would disprove it. To test this hypothesis, we designed an experiment to vary the speed of inspiration in subjects with and without OSA during sleep. Briefly, subjects slept inside an “iron lung” with a nasal mask, and once asleep were hyperventilated using noninvasive positive pressure ventilation. During a subsequent central apnea, the pressure inside the iron lung was reduced at different speeds to produce fast or slow inspirations. With this protocol, the testable prediction is that rapid inspirations would exhibit a prominent blip (with more air sucked through the upper airway before the walls collapse). In contrast, slow inspirations would have little or no blip, and essentially conform to the classical Starling model, since the upper airway walls would have ample time to collapse and achieve a steady state.
METHODS
Subjects.
Five control subjects and four subjects with OSA were recruited. Control subjects were not known to have any sleep disorder and denied habitual snoring. Subjects were classified as OSA if they were habitual CPAP users and had been on therapy >3 mo. No study subject smoked, had any other respiratory disorder, or took medications known to affect respiratory or airway/muscle function. All subjects gave written, informed consent before participation in this study, which was approved by the Partner's Healthcare Human Research Committees. None of the findings of the present study has been previously published.
Equipment and set-up.
The study consisted of a single overnight experiment. Subjects arrived at the sleep laboratory 2 h before their usual bedtime. Wakefulness and sleep stages were determined using standard electroencephalogram, chin electromyogram, and electro-oculogram. Airway pressure was measured at the level of the epiglottis using a pressure-tipped catheter (Millar MPC-550, Millar Instruments, Houston, TX) passed through the nose and advanced 1.5–2 cm below the base of the tongue under direct visualization. Prior to insertion, both nostrils were sprayed with 0.05% oxymetazoline hydrochloride, a decongestant, and the more patent nostril was then anesthetized with 4% lidocaine topical spray. A nasal mask (Profile Lite or GoldSeal, Respironics, Murrysville, PA) was placed over the nose, and airflow and pressure were measured with a pneumotachograph (model 3700A, Hans Rudolph, Kansas City, MO) and a differential pressure transducer (model MP45, Validyne, Northridge, CA), respectively. Expired CO2 was continuously recorded from a catheter placed in the nostril with a capnograph (Vacumed, Ventura, CA). Arterial blood oxygen saturation via pulse oximetry (BCI, Waukesha, WI) and the electrocardiogram were monitored throughout the study for safety purposes. During the night, positive pressure was provided using either a modified CPAP machine (Respironics) capable of providing positive or negative pressure, and able to switch rapidly between settings (for Pcrit determination), or a commercially available BiPAP Synchrony device (Respironics) (for controlled fast and slow inspiration protocols). Patients slept in a head-out rigid shell (Porta-lung, Murrysville, PA) attached to a vacuum (ShopVac, Williamsport, PA) to decrease extrathoracic pressure. The vacuum speed could be manually adjusted to vary the rate of decrease in iron-lung pressure. All data were acquired on a 1401 plus interface and Spike 2 software (Cambridge Electronic Design, Cambridge, UK).
Protocol.
Subjects were given 10 mg of zolpidem just prior to bedtime to facilitate sleep. Once inside the iron lung, subjects were allowed an opportunity to sleep after nasal CPAP was applied. CPAP was initially set at the therapeutically prescribed level for OSA patients and at 4 cmH2O for controls, and it was increased if needed during sleep to eliminate flow limitation (defined as flattened inspiratory flow despite increasingly negative epiglottic pressure), snoring, or chest-abdomen paradox. This level of CPAP is referred to as the holding pressure. Once stable non-rapid eye movement (NREM) sleep had been achieved, the passive Pcrit was measured (see below). During the remainder of the night, by the process described below, “controlled” inspirations of varying speeds were accomplished during hyperventilation-induced central apneas.
Pcrit measurement.
Pcrit measurements were performed to determine the appropriate upper airway pressure that would produce airflow limitation, once the downstream pressure was lowered as part of the controlled inspirations. Using the modified CPAP machine, passive Pcrit measurements were made by abruptly dropping the airway pressure for five breaths from the holding pressure to progressively lower CPAP levels, typically starting 1 or 2 cmH2O below the holding pressure and progressing in decrements of 0.5 or 1 cmH2O per drop. If necessary, negative airway pressure was applied. Pressure drops were separated by at least 1 min and until a new stable baseline was observed. Patients were given time to reenter stable sleep after brief arousals, but if they awoke the measurement was aborted. During the night of the experiment, these pressure drops were used to obtain rough estimates of Pcrit. After completion of the study night, quantitative estimates of Pcrit were determined from peak inspiratory flow vs. mask pressure from breaths 3–5 during the pressure drops, if the breaths were flow limited. For each such series, peak inspiratory flow was linearly regressed against mask pressure, and Pcrit was defined as the zero-flow intercept of this regression (20). If multiple measurements were made during the night, the reported value is the average of all the measurements.
Controlled fast and slow inspirations.
After the Pcrit measurement, the remainder of the night was devoted to controlled fast and slow inspirations, as follows. During stable NREM sleep, patients were hyperventilated using bilevel positive airway pressure (PAP) in a timed (T) mode. The goal of the hyperventilation was to induce a central apnea of at least 20 s once noninvasive ventilation ceased. To achieve this, the expiratory positive airway pressure (EPAP) level was set to the holding pressure, and the inspiratory positive airway pressure (IPAP) level was initially set at least 4 cmH2O above the EPAP level and increased as needed to augment tidal volume. Similarly, the initial respiratory rate was set 2 breaths/min faster than the spontaneous breathing rate, and was increased if necessary to produce a sufficiently long central apnea.
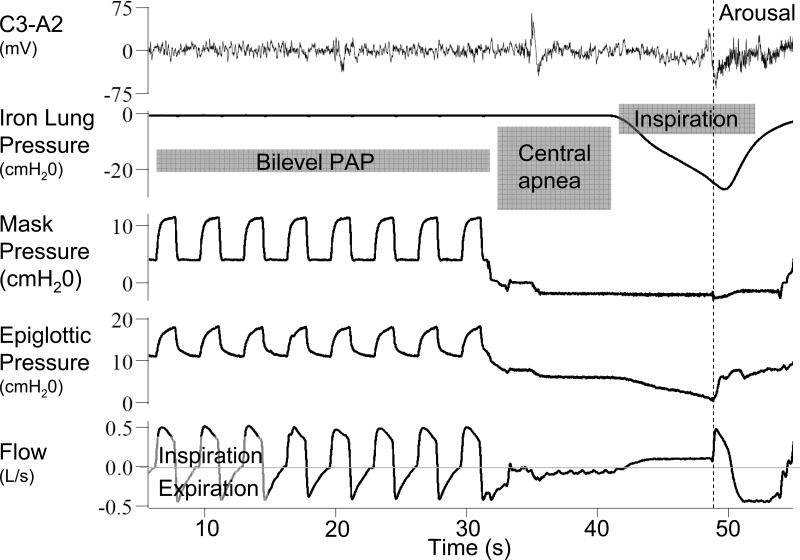
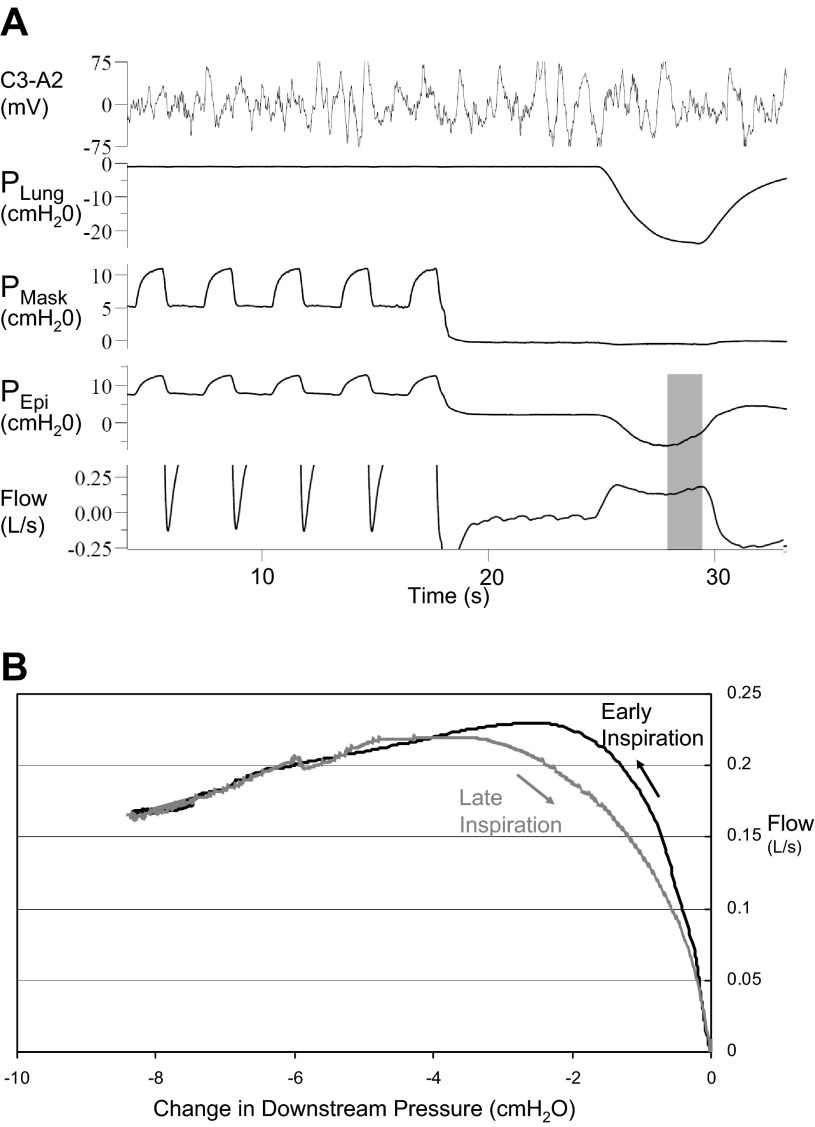
After each period of hyperventilation and during the subsequent central apnea, the mask pressure was lowered to ∼2 cmH2O above the estimated Pcrit using CPAP or continuous negative airway pressure (CNAP). After allowing time for lung volume to equilibrate (∼10 s), the pressure inside the iron lung was decreased either rapidly or slowly (Fig. 2), in random order. The reduction in extrathoracic pressure was transmitted to the airway, leading to a decrease in epiglottic (downstream) pressure and an increase in airflow through the upper airway into the chest. Flow limitation could be observed if further decreases in downstream pressure did not result in increases in airflow (Fig. 2). If successful, the process was then repeated with the alternate rate of pressure decrease. Over the course of the night, pairs of “fast” and “slow” breaths were created as often as possible.
Fig. 2.
Example of the experimental protocol. Subjects are hyperventilated with bilevel positive airway pressure (PAP). During the subsequent central apnea, the pressure around the chest is decreased (iron lung pressure). This causes a drop in the epiglottic pressure and results in inspiratory flow. The iron lung pressure could be dropped quickly or slowly (as in this example).
Analysis.
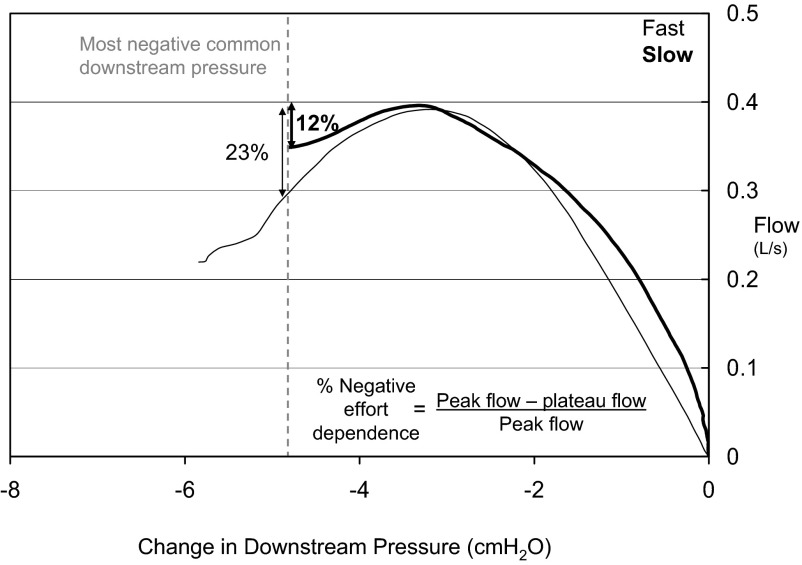
From each of the controlled breaths airflow was plotted against the change in epiglottic pressure from baseline. If an arousal (noted as abrupt shift in EEG frequency and/or increase in EMG tone) occurred during the controlled breath, only data prior to the arousal were considered. The data were considered in two ways: 1) paired fast and slow breath analysis: if available, the peak flow heights from paired fast and slow breaths were compared; and 2) comparison of percent NED across fast/slow pairs: to allow for comparison of breaths from across the night, we quantified for each breath the percent negative effort dependence (%NED), defined as the difference between peak and plateau flow, divided by the peak flow (Fig. 3). A %NED of 0% would be expected with a pure steady state Starling resistor; in contrast a large %NED (e.g., >50%) corresponds to a large blip. The plateau airflow was defined as the airflow at the most negative downstream pressure common to most of the controlled breaths (typically approximately −5 cmH2O). The %NED of all fast and all slow inspirations was then compared for each subject.
Fig. 3.
Data from a single subject (1) shows how simulated breaths from across the night were compared by quantifying the percent negative effort dependence: the difference in peak and plateau flow, divided by the peak flow. To allow comparison, the plateau flow was defined as the flow at a common downstream pressure.
Statistical analysis.
The %NED of all fast and all slow inspirations was compared for each subject using a paired t-test. A P value of <0.05 was considered statistically significant. Values are presented as means ± SD unless otherwise indicated.
RESULTS
Subject characteristics.
Complete data could not be obtained in one control subject due to poor sleep. The anthropometric, polysomnographic, and passive Pcrit data for the eight remaining subjects (4 OSA, 4 controls) in whom complete data were obtained are shown in Table 1.
Table 1.
Subject characteristics
| Subject | Diagnosis | Age, yr | Sex | BMI, kg/m2 | AHI, events/h | CPAP Rx, cmH2O | Holding Pressure, cmH2O | Pcrit, cmH2O |
|---|---|---|---|---|---|---|---|---|
| 1 | Control | 38 | F | 21.1 | 4 | −4.0 | ||
| 2 | OSA | 56 | M | 26.9 | 24.8 | 8 | 8 | 1.6 |
| 3 | Control | 59 | F | 28.1 | 4 | −4.4 | ||
| 4 | OSA | 46 | F | 44.4 | 76.6 | 8 | 12 | 4.7 |
| 5 | OSA | 46 | M | 26.6 | 46 | 13 | 13 | 6.2 |
| 6 | Control | 28 | M | 24.8 | 5 | 2.1 | ||
| 7 | Control | 28 | M | 23.4 | 6 | −3.4 | ||
| 8 | OSA | 54 | F | 36.9 | 70 | 9–14* | 15 | 7.1 |
Apnea-hypopnea index (AHI) values were from prior clinical polysomnogram, if available.
OSA, obstructive sleep apnea; BMI, body mass index; CPAP, continuous positive-airway pressure; Pcrit, pharyngeal critical closing pressure.
On auto-titrating CPAP at the given range of pressures.
Fast and slow inspirations.
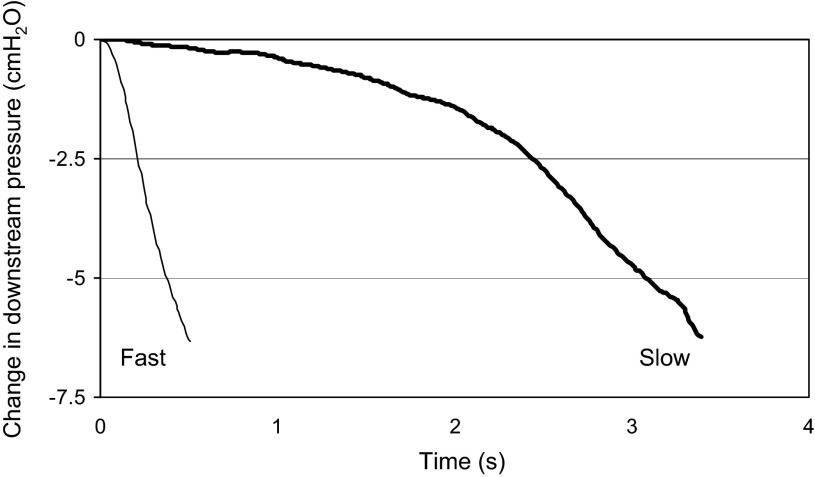
Controlled fast breaths typically were associated with a change in the downstream pressure over ∼0.5–1 s; controlled slow breaths had a similar magnitude change in downstream pressure over 2–4 s (Fig. 4). Note that these controlled inspiratory times are approximately one-half and double the normal length of time necessary to achieve the nadir negative downstream pressure, ∼1 s.
Fig. 4.
Rate of change in downstream pressure in one subject. The experimental protocol allowed for either fast or slow (bold) simulated breaths.
Paired fast and slow breaths.
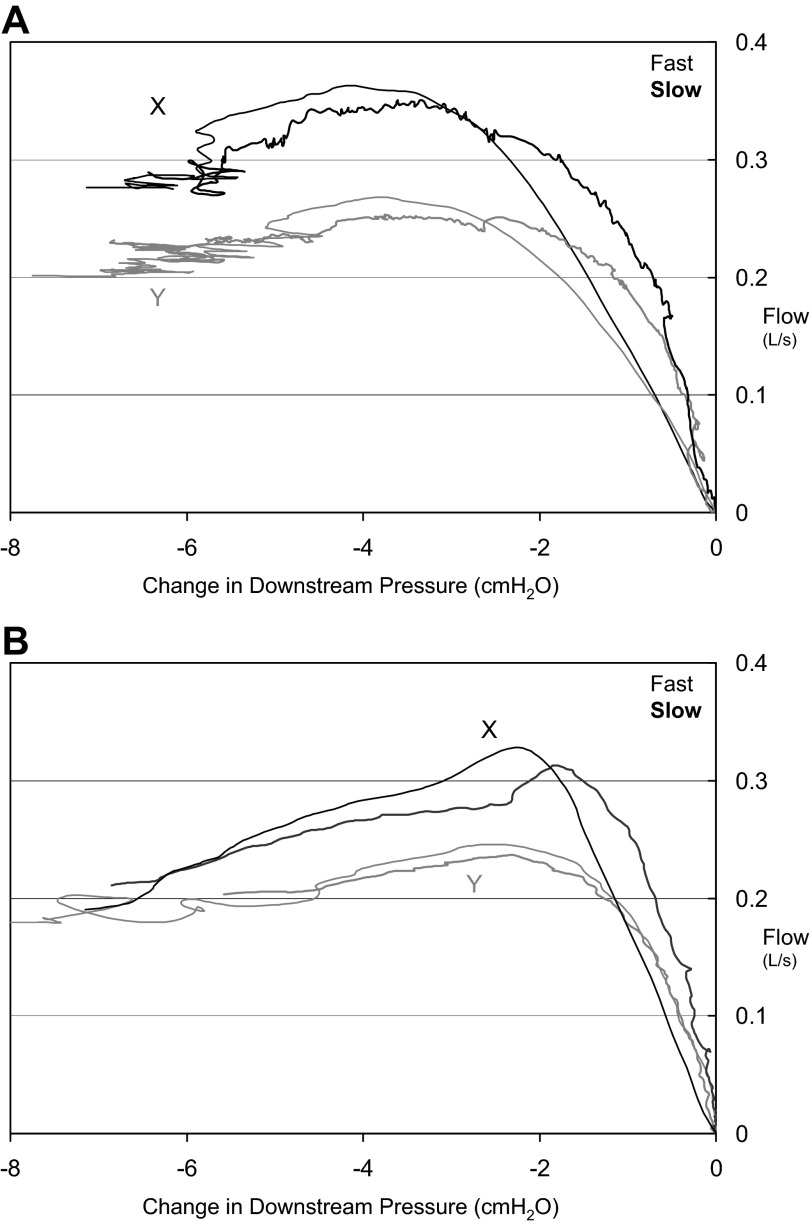
It was often difficult to obtain contiguous fast and slow breaths pairs for a number of reasons: lack of central apnea following hyperventilation, arousal during the maneuver, no airflow limitation, or only a small change in downstream pressure which would limit comparison to other breaths. The number of attempted controlled breaths and those that yielded data are shown in Table 2. One or more of these reasons made it difficult to obtain pairs of fast and slow breaths that were uninterrupted by arousal, which led to very different peak and plateau flows (suggesting a change in the upper airway between controlled breaths). Representative pairs of curves successfully obtained are shown in Fig. 5. In only one subject was peak airflow statistically significantly greater during fast breaths compared with slow breaths, but the magnitude of this difference was small (Table 2).
Table 2.
Peak flow and %negative effort comparison
| Attempted Simulated Breaths |
Successful Breaths |
Peak Flow Comparison (Contiguous Pair Analysis) |
%Negative Effort (Using Common Downstream Pressure) |
Maximum %Negative Effort Dependence (Maximum %NED Seen, and Corresponding Downstream Pressure) |
||||||||||||||
|---|---|---|---|---|---|---|---|---|---|---|---|---|---|---|---|---|---|---|
| Subject No. (Type) | Total | No central apnea | Arousal | No flow limitation | Limited down-stream pressure change | Analyzable breaths | Common down-stream pressure, cmH2O | Slow | Fast | No. of pairs | Slow, l/s | Fast, l/s | Slow, % | Fast, % | Slow, % | Pressure, cmH2O | Fast, % | Pressure, cmH2O |
| 1 (Control) | 76 | 7 | 18 | 28 | 8 | 15 | −4.8 | 8 | 7 | 1 | 0.12 | 0.14 | 18.8 ± 8.9 | 17.0 ± 13.7 | 42.8 | −5 | 64.1 | −5.7 |
| 2 (OSA) | 32 | 8 | 2 | 14 | 3 | 5 | −3.3 | 3 | 2 | 0 | 16.1 ± 8.9 | 24.8 ± 33.8 | 40.8 | −3.7 | 52.3 | −3.4 | ||
| 3 (Control) | 27 | 3 | 4 | 11 | 0 | 9 | −4.1 | 5 | 4 | 1 | 0.09 | 0.08 | 28.1 ± 11.8 | 20.5 ± 6.8 | 56 | −5.3 | 31 | −5 |
| 4 (OSA) | 37 | 4 | 9 | 15 | 5 | 4 | −7.1 | 3 | 2 | 0 | 16.3 ± 17.8 | 12.4 ± 7.9 | 22.8 | −9.8 | 27.8 | −7.6 | ||
| 5 (OSA) | 32 | 4 | 6 | 10 | 6 | 6 | −5.2 | 3 | 3 | 2 | 0.4 | 0.42 | 26.1 ± 21.5 | 21.0 ± 6.2 | 46.9 | −5.2 | 34.6 | −5.6 |
| 6 (Control) | 34 | 2 | 9 | 8 | 4 | 11 | −4.7 | 3 | 8 | 6 | 0.25 | 0.26 | 4.8 ± 3.7 | 12.9 ± 12.5 | 29.6 | −8.2 | 42.6 | −6.8 |
| 7 (Control) | 46 | 0 | 6 | 6 | 6 | 28 | −4.6 | 9 | 17 | 4 | 0.25 | 0.27* | 18.1 ± 9.0 | 22.0 ± 15.0 | 35 | −5.6 | 56 | −5.6 |
| 8 (OSA) | 50 | 2 | 17 | 6 | 15 | 10 | −6.5 | 3 | 7 | 1 | 0.14 | 0.15 | 49.8 ± 32.5 | 27.7 ± 16.7 | 83 | −6.5 | 70 | −7.9 |
| Average | 41.8 | 11 | −5.0 | 22.3 | 19.8 | 44.6 | 47.3 | |||||||||||
NED, negative effort dependence.
Peak flow (see boldface) is only statistically significant different (P < 0.05) in one subject.
Fig. 5.
A: pair of fast (thin lines) and slow (bold lines) breaths from two time points (X and Y) during the night in a control subject (6). Note that fast breaths do not produce substantially higher peak flow. B: similarly, pairs of fast (thin lines) and slow (bold lines) breaths from two time points (X and Y) during the night in a control subject (7). In this second example, there is moderate negative effort dependence with a drop from peak flow of ∼30% with increasing effort.
Percent negative effort dependence.
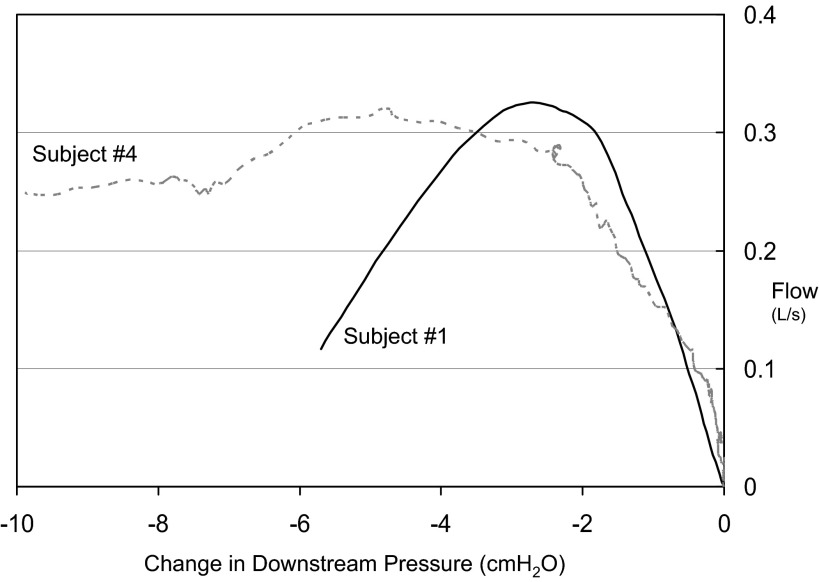
All subjects exhibited some degree of NED. In fact, even when the analysis was restricted to a modest common downstream pressure the average %NED was ∼21%, although the amount was variable (range: 4.8 - 49.8%) (see Fig. 6). The degree of NED was not associated with the diagnosis of OSA, with some OSA subjects exhibiting little NED (e.g., subject 4), and some control subjects having substantial changes in flow with effort (e.g., subjects 1 and 3). As can be seen in Figs. 5B, 6, and 7B, there were many instances in which there was no “plateau” flow seen— flow continued to decrease with decreasing negative pressure. Thus the maximal amount of NED could be even more substantial with slightly greater decreases in downstream pressure.
Fig. 6.
While all subjects exhibited some degree of negative effort dependence, there was substantial variability among subjects. Subject 1 (a control) demonstrates >50% negative effort dependence, and there is no clear plateau. In contrast, subject 4, who has obstructive sleep apnea (OSA), shows only ∼20% decrement from peak flow with increased effort, with a clear plateau in airflow. This plateau in flow could be due to anatomy or compensatory inspiratory phasic muscle activation.
Fig. 7.
A: in this control subject (8) with negative effort dependence, airflow rebounds during late inspiration (shaded area) as epiglottic (downstream) pressure subsides. B: increase in airflow generally follows the same curve as early inspiration, with changes perhaps due to hysteresis.
For a given subject, when all breaths across the night were grouped according to fast and slow inspirations, and analyzed for percent negative effort dependence, there was no difference in the degree of negative effort dependence between slow and fast breaths (Table 2).
Off-blip.
Although we were focused on early inspiration, an occasional unexpected finding was the increase in airflow during late inspiration when respiratory effort was decreasing, an “off blip” (Fig. 7). This off blip during late inspiration had a similar flow-pressure relationship as the airway during early inspiration. Although the initial blip demonstrates that increasing effort decreases inspiratory airflow, the off blip shows that the converse is also true: that less effort can increase airflow.
DISCUSSION
The current study tested the hypothesis that the initial peak in inspiratory airflow, or “blip,” during flow-limited breathing is a transient phenomenon due to the dynamic properties of the upper airway walls. However, contrary to the prediction of this hypothesis, the rate of change in the downstream pressure did not cause a change in peak airflow, i.e., we could not draw more flow through the airway with a fast breath compared with a slow breath. This observation leads us to conclude that the blip is not a transient phenomenon, i.e., inertial or viscous effects are essentially negligible, and thus the airway behaves as a purely elastic structure on the time scales tested. The blip, therefore, reflects the intrinsic elastic properties of the upper airway, whereby reduced flow occurs as downstream pressure becomes more negative [i.e., negative effort dependence (NED)]. We also observed an increase in flow toward late inspiration as downstream pressure subsided (the “off blip”), further supporting the view that NED is a mechanical property of the upper airway. The major implication of this finding is that because the blip cannot be dismissed as a transient phenomenon, the magnitude of true NED is much greater than generally appreciated. In the current experiments most subjects had substantial decreases in flow compared with the inspiratory peak airflow (some over >50%) with increasing effort and had no clear “plateau” in airflow. These findings are thus inconsistent with the classical Starling resistor model, at least in these individuals, which predicts little to no NED.
In fact, all of our subjects exhibited NED using our experimental technique. Decreases in airflow occurred with changes in downstream pressure that are similar to the changes seen during flow-limited breathing during sleep. In other words, we did not produce NED by decreasing downstream pressure well below the physiological range. Our data suggest that NED is a property of most upper airways when relatively passive, and can be substantial. However, given the patterns of airflow limitation seen during clinical and research polysomnograms (1), it appears that some patients either truly have Starling resistor flow limitation or appear to have Starling resistor flow patterns (23).
Two of the factors likely to be important in preventing or minimizing NED are mechanical and neural changes that occur during inspiration. The increase in lung volume during inspiration has been shown to decrease upper airway collapsibility, likely through tracheal traction (8, 18). Animal experiments have also shown increases in flow (22) and decreases in extraluminal tissue pressures with tracheal traction (13, 14, 22), and experimental tube models show increased flow with increased strain (2). Neural changes should also promote improvement in the upper airway during inspiration, both through direct activation of muscles as well as other muscles activated by the negative pressure reflex (9). Thus, while we can speculate on the mechanisms that minimize NED, the underlying cause of NED remains unknown.
The classical Starling resistor model posits that the upper airway behaves as a collapsible tube with a single peri-airway pressure. In reality, the upper airway is a complex structure with multiple elements (e.g., soft palate, uvula, tongue, tonsillar tissue, peripharyngeal fat). The substantial NED we see may be a result of one or more of these elements being sucked into the airway, as in our recently proposed “tippy tongue” model (5), or reflect a lack of stabilizing force by inactive or ineffective muscles (e.g., genioglossus, tensor palatini), which show electrical activity but exert minimal mechanical effect (3, 16). However, there are other possibilities, such as abrupt changes in upper airway geometry (folding) (2, 12) or the upper airway behaving like a muscular hydrostat (11). Finally, the upper airway may otherwise have the characteristics of a Starling resistor (a compliant tube with area defined by local pressure), but the extraluminal tissue pressure may not have a single fixed value (although as above, our current understanding of tissue pressure would not explain NED). Most relevant to the current work, all of these alternate models deviate from the classical Starling features of constant flow and/or single effective tissue pressure. Similarly, small amounts of NED (as is often seen in physical Starling resistors) would not draw comment; however, the magnitude of NED in our subjects is substantial.
Our findings have implications for OSA research and perhaps clinical management. As stated above, different groups have used the flows at different inspiratory times to compute Pcrit. Our findings indicate that the blip is a “real” property of the airway walls, in the sense that it is largely independent of dynamics, and not simply a transient phenomenon based on the speed of inspiration. Our work thus supports the use of peak inspiratory flow. Because the blip is not a transient, the downstream pressure at peak flow can be used to measure Pcrit, regardless of the speed of inspiration. However, it also highlights the limited value of Pcrit in some patients. It is likely that Pcrit is extremely important in patients with a Starling resistor-like upper airway; in those individuals, Pcrit alone may be predictive of OSA susceptibility and severity. However, in patients with substantial NED, where airflow is not constant with increasingly negative downstream pressure, we suggest that the Pcrit alone may not be as predictive of OSA susceptibility and severity since both Pcrit and downstream pressure (i.e., respiratory effort) are relevant. This concept will require further study.
Recognition that different individuals have different amounts of NED is important, insofar as it relates to the site and timing of collapse. The upper airway of patients with substantial NED may collapse during inspiration. In such patients, for example, hypoglossal nerve stimulation during inspiration might be particularly effective (24). Conversely, expiratory nasal resistance valves, which are thought to exert their effect primarily during expiration, may be ineffective in those with inspiratory collapse (4, 19). Similarly, pharmacological efforts to improve OSA via augmented respiratory drive, such as acetazolamide, may have variable effects depending on the degree of negative effort dependence. Patients with substantial NED might have decreased ventilation with increased respiratory effort (more negative downstream pressure). In these patients, the balance of forces between upper airway muscles and inspiratory pump muscles will be critical (21). If NED is indeed important in understanding OSA, or in choosing treatments, then recording methods will need to ensure high-fidelity (e.g., minimally filtered) nasal pressure tracings that should easily detect and quantify NED.
Limitations.
There are a number of limitations that must be considered. First, we studied a small number of subjects. However, our major findings are unlikely to change substantially with the study of more subjects. That being said, larger studies across a range of patient populations will be necessary to determine the clinical utility of our findings and potential clinical predictors of negative effort dependence. Second, the experimental conditions were highly artificial. Many of the interventions that we made (administration of a sedative-hypnotic, hyperventilation with noninvasive positive pressure ventilation) should minimize intrinsic inspiratory muscle activity. It may be that during natural inspiration, pharyngeal and tongue muscle serve to open or stiffen the airway, preventing negative effort dependence. However, the flow patterns we observed in the passive airway are similar to those seen on clinical polysomnograms or in other experiments in which respiratory effort is normal or even increased. Additionally, the physiological changes we performed did in many ways mimic natural breathing: lung volume increased during inspiration, and the drop in intrathoracic pressure increased venous return of blood from the neck, all changes that should have improved the upper airway further as downstream pressure decreased. We did not measure muscle activity, as these were already very invasive studies. However, we expect muscle activation to be low during our hyperventilation protocol and, as above, muscle activation should offset NED. Finally, it is possible that flow could exhibit a transient overshoot if downstream pressure fell faster than we tested, but as our tests spanned inspiratory speeds both sub- and supraphysiological, this possibility is of marginal interest.
Conclusion.
This study provides compelling evidence that the initial blip seen during inspiratory airflow limitation is not a transient, but rather reflects the intrinsic elastic properties of the upper airway. The degree of NED in the upper airway must be measured relative to the inspiratory peak and can therefore be much greater than is usually appreciated. As a result, the classical Starling resistor model is not appropriate in those individuals in whom NED is marked. These findings have important implications for understanding and phenotyping upper airway behavior in OSA.
GRANTS
This work was supported by National Heart, Lung, and Blood Institute Grants 5-R01-HL-048531-16, R01-HL-085188-02, R01-HL-090897-01A2, K24-HL-093218-01A1, K23-HL-105542, and P01-HL-095491 and American Heart Association Grants 0840159N and 0575028N. B. A. Edwards was supported by the National Health and Medical Research Council of Australia's C. J. Martin Overseas Biomedical Fellowship (1035115). S. A. Sands is supported by an American Heart Association fellowship (11POST7360012). D. J. Eckert is supported by a National Health and Medical Research Council of Australia R. D. Wright Fellowship (1049814).
DISCLOSURES
D. P. White is Chief Medical Officer of Apnicure, a company which makes a device for the treatment of sleep apnea, and former Chief Medical Officer of Philips Respironics. Other authors (R. L. Owens, A. Malhotra, A. Wellman) have consultancy agreements with industry. However, none of these agreements relate to the subject of the paper. R. L. Owens is a consultant for Apnex and Apnicure, Inc. A. Malhotra received consulting and/or research income from Philips Respironics, SGS, Sleep HealthCenters, Apnex, Apnicure and Pfizer, but has relinquished all outside personal income since May 2012. A. Wellman is a consultant for Philips Respironics, Apnex, SOVA Pharmaceuticals and Apnicure. All other authors do not have a financial relationship with a commercial entity that has an interest in the subject of this manuscript.
AUTHOR CONTRIBUTIONS
Author contributions: R.L.O., B.A.E., S.A.S., and A.W. conception and design of research; R.L.O., B.A.E., S.A.S., D.J.E., and A.W. performed experiments; R.L.O., B.A.E., S.A.S., D.J.E., and A.W. analyzed data; R.L.O., B.A.E., S.A.S., J.P.B., D.J.E., D.P.W., A.M., and A.W. interpreted results of experiments; R.L.O. and B.A.E. prepared figures; R.L.O. and B.A.E. drafted manuscript; R.L.O., B.A.E., S.A.S., J.P.B., D.J.E., D.P.W., A.M., and A.W. edited and revised manuscript; R.L.O., B.A.E., S.A.S., J.P.B., D.J.E., D.P.W., A.M., and A.W. approved final version of manuscript.
ACKNOWLEDGMENTS
We thank sleep technicians L. Hess, P. DeYoung, and E. Smales for laboratory assistance in acquiring these data.
REFERENCES
- 1.Aittokallio T, Saaresranta T, Polo-Kantola P, Nevalainen O, Polo O. Analysis of inspiratory flow shapes in patients with partial upper-airway obstruction during sleep. Chest 119: 37–44, 2001 [DOI] [PubMed] [Google Scholar]
- 2.Amatoury J, Kairaitis K, Wheatley JR, Bilston LE, Amis TC. Onset of airflow limitation in a collapsible tube model: impact of surrounding pressure, longitudinal strain, and wall folding geometry. J Appl Physiol 109: 1467–1475, 1985 [DOI] [PubMed] [Google Scholar]
- 3.Bilston LE, Gandevia SC. Biomechanical properties of the human upper airway and their effect on its behavior during breathing and in obstructive sleep apnea. J Appl Physiol 116: 314–324, 2014 [DOI] [PubMed] [Google Scholar]
- 4.Braga CW, Chen Q, Burschtin O, Rapoport DM, Ayappa I. Changes in lung volume and upper airway using MRI during application of nasal expiratory positive airway pressure in patients with sleep disordered breathing. J Appl Physiol 111: 1400–1409, 2011 [DOI] [PubMed] [Google Scholar]
- 5.Butler JP, Owens RL, Malhotra A, Wellman A. CrossTalk opposing view: The human upper airway during sleep does not behave like a Starling resistor. J Physiol 591: 2233–2234, 2013 [DOI] [PMC free article] [PubMed] [Google Scholar]
- 6.Gleadhill IC, Schwartz AR, Schubert N, Wise RA, Permutt S, Smith PL. Upper airway collapsibility in snorers and in patients with obstructive hypopnea and apnea. Am Rev Respir Dis 143: 1300–1303, 1991 [DOI] [PubMed] [Google Scholar]
- 7.Gold AR, Schwartz AR. The pharyngeal critical pressure. The why's and how's of using nasal continuous positive airway pressure diagnostically. Chest 110: 1077–1088, 1996 [DOI] [PubMed] [Google Scholar]
- 8.Hillman DR, Walsh JH, Maddison KJ, Platt PR, Schwartz AR, Eastwood PR. The effect of diaphragm contraction on upper airway collapsibility. J Appl Physiol 115: 337–345, 2013 [DOI] [PubMed] [Google Scholar]
- 9.Horner RL. Motor control of the pharyngeal musculature and implications for the pathogenesis of obstructive sleep apnea. Sleep 19: 827–853, 1996 [DOI] [PubMed] [Google Scholar]
- 10.Jordan AS, McSharry DG, Malhotra A. Adult obstructive sleep apnoea. Lancet. 2013. August 1 pii: S0140-6736(13)60734-5. 10.1016/S0140-6736(13)60734-5 [Epub ahead of print] [DOI] [PMC free article] [PubMed] [Google Scholar]
- 11.Kairaitis K. Is the pharynx a muscular hydrostat? Med Hypotheses 74: 590–595, 2010 [DOI] [PubMed] [Google Scholar]
- 12.Kairaitis K. Pharyngeal wall fold influences on the collapsibility of the pharynx. Med Hypotheses 79: 372–376, 2012 [DOI] [PubMed] [Google Scholar]
- 13.Kairaitis K, Byth K, Parikh R, Stavrinou R, Wheatley JR, Amis TC. Tracheal traction effects on upper airway patency in rabbits: the role of tissue pressure. Sleep 30: 179–186, 2007 [DOI] [PubMed] [Google Scholar]
- 14.Kairaitis K, Verma M, Amatoury J, Wheatley JR, White DP, Amis TC. A threshold lung volume for optimal mechanical effects on upper airway airflow dynamics: studies in an anesthetized rabbit model. J Appl Physiol 112: 1197–1205, 2012 [DOI] [PubMed] [Google Scholar]
- 15.Kirkness JP, Schwartz AR, Schneider H, Punjabi NM, Maly JJ, Laffan AM, McGinley BM, Magnuson T, Schweitzer M, Smith PL, Patil SP. Contribution of male sex, age, and obesity to mechanical instability of the upper airway during sleep. J Appl Physiol 104: 1618–1624, 2008 [DOI] [PMC free article] [PubMed] [Google Scholar]
- 16.Loewen AH, Ostrowski M, Laprairie J, Maturino F, Hanly PJ, Younes M. Response of genioglossus muscle to increasing chemical drive in sleeping obstructive apnea patients. Sleep 34: 1061–1073, 2011 [DOI] [PMC free article] [PubMed] [Google Scholar]
- 17.Owens RL, Edwards BA, Sands SA, Butler JP, Eckert DJ, White DP, Malhotra A, Wellman A. Upper airway collapsibility and patterns of flow limitation at constant end-expiratory lung volume. J Appl Physiol 113: 691–699, 2012 [DOI] [PMC free article] [PubMed] [Google Scholar]
- 18.Owens RL, Malhotra A, Eckert DJ, White DP, Jordan AS. The influence of end-expiratory lung volume on measurements of pharyngeal collapsibility. J Appl Physiol 108: 445–451, 2010 [DOI] [PMC free article] [PubMed] [Google Scholar]
- 19.Patel AV, Hwang D, Masdeu MJ, Chen GM, Rapoport DM, Ayappa I. Predictors of response to a nasal expiratory resistor device and its potential mechanisms of action for treatment of obstructive sleep apnea. J Clin Sleep Med 7: 13–22, 2011 [PMC free article] [PubMed] [Google Scholar]
- 20.Patil SP, Punjabi NM, Schneider H, O'Donnell CP, Smith PL, Schwartz AR. A simplified method for measuring critical pressures during sleep in the clinical setting. Am J Respir Crit Care Med 170: 86–93, 2004 [DOI] [PubMed] [Google Scholar]
- 21.Remmers JE, deGroot WJ, Sauerland EK, Anch AM. Pathogenesis of upper airway occlusion during sleep. J Appl Physiol 44: 931–938, 1978 [DOI] [PubMed] [Google Scholar]
- 22.Rowley JA, Permutt S, Willey S, Smith PL, Schwartz AR. Effect of tracheal and tongue displacement on upper airway airflow dynamics. J Appl Physiol 80: 2171–2178, 1996 [DOI] [PubMed] [Google Scholar]
- 23.Saboisky JP, Butler JE, Fogel RB, Taylor JL, Trinder JA, White DP, Gandevia SC. Tonic and phasic respiratory drives to human genioglossus motoneurons during breathing. J Neurophysiol 95: 2213–2221, 2006 [DOI] [PubMed] [Google Scholar]
- 24.Schwartz AR, Barnes M, Hillman D, Malhotra A, Kezirian E, Smith PL, Hoegh T, Parrish D, Eastwood PR. Acute upper airway responses to hypoglossal nerve stimulation during sleep in obstructive sleep apnea. Am J Respir Crit Care Med 185: 420–426, 2012 [DOI] [PMC free article] [PubMed] [Google Scholar]
- 25.Schwartz AR, Gold AR, Schubert N, Stryzak A, Wise RA, Permutt S, Smith PL. Effect of weight loss on upper airway collapsibility in obstructive sleep apnea. Am Rev Respir Dis 144: 494–498, 1991 [DOI] [PubMed] [Google Scholar]
- 26.Schwartz AR, Schubert N, Rothman W, Godley F, Marsh B, Eisele D, Nadeau J, Permutt L, Gleadhill I, Smith PL. Effect of uvulopalatopharyngoplasty on upper airway collapsibility in obstructive sleep apnea. Am Rev Respir Dis 145: 527–532, 1992 [DOI] [PubMed] [Google Scholar]
- 27.Schwartz AR, Smith PL, Wise RA, Gold AR, Permutt S. Induction of upper airway occlusion in sleeping individuals with subatmospheric nasal pressure. J Appl Physiol 64: 535–542, 1988 [DOI] [PubMed] [Google Scholar]
- 28.Smith PL, Wise RA, Gold AR, Schwartz AR, Permutt S. Upper airway pressure-flow relationships in obstructive sleep apnea. J Appl Physiol 64: 789–795, 1988 [DOI] [PubMed] [Google Scholar]
- 29.Walsh JH, Maddison KJ, Platt PR, Hillman DR, Eastwood PR. Influence of head extension, flexion, and rotation on collapsibility of the passive upper airway. Sleep 31: 1440–1447, 2008 [PMC free article] [PubMed] [Google Scholar]


