

Abstract
Objectives. We compared chronic liver disease (CLD) mortality from 1999 to 2009 between American Indians and Alaska Natives (AI/ANs) and Whites in the United States after improving CLD case ascertainment and AI/AN race classification.
Methods. We defined CLD deaths and causes by comprehensive death certificate-based diagnostic codes. To improve race classification, we linked US mortality data to Indian Health Service enrollment records, and we restricted analyses to Contract Health Service Delivery Areas and to non-Hispanic populations. We calculated CLD death rates (per 100 000) in 6 geographic regions. We then described trends using linear modeling.
Results. CLD mortality increased from 1999 to 2009 in AI/AN persons and Whites. Overall, the CLD death rate ratio (RR) of AI/AN individuals to Whites was 3.7 and varied by region. The RR was higher in women (4.7), those aged 25 to 44 years (7.4), persons residing in the Northern Plains (6.4), and persons dying of cirrhosis (4.0) versus hepatocellular carcinoma (2.5), particularly those aged 25 to 44 years (7.7).
Conclusions. AI/AN persons had greater CLD mortality, particularly from premature cirrhosis, than Whites, with variable mortality by region. Comprehensive prevention and care strategies are urgently needed to stem the CLD epidemic among AI/AN individuals.
In 2009, chronic liver disease (CLD) was classified as the fifth leading cause of death among American Indians and Alaska Natives (AI/ANs), accounting for 4.8% of AI/AN deaths.1 A 2004 mortality study used a broader set of disease codes from the International Classification of Diseases, Ninth Revision (ICD-9) than was used in the National Vital Statistics System (NVSS) to define a CLD death, and reported an AI/AN age-adjusted death rate more than twice that of other races.2
Few US population-based studies of CLD have described its prevalence among AI/AN persons.3 Two studies found that 4.9% to 7.2% of patients in 3 facilities serving AI/AN populations had clinically confirmed CLD.4,5 Both identified alcoholic liver disease (ALD), chronic HCV infection, and nonalcoholic fatty liver disease (NAFLD) as the most common contributing causes.
Multiple factors limit the precision of AI/AN mortality estimates. First, racial misclassification of AI/AN individuals can affect mortality data and subsequent surveillance estimates.6,7 In cancer incidence studies, the Indian Health Service (IHS) has improved race classification by linking surveillance data with IHS patient enrollment records and restricting analyses to counties where AI/AN race is more accurately classified.6 In addition, previously used ICD-based CLD definitions have underestimated CLD cases in death records.8 A 2004 mortality study provided improved estimates of CLD deaths from 1990 to 1998 with inclusion of viral hepatitis disease codes.2 Since then, an even more comprehensive ICD-based definition of CLD has provided more accurate estimates of clinically confirmed CLD deaths,8,9 but has not yet been used in national mortality studies.
In this study, we employed a comprehensive ICD-based definition of CLD deaths and used established techniques to improve race classification to accurately describe disparities and compare trends in CLD mortality from 1999 to 2009 between AI/AN persons and Whites in the United States.
METHODS
Detailed methods for analytical mortality file creation are described elsewhere in this supplement.10
Population Estimates
Denominators for the calculation of death rates were derived from bridged single-race population estimates developed by the US Census Bureau and the National Center for Health Statistics (NCHS), a part of the Centers for Disease Control and Prevention (CDC).11 Denominators were adjusted for population shifts caused by Hurricanes Katrina and Rita in 2005.11,12 The bridging of multiple races that may be reported per decedent since 2000 into 1 single recorded race enabled comparison of racial/ethnic population estimates for the entire study period.13
Death Records
Data from the NVSS includes all conditions and diseases reported on death certificates. These include the underlying cause of death, which is the single disease or injury that initiated the train of events leading to death, and up to 20 additional “contributing causes of death.”14 Together, these form the multiple causes of death (MCOD) contained in the US Multiple-Cause Mortality Files.
Death certificate data are compiled by states and reported to the NCHS, where they are de-identified and released publicly as the National Death Index (NDI), a national file with underlying and multiple cause of death fields, state of residence, age, gender, race, and ethnicity.15 The NCHS and Census Bureau apply nearly identical bridging algorithms to assign a single race to decedents with multiple races reported on death certificates.13 For this study, we linked the NDI with the IHS patient registration database to increase identification of AI/AN persons and to determine vital status and cause of death of decedents who received health care in IHS or tribal facilities.10 After linkage, a flag indicating a positive link to IHS was added as an additional indicator of AI/AN ancestry to the Multiple-Cause Mortality Files. We combined this file with the population estimates to create an analytical file in SEER *Stat (National Cancer Institute, Washington, DC; AI/AN–US Mortality Database [AMD]) for this article. During preliminary analyses, it was discovered that the updated bridged intercensal population estimates significantly overestimated AI/AN populations of Hispanic origin.16 Therefore, to avoid underestimating death rates in AI/AN populations, we limited all analyses to non-Hispanic AI/AN populations. Non-Hispanic White was chosen as the most homogenous referent group. Thus, all analyses were limited to non-Hispanic persons. Henceforth in this article, the term non-Hispanic is omitted when discussing both groups.
For deaths from 1999 to 2009, we used International Classification of Diseases, Tenth Revision (ICD-10) codes to define underlying or contributing causes. ICD-10 codes for CLD were modified from a study conducted in the Kaiser Permanente Medical Care Program of Northern California (KPNC),8 in which 83% of CLD cases identified by the comprehensive ICD-10 code list had clinically defined CLD verified by medical chart review. Thirty-eight ICD-10 codes considered in the KPNC study were excluded from our study either because they had poor reliability in predicting chart review-confirmed CLD or because they did not contribute to CLD cases in that study (unpublished observations). The resulting set of ICD-10 codes had a positive predictive value of 85% for clinically defined CLD in the KPNC medical record. For our study, a death caused by CLD was defined as any death with 1 of the following ICD-10 codes listed as the underlying cause: ALD (K70.0–K70.4, K70.9); toxic liver disease (K71.0–K71.9); liver failure (K72.0–K72.1, K72.9); chronic hepatitis (K73.0–K73.2, K73.8–K73.9); cirrhosis (K74.0–K74.6); other inflammatory liver diseases (K75.1–K75.3, K75.8–K75.9); other liver diseases (K76.0–K76.9); hepatitis B virus (HBV) infection (B16.0–B16.2, B16.9, B17.0, B18.0, B18.1); HCV infection (B17.1, B18.2); other or unspecified viral hepatitis (B17.2, B17.8, B17.9, B18.8, B18.9, B19.0, B19.9); sequelae of viral hepatitis (B94.2); and primary liver cancers (C22.0, C22.9). These data are available as a supplement to the online version of this article at http://www.ajph.org.
Geographic Coverage
We compared CLD death rates by county type and IHS region. County type was described as all counties and Contract Health Service Delivery Area or Tribal Service Delivery Area counties (collectively abbreviated as CHSDA counties). CHSDA counties contain or are adjacent to federally recognized tribal reservations or off-reservation trust.10 AI/AN persons must reside in CHSDA counties to qualify for contract health services not available at IHS and tribal health facilities. Previous linkage studies indicated significantly less misclassification of AI/AN race in CHSDA counties.10,17 Fifty-six percent of the US AI/AN population resides in the 637 CHSDA counties, which represent 20% of the 3141 US counties. Despite being less geographically representative, most analyses were restricted to CHSDA counties for more accurate AI/AN mortality estimates.
Analyses were conducted for all regions combined and for the following individual IHS regions: Northern Plains, Alaska, Southern Plains, Southwest, Pacific Coast, and East.10 Similar regional analyses were used for other AI/AN health-related publications.6,18,19 Additional details about CHSDA counties and IHS regions, including population coverage, are provided elsewhere (Table 1).10
TABLE 1—
Age–Adjusted Death Rates for Chronic Liver Disease, by Indian Health Service Region, and Gender for American Indians/Alaska Natives and Whites: United States, 1999–2009
| CHSDA Counties |
All Counties |
|||||||||
| IHS Region/Gender | AI/AN Count | AI/AN Rate | White Count | White Rate | AI/AN:White RR (95% CI) | AI/AN Count | AI/AN Rate | White Count | White Rate | AI/AN:White RR (95% CI) |
| Northern Plains | ||||||||||
| Male and female | 1771 | 86.5 | 13 229 | 13.5 | 6.4* (6.1, 6.8) | 2328 | 69.2 | 66 697 | 14.2 | 4.9* (4.6, 5.1) |
| Male | 951 | 98.3 | 8350 | 18.2 | 5.4* (5.0, 5.8) | 1235 | 76.7 | 41 789 | 19.4 | 4.0* (3.7, 4.2) |
| Female | 820 | 76.2 | 4879 | 9.2 | 8.3* (7.6, 8.9) | 1093 | 62.3 | 24 908 | 9.7 | 6.4* (6.0, 6.8) |
| Alaska | ||||||||||
| Male and female | 333 | 39.1 | 774 | 16.9 | 2.3* (2.0, 2.7) | 333 | 39.1 | 774 | 16.9 | 2.3* (2.0, 2.7) |
| Male | 126 | 32.3 | 515 | 21.7 | 1.5* (1.2, 1.8) | 126 | 32.3 | 515 | 21.7 | 1.5* (1.2, 1.8) |
| Female | 207 | 45.6 | 259 | 11.8 | 3.9* (3.2, 4.7) | 207 | 45.6 | 259 | 11.8 | 3.9* (3.2, 4.7) |
| Southern Plains | ||||||||||
| Male and female | 1500 | 53.9 | 7207 | 19.2 | 2.8* (2.6, 3.0) | 1755 | 46.1 | 38 455 | 18.8 | 2.4* (2.3, 2.6) |
| Male | 898 | 68.1 | 4650 | 26.6 | 2.6* (2.4, 2.8) | 1047 | 57 | 24 790 | 25.9 | 2.2* (2.1, 2.4) |
| Female | 602 | 41.3 | 2557 | 12.6 | 3.3* (3.0, 3.6) | 708 | 36.1 | 13 665 | 12.4 | 2.9* (2.7, 3.1) |
| Southwest | ||||||||||
| Male and female | 3031 | 77.9 | 16 410 | 19.3 | 4.0* (3.9, 4.2) | 3189 | 74.5 | 24 748 | 17.7 | 4.2* (4.0, 4.4) |
| Male | 1746 | 96.5 | 10 701 | 26.2 | 3.7* (3.5, 3.9) | 1828 | 91.1 | 15 984 | 24 | 3.8* (3.6, 4.0) |
| Female | 1285 | 62.1 | 5709 | 12.8 | 4.8* (4.5, 5.1) | 1361 | 60.1 | 8764 | 12 | 5.0* (4.7, 5.3) |
| Pacific Coast | ||||||||||
| Male and female | 1629 | 64 | 33 888 | 18.9 | 3.4* (3.2, 3.6) | 2160 | 56.5 | 63 243 | 18.8 | 3.0* (2.9, 3.1) |
| Male | 934 | 76.7 | 21 924 | 25.6 | 3.0* (2.8, 3.2) | 1255 | 68.1 | 40 896 | 25.5 | 2.7* (2.5, 2.8) |
| Female | 695 | 52.8 | 11 964 | 12.7 | 4.2* (3.8, 4.5) | 905 | 46.1 | 22 347 | 12.6 | 3.7* (3.4, 3.9) |
| East | ||||||||||
| Male and female | 382 | 40 | 32 521 | 17.6 | 2.3* (2.0, 2.5) | 1067 | 19.3 | 240 714 | 16.9 | 1.1* (1.1, 1.2) |
| Male | 225 | 50 | 21 167 | 25.1 | 2.0* (1.7, 2.3) | 637 | 23.8 | 155 325 | 23.9 | 1.0 (0.9, 1.1) |
| Female | 157 | 31.7 | 11 354 | 11.1 | 2.8* (2.4, 3.3) | 430 | 15.3 | 85 389 | 10.9 | 1.4*(1.3, 1.6) |
| Total | ||||||||||
| Male and female | 8646 | 66.1 | 104 029 | 17.6 | 3.7* (3.7, 3.8) | 10 832 | 49.9 | 434 631 | 16.9 | 3.0* (2.9, 3.0) |
| Male | 4880 | 78.9 | 67 307 | 24.3 | 3.2* (3.1, 3.4) | 6128 | 58.8 | 279 299 | 23.4 | 2.5* (2.4, 2.6) |
| Female | 3766 | 54.9 | 36 722 | 11.6 | 4.7* (4.6, 4.9) | 4704 | 41.8 | 155 332 | 11.1 | 3.8* (3.7, 3.9) |
Note. AI/AN = American Indian/Alaska Native; CHSDA = Contract Health Service Delivery Area; CI = confidence interval; IHS = Indian Health Service; RR = rate ratio. Previously published chronic liver disease definition8 using International Classification of Diseases, 10th Revision codes for underlying cause of death modified for use in this study. Analyses are limited to persons of non-Hispanic origin. AI/AN race is reported from death certificates or through linkage with the IHS patient registration database. Rates are per 100 000 persons and are age-adjusted to the 2000 US standard population (11 age groups; Census P25–1130). IHS regions are defined as follows: Alaskaa; Northern Plains (IL, IN,a IA,a MA,a MN,a MT,a NE,a ND,a SD,a WI,a WYa); Southern Plains (OK,a KS,a TXa); Southwest (AZ,a CO,a NV,a NM,a UTa); Pacific Coast (CA,a ID,a OR,a WA,a HI); East (AL,a AR, CT,a DE, FL,a GA, KY, LA,a ME,a MD, MA,a MS,a MO, NH, NJ, NY,a NC,a OH, PA,a RI,a SC,a TN, VT, VA, WV, DC, IL, IN,a IA,a MIa). RRs are calculated in SEER*Stat before rounding of rates and may not equal rate ratios calculated from rates presented in the table.
Source. AI/AN Mortality Supplement Database (AMD 1990–2009).
Identifies states with at least 1 county designated as CHSDA. Percent regional coverage of AI/AN persons in CHSDA counties to AI/AN persons in all counties: Alaska = 100%; East = 14.9%; Northern Plains = 55.0%; Southern Plains = 58.0%; Pacific Coast = 54.1%; Southwest = 84.8%.
P < .05.
Statistical Methods
Gender-specific, age-adjusted, and age-specific death rates (per 100 000 persons), are presented for deaths with CLD as the underlying cause. Age-specific death rates were calculated by age group: younger than 25 years, 25 to 44 years, 45 to 64 years, 65 to 84 years, and 85 years or older. We classified CLD deaths as either being caused by hepatocellular carcinoma (HCC) or cirrhosis, as previously described.8 Cases with a primary liver cancer code listed as the underlying cause were considered to be attributable to HCC, whereas all non-HCC cases were considered attributable to cirrhosis.8 MCOD data were utilized to assign 1 or more CLD causes (ALD, HCV, or HBV) to CLD deaths. These causes constitute a substantial US public health burden, especially among AI/AN populations.2–5
All rates were directly age adjusted, using SEER *Stat software, to the 2000 US standard population (Census P25–1130) using 11 age groups.20 Using the age-adjusted death rates, standardized rate ratios (RRs) were calculated for AI/AN populations using rates among Whites for comparison. RRs were calculated by SEER *Stat and were rounded for presentation in the tables. Ninety-five percent confidence intervals (CIs) for age-adjusted rates and RRs were calculated based on methods described by Tiwari et al.21 using SEER *Stat 8.0.2. Differences in gender distribution between AI/AN and White CLD deaths were assessed by the Pearson χ2 test. Temporal changes in annual age-adjusted death rates were assessed with joinpoint regression techniques using statistical software developed by the National Cancer Institute.22
RESULTS
Figure 1 shows linear modeling of CLD mortality trends from 1999 to 2009. Age-adjusted CLD mortality increased overall by 24.1% among AI/AN persons and 14.2% among Whites. Age-adjusted death rates increased a mean of 2.2% each year among AI/AN persons from 1999 to 2009 (95% CI = 1.2, 3.2), a mean of 2.5% each year among Whites from 1999 to 2002 (95% CI = 0.7, 4.2), and 0.9% each year among Whites from 2002 to 2009 (95% CI = 0.4, 1.3).
FIGURE 1—

Trends in annual age–adjusted chronic liver disease death rates in CHSDA Counties, for both genders, among American Indians and Alaska Natives and Whites: United States, 1999–2009.
Note. AI/AN = American Indian/Alaska Native; APC = annual percent change; CI = confidence interval; NHW = Non-Hispanic White. Previously published chronic liver disease definition8 using International Classification of Diseases, 10th Revision codes for underlying cause of death modified for use in this study. Death rates are per 100 000 persons and are age-adjusted to the 2000 US standard population (11 age groups; Census P25–1130). American Indian/Alaska Native race is reported from death certificates or through linkage with the Indian Health Services (IHS) patient registration database. Analyses are limited to persons of non-Hispanic origin.
Age-Adjusted Mortality by Region and Gender
From 1999 to 2009, we identified 10 832 deaths among AI/AN persons and 434 631 deaths among Whites attributable to CLD in all counties, representing 6.7% of all deaths in AI/AN persons and 2.0% of all deaths in Whites (Table 1). In this period, 8646 deaths among AI/ANs and 104 029 deaths among Whites attributable to CLD were found in CHSDA counties. Significant disparities in CLD mortality between AI/ANs and Whites were noted across every IHS region in analyses of all counties and CHSDA counties. Overall, CLD death rates in AI/AN persons varied substantially between CHSDA (66.1; 95% CI = 64.7, 67.6) and all counties estimates (49.9; 95% CI = 48.9, 50.9). However, variation among rates among Whites was negligible (CHSDA: 17.6; 95% CI = 17.5, 17.8 vs all counties: 16.9; 95% CI = 16.8, 16.9).
Focusing on CHSDA counties, total age-adjusted mortality varied substantially by region among AI/AN individuals, with highest rates in the Northern Plains (86.5; 95% CI = 82.3, 90.9) and the Southwest (77.9; 95% CI = 75.1, 80.9; Table 1). Overall rates were higher among men (78.9; 95% CI = 76.6, 81.3) than women (54.9; 95% CI = 53.1, 56.7), with similar differences regionally. However, when comparing AI/AN persons with Whites by gender, AI/AN women had a greater risk of CLD death than White women (RR = 4.7; 95% CI = 4.6, 4.9). AI/AN men had a significantly higher risk than White men (RR = 3.2; 95% CI = 3.1, 3.4), although with less of a disparity than among women. The highest regional, gender-specific death rates were noted among AI/AN men in the Northern Plains (98.3; 95% CI = 91.5, 105.5) and the Southwest (96.5; 95% CI = 91.8, 101.3). Among Whites, little regional variation in mortality was found.
Again in CHSDA counties, overall, AI/AN persons were nearly 4 times more likely to die from CLD than Whites (RR = 3.7; 95% CI = 3.7, 3.8; Table 1). In the Northern Plains, where disparities were greatest, AI/ANs were more than 6 times more likely to die from CLD than Whites (RR = 6.4; 95% CI = 6.1, 6.8), and AI/AN women were more than 8 times more likely to die than White women (RR = 8.3; 95% CI = 7.6, 8.9). In the Southwest, AI/ANs were 4 times more likely to die of CLD than Whites (RR = 4.0; 95% CI = 3.9, 4.2), and AI/AN women were almost 5 times more likely to die than White women (RR = 4.8; 95% CI = 4.5, 5.1). Significant disparities in gender-specific mortality were noted in every CHSDA region, with women at higher risk than men.
Age-Specific Mortality by Region
CLD death rates among AI/AN persons were significantly higher than among Whites across all adult ( ≥ 25 years) age groups (Table 2). Although CLD death rates were highest in AI/AN persons aged 85 years or more (163.6; 95% CI = 138.7, 191.7), disparities versus Whites were highest among persons aged 25 to 44 years; AI/AN persons of these ages were more than 7 times more likely to die from CLD than Whites (RR = 7.4; 95% CI = 7.1, 7.8). Among persons aged 25 to 44 years, AI/AN persons had a significantly higher proportion of CLD deaths among women than men (43.5% vs 37.6%; P < .001). Disparities in this age group were highest for AI/AN women, who were more than 8 times more likely to die from CLD than White women (RR = 8.3; 95% CI = 7.7, 8.9). Similarly, greater disparities between AI/AN individuals and Whites were found within the youngest adult age group in every IHS region, most notably in the Northern Plains; there, among those ages 25 to 44 years, AI/AN men were more than 11 times more likely to die from CLD than White men (RR = 11.7; 95% CI = 10.0, 13.5), and AI/AN women were 15 times more likely to die than White women (RR = 15.3; 95% CI = 13.0, 18.0).
TABLE 2—
Age-Specific Death Rates for Chronic Liver Disease, by Indian Health Service Region for American Indians/Alaska Natives and Whites: CHSDA Counties, United States, 1999–2009
| Men in CHSDA Counties |
Women in CHSDA Counties |
Total in CHSDA Counties |
|||||||
| IHS Region/Age, y | AI/AN Rate | White Rate | AI/AN:White RR (95% CI) | AI/AN Rate | White Rate | AI/AN:White RR (95% CI) | AI/AN Rate | White Rate | AI/AN:White RR (95% CI) |
| Northern Plains | |||||||||
| 25–44 | 67.5 | 5.8 | 11.7* (10.0, 13.5) | 60.0 | 3.9 | 15.3 (13.0, 18.0) | 63.6 | 4.9 | 13.1* (11.7, 14.6) |
| 45–64 | 226.1 | 37.3 | 6.1* (5.5, 6.6) | 156.1 | 14.5 | 10.8 (9.6, 12.0) | 189.5 | 25.9 | 7.3* (6.8, 7.8) |
| 65–84 | 219.9 | 62.3 | 3.5* (2.9, 4.2) | 181.0 | 36.4 | 5.0 (4.2, 5.9) | 197.7 | 48.1 | 4.1* (3.6, 4.6) |
| ≥ 85 | 213.9 | 79.2 | 2.7* (1.1, 5.6) | 211.6 | 47.0 | 4.5 (2.6, 7.3) | 212.3 | 56.8 | 3.7* (2.4, 5.6) |
| Alaska | |||||||||
| 25–44 | 17.0 | 5.4 | 3.1* (1.9, 5.2) | 41.0 | 6.6 | 6.2 (4.2, 9.2) | 29.0 | 6.0 | 4.8* (3.6, 6.6) |
| 45–64 | 61.9 | 44.1 | 1.4* (1.1, 1.8) | 90.3 | 21.4 | 4.2 (3.2, 5.5) | 76.3 | 33.7 | 2.3* (1.9, 2.7) |
| 65–84 | 112.7 | 77.3 | 1.5 (0.9, 2.2) | 98.3 | 37.4 | 2.6 (1.7, 4.1) | 104.3 | 57.5 | 1.8* (1.3, 2.4) |
| ≥ 85 | 57.3 | 109.3 | 0.5 (0.0, 3.6) | 135.1 | 57.1 | 2.4 (0.6, 7.4) | 110.2 | 75.0 | 1.5 (0.5, 3.7) |
| Southern Plains | |||||||||
| 25–44 | 34.5 | 9.6 | 3.6* (3.0, 4.3) | 21.0 | 5.0 | 4.2 (3.3, 5.4) | 27.6 | 7.3 | 3.8* (3.2, 4.4) |
| 45–64 | 164.5 | 62.7 | 2.6* (2.4, 2.9) | 79.2 | 25.3 | 3.1 (2.8, 3.6) | 119.9 | 43.7 | 2.7* (2.5, 3.0) |
| 65–84 | 162.8 | 75.5 | 2.2* (1.8, 2.5) | 132.2 | 42.0 | 3.2 (2.7, 3.7) | 145.6 | 56.8 | 2.6* (2.3, 2.9) |
| ≥ 85 | 193.6 | 86.0 | 2.3* (1.2, 4.0) | 164.9 | 49.2 | 3.3 (2.2, 5.0) | 173.2 | 60.3 | 2.9* (2.0, 4.0) |
| Southwest | |||||||||
| 25–44 | 86.3 | 9.3 | 9.3* (8.4, 10.4) | 52.4 | 5.8 | 9.0 (7.8, 10.3) | 68.7 | 7.6 | 9.1* (8.3, 9.9) |
| 45–64 | 205.9 | 62.2 | 3.3* (3.1, 3.6) | 118.0 | 24.8 | 4.8 (4.3, 5.2) | 158.3 | 43.2 | 3.7* (3.5, 3.9) |
| 65–84 | 195.8 | 75.2 | 2.6* (2.3, 3.0) | 156.0 | 42.0 | 3.7 (3.3, 4.2) | 173.1 | 57.6 | 3.0* (2.7, 3.3) |
| ≥ 85 | 187.2 | 78.7 | 2.4* (1.5, 3.7) | 167.6 | 56.8 | 2.9 (2.0, 4.2) | 174.6 | 64.5 | 2.7* (2.0, 3.6) |
| Pacific Coast | |||||||||
| 25–44 | 42.8 | 7.9 | 5.4* (4.6, 6.3) | 31.9 | 5.4 | 5.9 (4.9, 7.1) | 37.2 | 6.7 | 5.6* (4.9, 6.3) |
| 45–64 | 181.3 | 61.6 | 2.9* (2.7, 3.2) | 109.1 | 25.6 | 4.3 (3.8, 4.7) | 143.6 | 43.4 | 3.3* (3.1, 3.5) |
| 65–84 | 181.3 | 75.9 | 2.4* (2.0, 2.8) | 155.0 | 42.2 | 3.7 (3.1, 4.3) | 167.1 | 57.6 | 2.9* (2.6, 3.3) |
| ≥ 85 | 213.7 | 70.0 | 3.1* (1.5, 5.5) | 115.0 | 41.5 | 2.8 (1.4, 4.9) | 147.6 | 51.1 | 2.9* (1.8, 4.4) |
| East | |||||||||
| 25–44 | 25.7 | 8.4 | 3.1* (2.2, 4.2) | 15.0 | 4.3 | 3.5 (2.2, 5.3) | 20.2 | 6.3 | 3.2* (2.4, 4.1) |
| 45–64 | 124.5 | 54.4 | 2.3* (1.9, 2.7) | 69.8 | 19.2 | 3.6 (2.9, 4.5) | 96.3 | 36.4 | 2.6* (2.3, 3.0) |
| 65–84 | 117.9 | 82.0 | 1.4 (1.0, 2.1) | 94.9 | 42.8 | 2.2 (1.6, 3.1) | 101.9 | 59.9 | 1.7* (1.3, 2.2) |
| ≥ 85 | 94.0 | 85.9 | 1.1 (0.1, 4.0) | 67.2 | 50.0 | 1.3 (0.3, 3.9) | 75.8 | 60.8 | 1.2 (0.4, 2.9) |
| Total | |||||||||
| 25–44 | 55.4 | 8.0 | 6.9* (6.5, 7.4) | 40.2 | 4.8 | 8.3 (7.7, 8.9) | 47.6 | 6.4 | 7.4* (7.1, 7.8) |
| 45–64 | 178.7 | 55.2 | 3.2* (3.1, 3.4) | 108.4 | 21.6 | 5.0 (4.8, 5.3) | 141.7 | 38.2 | 3.7* (3.6, 3.8) |
| 65–84 | 177.0 | 75.4 | 2.3* (2.2, 2.5) | 145.8 | 41.4 | 3.5 (3.3, 3.8) | 159.3 | 56.7 | 2.8* (2.7, 3.0) |
| ≥ 85 | 182.0 | 78.8 | 2.3* (1.7, 3.0) | 154.8 | 47.7 | 3.2 (2.6, 4.0) | 163.6 | 57.6 | 2.8* (2.4, 3.3) |
Note. AI/AN = American Indian/Alaska Native; CHSDA = Contract Health Service Delivery Area; CI = confidence interval; IHS = Indian Health Service; RR = rate ratio. Previously published chronic liver disease definition8 using International Classification of Diseases, 10th Revision for underlying cause of death modified for use in this study. Analyses are limited to persons of non-Hispanic origin. AI/AN race is reported from death certificates or through linkage with the IHS patient registration database. Rates are per 100 000 persons and are age-adjusted to the 2000 US standard population (11 age groups; Census P25–1130). IHS regions are defined as follows: Alaskaa; Northern Plains (IL, IN,a IA,a MA,a MN,a MT,a NE,a ND,a SD,a WI,a WYa); Southern Plains (OK,a KS,a TXa); Southwest (AZ,a CO,a NV,a NM,a UTa); Pacific Coast (CA,a ID,a OR,a WA,a HI); East (AL,a AR, CT,a DE, FL,a GA, KY, LA,a ME,a MD, MA,a MS,a MO, NH, NJ, NY,a NC,a OH, PA,a RI,a SC,a TN, VT, VA, WV, DC, IL, IN,a IA,a MIa).
Source. AI/AN Mortality Supplement Database (AMD 1990–2009).
Identifies states with at least 1 county designated as CHSDA. Percent regional coverage of AI/AN persons in CHSDA counties to AI/AN persons in all counties: Alaska = 100%; East = 14.9%; Northern Plains = 55.0%; Southern Plains = 58.0%; Pacific Coast = 54.1%; Southwest = 84.8%.
Indicates RR is statistically significant (P < .05). RRs are calculated in SEER*Stat before rounding of rates and may not equal rate ratios calculated from rates presented in the table.
Causes of Hepatocellular Carcinoma and Cirrhosis Mortality by Age
In CHSDA counties from 1990 to 2009, 90.1% of all CLD deaths among AI/AN persons compared with 81.0% among Whites were attributed to cirrhosis (data available as a supplement to the online version of this article at http://www.ajph.org). For 4809 (55.6%) deaths among AI/AN persons, and 46 263 (44.5%) deaths among Whites, we could assign at least 1 CLD etiology for 1 or more of ALD, HBV infection, or HCV infection based on death record data (data available as a supplement to the online version of this article at http://www.ajph.org). Although a substantial proportion of the 7790 cirrhosis-attributed deaths among AI/AN persons were identified as being associated with ALD (52.6%), HCV infection (10.7%), or HBV infection (1.0%), few HCC-related deaths among AI/AN individuals were reportedly associated with these causes (data available as a supplement to the online version of this article at http://www.ajph.org). Among 4809 deaths in AI/AN persons with an aforementioned etiology listed for a CLD death, 281 (5.8%) were associated with comorbid alcohol and HCV infection. Approximately one third (340 of 983, 34.6%) of CLD deaths with hepatitis B or hepatitis C noted had either co-infection of HBV and HCV, comorbid ALD, or both. HCV infection was the most commonly identified CLD etiology associated with an HCC-related death among AI/ANs (108 of 856; 12.6%).
Disparities in mortality between AI/AN individuals and Whites were significantly greater among cirrhosis-related deaths (RR = 4.0; 95% CI = 3.9, 4.1) compared with HCC-related deaths (RR = 2.5; 95% CI = 2.3, 2.7; Figure 2). Disparities in cirrhosis-related mortality were highest among adults aged 25 to 44 years, with AI/AN persons almost 8 times more likely to die of a cirrhosis-related death compared with Whites (RR = 7.7; 95% CI = 7.3, 8.1). Among cirrhosis-related deaths in which ALD, HCV infection, and HBV infection were identified as underlying or contributing causes, disparities in mortality were consistently greater in younger age groups, especially among those aged 25 to 44 years (Figure 2). Significant disparities were noted for HCC-related death associated with ALD and HCV infection, but not HBV infection. Disparities in HCC-related death did not vary substantially by age.
FIGURE 2—
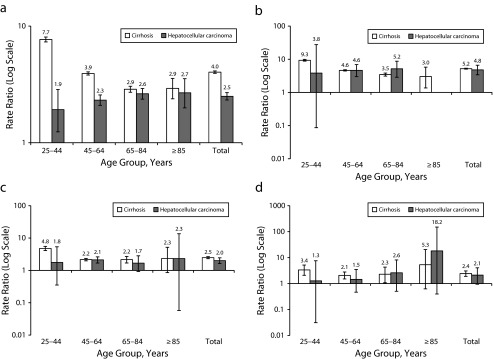
Age-specific cirrhosis and hepatocellular carcinoma death rate ratios comparing American Indians/Alaska Natives to Whites by (a) all causes of chronic liver disease, (b) alcoholic liver disease, (c) HCV infection, and (d) hepatitis B virus infection: 1999–2009.
Note. Previously published chronic liver disease definition8 using International Classification of Diseases, 10th Revision (ICD-10) codes for underlying cause of death modified for use in this study. Hepatocellular carcinoma-related death was defined as having an ICD-10 code for a primary liver cancer as the underlying cause. Cirrhosis-related death was assigned to all other chronic liver disease (CLD). American Indian/Alaska Native race is reported from death certificates or through linkage with the Indian Health Services patient registration database. Analyses are limited to persons of non-Hispanic origin. Selected causes (cirrhosis and hepatocellular carcinoma) were determined from ICD-10 codes for underlying or contributing cause of death. Cases with multiple CLD causes are counted more than once. Death rates are per 100 000 persons and are age-adjusted to the 2000 US standard population (11 age groups; Census P25–1130).
DISCUSSION
This analysis of CLD death record data from 1999 to 2009, including correction for improved CLD case ascertainment and AI/AN race classification, showed significant disparities in national and regional CLD mortality between AI/AN persons and Whites more than previously reported.2 CLD mortality significantly increased from 1999 to 2009 among AI/AN persons and Whites. Overall age-adjusted CLD mortality was almost 4 times greater among AI/AN individuals than Whites. These CLD death rates were more than 3 times higher than 2009 rates from the NVSS1 and more than twice the rates described in the study of 1990 to 1998 deaths.2 Death rates among AI/AN persons and disparities versus Whites were greatest in the Northern Plains and the Southwest.
We found that AI/AN populations compared with Whites had significantly higher CLD death rates across all age groups, especially those aged 25 to 44 years, mainly from cirrhosis-attributed deaths (vs HCC-attributed deaths). These findings suggested that a substantial proportion of AI/AN individuals compared with Whites with CLD might be dying of cirrhosis at earlier ages, precluding age-dependent increases in HCC risk. Disparities in CLD mortality among AI/AN persons and Whites who had ALD, HCV, or HBV as an underlying or contributing cause of death, suggested that AI/AN individuals with any of those conditions were more likely to die of a cirrhosis-related death than Whites, particularly early in adulthood. Although the rate of CLD-related death was highest among men, greater overall disparities in mortality were noted between AI/AN and White women, especially at earlier ages. ALD, which was reported as the underlying cause of more than half of CLD deaths in AI/AN persons in this study, contributed substantially to this disparate burden of premature mortality. Also, dual disease conditions were common, usually involving ALD. More than one-third of the CLD deaths attributed to hepatitis B or C in death records noted either co-infections, ALD, or both. HIV is also associated with elevated liver disease mortality, particularly with comorbid viral hepatitis,23 but we found few HIV deaths relative to CLD deaths, precluding analysis of this association. Overall, these findings confirmed that CLD is a leading cause of premature mortality in the male and female AI/AN population, and that the disparity with Whites was much greater than previously described.1
ALD, HCV infection, and NAFLD have been identified as major causes of CLD among AI/AN individuals.4,5 ALD, noted here as the underlying cause of more than half of CLD deaths in AI/AN persons, has been known to contribute substantially to CLD death among this group.2,4,5 A 2008 CDC study estimated that 11.7% of AI/AN deaths from 2001 to 2005 were attributable to alcohol, 13% of which were liver-related.24 In addition, HCV infection has been shown to have a disparate effect on mortality among AI/AN individuals compared with other races.2,25,26 Despite the high mortality, the prevalence of ALD and HCV infection among AI/AN populations is not well understood. HCV seroprevalence estimates among AI/AN persons have ranged from 3% to 32% in selected facilities, and disease burden has been estimated at 16% and 31% of CLD cases in a southwestern United States and Alaskan study, respectively.4,5,27–29 Another Alaskan study found that the prevalence, risk factors, and genotype distribution of HCV were similar to those reported for the US population.30,31 In that population, the interaction between heavy alcohol use and HCV infection was found to significantly contribute to liver-related death. Alcohol as a cofactor for HCV-related CLD progression was especially concerning, given evidence that even moderate consumption in this subgroup was associated with increased mortality.32,33 Underdiagnosis also limits the understanding of HCV prevalence among AI/AN persons. An estimated 50% of persons living with HCV infection in the United States might be unaware of their infection.34,35 Also, NAFLD is known as a leading cause of CLD among AI/AN individuals.4,5 Although 2 recent analyses of prospective population-based data reported no association between NAFLD and mortality,36,37 this association has not specifically been examined in AI/AN persons, who have a higher a prevalence of obesity and diabetes than other US populations.38 Finally, given the substantial burden of autoimmune liver diseases in AI/AN individuals,39,40 this condition might further contribute to the higher CLD mortality among AI/ANs, and warrants investigation.
Multiple studies have shown that death records substantially underrepresent HCV infection and ALD.8,41 Linkages between AI/AN deaths in the AMD (with improved race classification) and IHS patient encounter data would enable a more robust future analysis of causes of CLD deaths among AI/AN populations and could provide insight into social determinants of health among decedents, such as insurance status and access to subspecialty care. The IHS would also be able to measure the impact on CLD mortality of new public health policies, such as the 2012 CDC recommendation that all persons born from 1945 to 1964 receive a 1-time screening test for HCV infection.42 Another use could be to evaluate the association between improved HBV vaccination coverage and reduction in the CLD death rate attributable to HBV infection among AI/AN persons. Finally, although NAFLD has not yet been shown to impact US mortality, the finding that advanced fibrosis in persons with NAFLD is associated with increased mortality suggests that the mortality burden might change in the future.36,37 Metabolic syndrome, a common precursor to NAFLD, is a significant risk factor in the development of HCC.43 Linkages between the AMD and the IHS patient encounter data would enable more detailed analyses of the prospective impact of NAFLD on CLD mortality.
Our findings were subject to several limitations. First, data linkages and analyses by CHSDA counties did not correct misclassification of AI/AN race of persons not affiliated with a federal tribe or IHS care. Thus, AI/AN persons living in urban areas were likely underrepresented. Second, exclusion of Hispanic AI/AN individuals from the analysis reduced overall count of deaths among AI/AN persons by less than 5%, but might disproportionately affect some states. Third, there was substantial variation between federally recognized tribes in the proportion of native ancestry required for tribal membership, and therefore, for eligibility for IHS services. Whether and how this discrepancy in tribal membership requirements might influence some of our findings was unclear, although our findings were consistent with previous reports. Fourth, although our ICD-10 definition for CLD deaths was validated by medical chart review in a large integrated health care population,8 we acknowledge that coding practices vary among clinical settings as may the positive predictive value of ICD-10 codes chosen to define CLD deaths. Fifth, cause-specific mortality data is known to be limited because of errors in diagnosis and reporting of cause of death.44 Etiologies were assigned based on death records in our study and should not be confused with actual cause-specific disease burden. Underlying CLD etiologies are substantially undercounted in death records,8,41 and thus, rates associated with specific etiologies are likely higher than reported. NAFLD-related mortality is particularly difficult to describe using death records because standardized ICD-10 codes to identify NAFLD are lacking. Finally, although etiologies of CLD might vary in impact regionally, analysis of etiologies by region was limited by the small numbers in such subgroups.
The disparate CLD mortality burden, particularly from premature death, among AI/AN persons compared with Whites, and the substantial regional variations found here could help direct resource allocation for primary and secondary prevention strategies targeting the AI/AN population. Strategies to improve the prompt diagnosis of CLD and linkage to care and management of underlying diseases are essential. These are important considerations with the expected expansion of insurance coverage for AI/AN individuals under the Affordable Care Act. Increased resources are also urgently needed for proven prevention and integrated care strategies, including treatment and counseling for alcohol abuse and dependence, harm reduction strategies for persons who inject drugs, programs to address obesity and metabolic syndrome, sustained HAV and HBV vaccination efforts among CLD cases, and access to affordable, curative HCV treatment. Such integrated, comprehensive approaches are necessary to stem the burden of CLD mortality among AI/AN persons in the United States.
Acknowledgments
This study was supported by the Centers for Disease Control and Prevention (CDC) and the Indian Health Service (IHS).
We thank David Espey, MD and Melissa Jim from the Division of Cancer Prevention, National Center for Chronic Disease Prevention and Health Promotion of the Centers for Disease Control and Prevention, and Diana Roberts from the Division of Epidemiology and Disease Prevention, Indian Health Service, for their leadership and analytical support during the entire AI/AN-US Mortality Database Project, including specific support for this article. We also thank Crystal Begay and Sandte Stanley for their coordinating efforts for the entire project.
This work was presented at the 2013 Association for the Study of Liver Diseases meeting. It was submitted for presentation before acceptance for publication.
Human Participant Protection
CDC and IHS determined this project to constitute public health practice and not research; therefore, no formal institutional review board approvals were required.
References
- 1.Heron M. Deaths: leading causes for 2008. Natl Vital Stat Rep. 2012;60(6):1–94. [PubMed] [Google Scholar]
- 2.Vong S, Bell BP. Chronic liver disease mortality in the United States, 1990-1998. Hepatology. 2004;39(2):476–483. doi: 10.1002/hep.20049. [DOI] [PubMed] [Google Scholar]
- 3.McMahon BJ, Redd JT, Bialek SR, Bell BP, Cheek JE. Liver disease: a significant cause of morbidity and mortality in American Indian and Alaska Natives peoples. IHS Prim Care Provid. 2007;32(6):161–166. [Google Scholar]
- 4.Bialek SR, Redd JT, Lynch A, et al. Chronic liver disease among two American Indian patient populations in the southwestern United States, 2000-2003. J Clin Gastroenterol. 2008;42(7):849–854. doi: 10.1097/mcg.0b013e318054492a. [DOI] [PubMed] [Google Scholar]
- 5.Fischer GE, Bialek SP, Homan CE, Livingston SE, McMahon BJ. Chronic liver disease among Alaska-Native people, 2003-2004. Am J Gastroenterol. 2009;104(2):363–370. doi: 10.1038/ajg.2008.57. [DOI] [PubMed] [Google Scholar]
- 6.Espey D, Paisano R, Cobb N. Regional patterns and trends in cancer mortality among American Indians and Alaska Natives, 1990-2001. Cancer. 2005;103(5):1045–1053. doi: 10.1002/cncr.20876. [DOI] [PubMed] [Google Scholar]
- 7.Rhoades DA. Racial misclassification and disparities in cardiovascular disease among American Indians and Alaska Natives. Circulation. 2005;111(10):1250–1256. doi: 10.1161/01.CIR.0000157735.25005.3F. [DOI] [PubMed] [Google Scholar]
- 8.Manos MM, Leyden WA, Murphy RC, Terrault NA, Bell BP. Limitations of conventionally derived chronic liver disease mortality rates: results of a comprehensive assessment. Hepatology. 2008;47(4):1150–1157. doi: 10.1002/hep.22181. [DOI] [PubMed] [Google Scholar]
- 9.Thomas AR, Zaman A, Bell BP. Deaths from chronic liver disease and viral hepatitis, Multnomah County, Oregon. J Clin Gastroenterol. 2000;2007;41(9):859–862. doi: 10.1097/MCG.0b013e31802df0fe. [DOI] [PubMed] [Google Scholar]
- 10.Espey DK, Jim MA, Richards T, Begay C, Haverkamp D, Roberts D. Methods for improving the quality and completeness of mortality data for American Indians and Alaska Natives. Am J Public Health. 2014;104(6 suppl 3):S286–S294. doi: 10.2105/AJPH.2013.301716. [DOI] [PMC free article] [PubMed] [Google Scholar]
- 11. Centers for Disease Control and Prevention, National Center for Health Statistics. US census populations with bridged race categories. Available at: http://www.cdc.gov/nchs/nvss/bridged_race.htm. Accessed March 18, 2013.
- 12. National Cancer Institute-Surveillance Research Program. Adjusted populations for the counties/parishes affected by Hurricanes Katrina and Rita. Available at: http://seer.cancer.gov/popdata/hurricane_adj.html. Accessed March 27, 2013.
- 13. Centers for Disease Control and Prevention, National Center for Health Statistics. NCHS procedures for multiple-race and Hispanic origin data: collection, coding, editing, and transmitting. 2004. Available at: http://www.cdc.gov/nchs/data/dvs/Multiple_race_documentation_5-10-04.pdf. Accessed March 18, 2013.
- 14. Centers for Disease Control and Prevention, National Center for Health Statistics. Physician’s Handbook on Certification of Death, 2003 Revision. 2003. Available at: http://www.cdc.gov/nchs/data/misc/hb_cod.pdf. Accessed March 18, 2013.
- 15. Centers for Disease Control and Prevention, National Center for Health Statistics. National Vital Statistics System. Available at: http://www.cdc.gov/nchs/nvss.htm. Accessed March 18, 2013.
- 16.Edwards BK, Noone AM, Mariotto AB, et al. Annual report to the nation on the status of cancer, 1975–2010, featuring prevalence of comorbidity and impact on survival among persons with lung, colorectal, breast, or prostate cancer. Cancer. 2013 doi: 10.1002/cncr.28509. Epub ahead of print. [DOI] [PMC free article] [PubMed] [Google Scholar]
- 17.Arias E, Schauman WS, Eschbach K, Sorlie PD, Backlund E. The validity of race and Hispanic origin reporting on death certificates in the United States. Vital Health Stat. 2008;2148:1–23. [PubMed] [Google Scholar]
- 18.Jim MA, Perdue DG, Richardson LC, et al. Primary liver cancer incidence among American Indians and Alaska Natives, US, 1999-2004 Cancer 20081135 suppl1244–1255 [DOI] [PubMed] [Google Scholar]
- 19.Wiggins CL, Espey DK, Wingo PA, et al. Cancer among American Indians and Alaska Natives in the United States, 1999-2004 Cancer 20081135 suppl1142–1152 [DOI] [PubMed] [Google Scholar]
- 20. National Cancer Institute-Surveillance Research Program. Standard populations (millions) for age-adjustment. Available at: http://seer.cancer.gov/stdpopulations. Accessed January 22, 2014.
- 21.Tiwari RC, Clegg LX, Zou Z. Efficient interval estimation for age-adjusted cancer rates. Stat Methods Med Res. 2006;15(6):547–569. doi: 10.1177/0962280206070621. [DOI] [PubMed] [Google Scholar]
- 22.Kim HJ, Fay MP, Feuer EJ, Midthune DN. Permutation tests for joinpoint regression with applications to cancer rates. Stat Med. 2000;19(3):335–351. doi: 10.1002/(sici)1097-0258(20000215)19:3<335::aid-sim336>3.0.co;2-z. [DOI] [PubMed] [Google Scholar]
- 23.Curry MP. HIV and hepatitis C virus: special concerns for patients with cirrhosis. J Infect Dis. 2013;207(suppl 1):S40–S44. doi: 10.1093/infdis/jis763. [DOI] [PubMed] [Google Scholar]
- 24.Centers for Disease Control and Prevention. Alcohol-attributable deaths and years of potential life lost among American Indians and Alaska Natives—United States, 2001–2005. MMWR Morb Mortal Wkly Rep. 2008;57(34):938–941. [PubMed] [Google Scholar]
- 25.Wise M, Bialek S, Finelli L, Bell BP, Sorvillo F. Changing trends in hepatitis C-related mortality in the United States, 1995-2004. Hepatology. 2008;47(4):1128–1135. doi: 10.1002/hep.22165. [DOI] [PubMed] [Google Scholar]
- 26.Ly KN, Xing J, Klevens RM, Jiles RB, Ward JW, Holmberg SD. The increasing burden of mortality from viral hepatitis in the United States between 1999 and 2007. Ann Intern Med. 2012;156(4):271–278. doi: 10.7326/0003-4819-156-4-201202210-00004. [DOI] [PubMed] [Google Scholar]
- 27.Neumeister AS, Pilcher LE, Erickson JM, et al. Hepatitis-C prevalence in an urban native-American clinic: a prospective screening study. J Natl Med Assoc. 2007;99(4):389–392. [PMC free article] [PubMed] [Google Scholar]
- 28.Wilson C. Hepatitis C infection and type 2 diabetes in American-Indian women. Diabetes Care. 2004;27(9):2116–2119. doi: 10.2337/diacare.27.9.2116. [DOI] [PubMed] [Google Scholar]
- 29.Dominitz JA, Boyko EJ, Koepsell TD, et al. Elevated prevalence of hepatitis C infection in users of United States veterans medical centers. Hepatology. 2005;41(1):88–96. doi: 10.1002/hep.20502. [DOI] [PubMed] [Google Scholar]
- 30.Armstrong GL, Wasley A, Simard EP, McQuillan GM, Kuhnert WL, Alter MJ. The prevalence of hepatitis C virus infection in the United States, 1999 through 2002. Ann Intern Med. 2006;144(10):705–714. doi: 10.7326/0003-4819-144-10-200605160-00004. [DOI] [PubMed] [Google Scholar]
- 31.McMahon BJ, Hennessy TW, Christensen C, et al. Epidemiology and risk factors for hepatitis C in Alaska Natives. Hepatology. 2004;39(2):325–332. doi: 10.1002/hep.20046. [DOI] [PubMed] [Google Scholar]
- 32.Younossi ZM, Zheng L, Stepanova M, Venkatesan C, Mir HM. Moderate, excessive or heavy alcohol consumption: each is significantly associated with increased mortality in patients with chronic hepatitis C. Aliment Pharmacol Ther. 2013;37(7):703–709. doi: 10.1111/apt.12265. [DOI] [PubMed] [Google Scholar]
- 33.McMahon BJ, Bruden D, Bruce MG, et al. Adverse outcomes in Alaska Natives who recovered from or have chronic hepatitis C infection. Gastroenterology. 2010;138(3):922–931.e1. doi: 10.1053/j.gastro.2009.10.056. [DOI] [PubMed] [Google Scholar]
- 34.Spradling PR, Rupp L, Moorman AC, et al. Hepatitis B and C virus infection among 1.2 million persons with access to care: factors associated with testing and infection prevalence. Clin Infect Dis. 2012;55(8):1047–1055. doi: 10.1093/cid/cis616. [DOI] [PMC free article] [PubMed] [Google Scholar]
- 35.Denniston MM, Klevens RM, McQuillan GM, Jiles RB. Awareness of infection, knowledge of hepatitis C, and medical follow-up among individuals testing positive for hepatitis C: National Health and Nutrition Examination Survey 2001-2008. Hepatology. 2012;55(6):1652–1661. doi: 10.1002/hep.25556. [DOI] [PMC free article] [PubMed] [Google Scholar]
- 36.Kim D, Kim WR, Kim HJ, Therneau TM. Association between noninvasive fibrosis markers and mortality among adults with nonalcoholic fatty liver disease in the United States. Hepatology. 2013;57(4):1357–1365. doi: 10.1002/hep.26156. [DOI] [PMC free article] [PubMed] [Google Scholar]
- 37.Lazo M, Hernaez R, Bonekamp S, et al. Non-alcoholic fatty liver disease and mortality among US adults: prospective cohort study. BMJ. 2011;343:d6891. doi: 10.1136/bmj.d6891. [DOI] [PMC free article] [PubMed] [Google Scholar]
- 38.Barnes PM, Adams PF, Powell-Griner E. Health characteristics of the American Indian or Alaska Native adult population: United States, 2004. Natl Health Stat Report. 2010;(20):1–22. [PubMed] [Google Scholar]
- 39.Scott JD, Garland N. Chronic liver disease in Aboriginal North Americans. World J Gastroenterol. 2008;14(29):4607–4615. doi: 10.3748/wjg.14.4607. [DOI] [PMC free article] [PubMed] [Google Scholar]
- 40.Hurlburt KJ, McMahon BJ, Deubner H, Hsu-Trawinski B, Williams JL, Kowdley KV. Prevalence of autoimmune liver disease in Alaska Natives. Am J Gastroenterol. 2002;97(9):2402–2407. doi: 10.1111/j.1572-0241.2002.06019.x. [DOI] [PubMed] [Google Scholar]
- 41.Wu C, Chang HG, McNutt LA, Smith PF. Estimating the mortality rate of hepatitis C using multiple data sources. Epidemiol Infect. 2005;133(1):121–125. doi: 10.1017/s0950268804003103. [DOI] [PMC free article] [PubMed] [Google Scholar]
- 42.Smith BD, Morgan RL, Beckett GA, et al. Recommendations for the identification of chronic hepatitis C virus infection among persons born during 1945-1965. MMWR Recomm Rep. 2012;61(RR-4):1–32. [PubMed] [Google Scholar]
- 43.Welzel TM, Graubard BI, Zeuzem S, El-Serag HB, Davila JA, McGlynn KA. Metabolic syndrome increases the risk of primary liver cancer in the United States: a study in the SEER-Medicare database. Hepatology. 2011;54(2):463–471. doi: 10.1002/hep.24397. [DOI] [PMC free article] [PubMed] [Google Scholar]
- 44.Messite J, Stellman SD. Accuracy of death certificate completion: the need for formalized physician training. JAMA. 1996;275(10):794–796. [PubMed] [Google Scholar]