

Abstract
Objectives. We assessed diabetes-related mortality for American Indians and Alaska Natives (AI/ANs) and Whites.
Methods. Study populations were non-Hispanic AI/AN and White persons in Indian Health Service (IHS) Contract Health Service Delivery Area counties; Hispanics were excluded. We used 1990 to 2009 death certificate data linked to IHS patient registration records to identify AI/AN decedents aged 20 years or older. We examined disparities and trends in mortality related to diabetes as an underlying cause of death (COD) and as a multiple COD.
Results. After increasing between 1990 and 1999, rates of diabetes as an underlying COD and a multiple COD subsequently decreased in both groups. However, between 2000 and 2009, age-adjusted rates of diabetes as an underlying COD and a multiple COD remained 2.5 to 3.5 times higher among AI/AN persons than among Whites for all age groups (20–44, 45–54, 55–64, 65–74, and ≥ 75 years), both sexes, and every IHS region except Alaska.
Conclusions. Declining trends in diabetes-related mortality in both AI/AN and White populations are consistent with recent improvements in their health status. Reducing persistent disparities in diabetes mortality will require developing effective approaches to not only control but also prevent diabetes among AI/AN populations.
In 2010, 18.8 million Americans had diagnosed diabetes and 7.0 million had undiagnosed diabetes, about 8.3% of the population.1 Diabetes prevalence is increasing in the United States.2,3 It disproportionately affects US minority groups, including American Indians and Alaska Natives (AI/ANs). Generally, age-adjusted diabetes prevalence rates (standardized to the 2000 US Standard Million) among AI/AN persons are at least twice those of Whites or the total US population.1,4–9 Diabetes is more prevalent among AI/AN persons, and they develop diabetes at a younger age,10 leaving them more vulnerable to the complications of diabetes. Not surprisingly, diabetes ranked as the fourth leading cause of death for AI/AN persons in 2009, whereas it was the seventh leading cause among Whites.11
In the United States, 637 counties in 35 states are designated by the Indian Health Service (IHS) as Tribal Service Delivery Area or Contract Health Service Delivery Area (CHSDA) counties. In these counties, the IHS provides health care to AI/AN communities directly or through contract health care providers. Of those who self-report that they are AI/AN persons, 64% reside in CHSDA counties.12 Much of what is known about the disproportionate burden of diabetes on AI/AN mortality is derived from death certificate data, in which AI/AN race is underreported.11,13–15 A previous study15 indicated less underreporting for AI/AN race occurred in CHSDA counties. Thus, in terms of racial classification ascertainment, mortality analyses restricted to CHSDA counties may be most appropriate for examining AI/AN disparities in diabetes mortality.
The AI/AN Mortality Database (AMD) links death certificate data from the US National Death Index for 1990 to 2009 to records in the IHS patient registration database.12 The AMD identified and corrected racial misclassification of AI/AN decedents. The AMD may be the best data with which to examine diabetes-related mortality differences between AI/AN and White populations. Therefore, we feel that using the AMD to examine diabetes-related mortality differences between AI/AN and White populations could be the most suitable option.
METHODS
A detailed description of the AMD and methods for creating it are described elsewhere in this supplement.12 Briefly, this database contains death certificate data that have been linked to IHS patient registration records. It also includes bridged single-race population estimates developed by the US Census Bureau and the National Center for Health Statistics. These population estimates had been adjusted for population shifts occurring in 2005 because of Hurricanes Katrina and Rita.16,17 However, the population estimates in the AMD are based on the updated bridged intercensal population estimates, which significantly overestimated AI/AN individuals of Hispanic origin.12,18 Therefore, to avoid underestimating mortality in AI/AN populations, we restricted analyses to non-Hispanic AI/AN persons (AI/AN persons). Among US racial groups, non-Hispanic Whites (Whites) are the most homogeneous; we used them as the referent group in our analyses. We also restricted our analyses to adult decedents aged 20 years or older who resided in CHSDA counties at the time of death.
To identify diabetes-related deaths, we used both the International Classification of Diseases, Ninth Revision (ICD-9),19 and the International Classification of Diseases, Tenth Revision (ICD-10).20 We applied ICD-9 code 250 for death certificate data from 1990 to 1998 and ICD-10 codes E10 to E14 for data from 1999 to 2009. We calculated the number of diabetes deaths and death rates as an underlying cause of death (COD) and any listed COD using multiple-cause-of-death (multiple COD) information.
First, as displayed in Figure 1, we examined the distribution of age at time of death related to diabetes as an underlying COD among adult AI/AN and White residents of CHSDA counties from 2000 to 2009. We then performed stratified data analyses by race, sex, age group, and IHS residence region (Northern Plains [Illinois, Indiana, Iowa, Michigan, Minnesota, Montana, Nebraska, North Dakota, South Dakota, Wisconsin, Wyoming]; Alaska [Alaska]; Southern Plains [Oklahoma, Kansas, Texas]; Southwest [Arizona, Colorado, Nevada, New Mexico, Utah]; Pacific Coast [California, Idaho, Oregon, Washington, Hawaii]; and East [Alabama, Arkansas, Connecticut, Delaware, Florida, Georgia, Kentucky, Louisiana, Maine, Maryland, Massachusetts, Mississippi, Missouri, New Hampshire, New Jersey, New York, North Carolina, Ohio, Pennsylvania, Rhode Island, South Carolina, Tennessee, Vermont, Virginia, West Virginia, District of Columbia]. States in italics are those without designated CHSDA counties.) Additional details about CHSDA counties and IHS regions, including population coverage, are described elsewhere in this supplement.12,21 We classified adult decedents into 5 age groups (20–44, 45–54, 55–64, 65–74, and ≥ 75 years). All the crude, age-specific, and age-adjusted rates in this article are expressed per 100 000 population.
FIGURE 1—
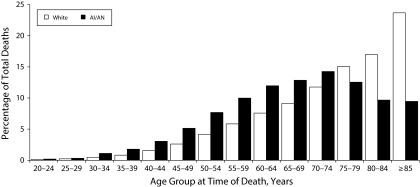
Diabetes as an underlying cause of death among adult AI/AN and White persons, by age group: Contract Health Service Delivery Area counties, United States, 2000–2009.
Note. AI/AN = American Indian/Alaska Native. Analyses are limited to people of non-Hispanic origin aged 20 years and older. AI/AN race is reported from death certificates or through linkage with the Indian Health Service patient registration database.
Source. AI/AN Mortality Database (1990–2009). Data are based on linked Indian Health Service–National Vital Statistics System mortality files. The following states and years of data were excluded because Hispanic origin was not collected on the death certificate: LA, 1990; NH, 1990–1992; and OK, 1990–1996.
We used SEER*Stat software (version 8.0.4; National Cancer Institute, Bethesda, MD) to compute frequency counts, crude and age-adjusted death rates, and rate ratios (RRs) between AI/AN and White populations. Death rates for diabetes as an underlying COD and as a multiple COD were age standardized to the 2000 US Standard Population on the basis of 19 age group classifications. SEER*Stat combined individual age groups into the selected 5 age groups in computing age-adjusted and age-specific rates. We calculated 95% confidence intervals (CIs) for RRs on the basis of methods described by Tiwari et al.22 We also used Joinpoint regression to assess trends in death rates.23 Joinpoint regression uses permutation tests to identify points (joinpoints) at which linear trends change significantly in either direction or magnitude.24 Each time period trend is described by the annual percentage change (APC)—a change at a constant percentage of the prior year’s rate. It also determines whether the change in the slope of the trend line was statistically significantly different from zero (P < .05).25 As shown in Figure 2, points represent the observed death rates, and lines are modeled as piecewise linear trends from Joinpoint analyses.
FIGURE 2—

Age-adjusted death rates for diabetes as (a) an underlying cause of death and (b) a multiple cause of death: adult AI/AN and White persons, Contract Health Service Delivery Area counties, United States, 1990–2009.
Note. AI/AN = American Indian/Alaska Native. Analyses are limited to people of non-Hispanic origin aged 20 years and older. AI/AN race is reported from death certificates or through linkage with the Indian Health Service patient registration database. Rates are per 100 000 people and were age adjusted to the 2000 US standard population (19 age groups; Census P25–113026).
Source. AI/AN Mortality Database (1990–2009). Data are based on linked Indian Health Service–National Vital Statistics System mortality files. The following states and years of data were excluded because Hispanic origin was not collected on the death certificate: LA, 1990; NH, 1990–1992; and OK, 1990–1996.
Using the 2000 to 2009 data, we examined racial disparities in the distribution of age at time of death from diabetes and associated death rates between AI/AN and White persons by population subgroup (i.e., age, sex, and region). Using the 20-year data for 1990 to 2009, we compared AI/AN and White mortality trends. Additionally, for the AI/AN population, we examined trends by population subgroup.
RESULTS
All our analytical findings were limited to non-Hispanic AI/AN and White adult decedents aged 20 years or older who resided in CHSDA counties at the time of death.
Comparisons by Race
Age at time of death, 2000–2009.
For diabetes as an underlying COD, the distribution of age at death among AI/AN persons differed from that of Whites (Figure 1). Among AI/AN persons, the proportion of deaths in each 5-year age group increased until it peaked at 70 to 74 years, and then it declined. For Whites, the proportion of deaths rose continuously with age, with the highest proportion among those aged 85 years or older. Among AI/AN persons, 41.2% of decedents died before 65 years, compared with just 23.4% of Whites.
Rates for diabetes as an underlying COD and as a multiple COD by demographics, 2000–2009.
In both races, death rates for diabetes as an underlying COD and as a multiple COD increased with age. They were also higher among men than women and varied by region of residence. However, these rates were higher for AI/AN persons than for Whites in all age groups, both sexes, and every IHS region except Alaska (Table 1). The age-adjusted death rate for diabetes as an underlying COD for AI/AN persons (100.9) was 3.62 times the rate for Whites (27.8). The age-adjusted death rate for diabetes as a multiple COD for AI/AN persons (249.2) was 2.63 times the rate for Whites (94.7). For both underlying CODs and multiple CODs, the rate ratios (RRs) of AI/AN to White persons were lower among those aged 75 years or older (underlying COD: RR = 3.13; multiple COD: RR = 2.20) than among younger people. The younger groups had RRs for underlying COD ranging from 3.48 to 4.38 and for multiple COD ranging from 2.95 to 3.98. The RRs were higher among women (underlying COD: RR = 4.06; multiple COD: RR = 2.95) than among men (underlying COD: RR = 3.20; multiple COD: RR = 2.33). Both ratios also varied by region. We noted the highest ratios in the Northern Plains (underlying COD: RR = 4.71; multiple COD: RR = 3.56) and the Southwest (underlying COD: RR = 4.52; multiple COD: RR = 3.54).
TABLE 1—
Diabetes Mortality Among Adult American Indians and Alaska Natives and Whites: Contract Health Service Delivery Area Counties, United States, 2000–2009
| UCOD |
MCOD |
|||||
| Category and Classification | AI/AN (n = 6536) | White (n = 111 533) | RR (95% CI) | AI/AN (n = 15 982) | White (n = 381 457) | RR (95% CI) |
| Overall age-adjusted rate | 100.9 | 27.8 | 3.62* (3.53, 3.72) | 249.2 | 94.7 | 2.63* (2.59, 2.68) |
| Age group,a y | ||||||
| 20–44 | 8.4 | 2.4 | 3.48* (3.14, 3.85) | 20.1 | 5.0 | 3.98* (3.72, 4.25) |
| 45–54 | 44.2 | 10.7 | 4.12* (3.83, 4.43) | 102.5 | 29.0 | 3.54* (3.37, 3.71) |
| 55–64 | 122.1 | 27.9 | 4.38* (4.15, 4.63) | 296.1 | 87.7 | 3.37* (3.26, 3.49) |
| 65–74 | 284.4 | 66.3 | 4.29* (4.08, 4.50) | 684.6 | 231.9 | 2.95* (2.86, 3.05) |
| ≥ 75 | 555.0 | 177.6 | 3.13* (2.99, 3.27) | 1417.3 | 643.4 | 2.20* (2.14, 2.26) |
| Sex | ||||||
| Male | 106.1 | 33.1 | 3.20* (3.08, 3.33) | 271.4 | 116.6 | 2.33* (2.27, 2.39) |
| Female | 96.2 | 23.7 | 4.06* (3.91, 4.20) | 230.7 | 78.2 | 2.95* (2.88, 3.02) |
| Region | ||||||
| Northern Plains | 145.7 | 31.0 | 4.71* (4.43, 4.99) | 369.3 | 103.8 | 3.56* (3.43, 3.69) |
| Alaska | 31.4 | 32.6 | 0.96 (0.78, 1.18) | 96.2 | 92.3 | 1.04 (0.92, 1.18) |
| Southern Plains | 110.3 | 34.6 | 3.19* (3.02, 3.37) | 278.2 | 119.6 | 2.33* (2.25, 2.41) |
| Southwest | 104.7 | 23.1 | 4.52* (4.31, 4.75) | 217.9 | 61.5 | 3.54* (3.43, 3.66) |
| Pacific Coast | 81.9 | 29.8 | 2.74* (2.56, 2.94) | 239.7 | 109.9 | 2.18* (2.09, 2.27) |
| East | 79.3 | 25.1 | 3.16* (2.83, 3.51) | 222.2 | 85.9 | 2.59* (2.42, 2.76) |
Note. AI/AN = American Indian/Alaska Native; CI = confidence interval; IHS = Indian Health Service; MCOD = multiple causes of death, including diabetes; RR = rate ratios; UCOD = underlying cause of death because of diabetes. Analyses are limited to people of non-Hispanic origin aged 20 years and older. AI/AN race is reported from death certificates or through linkage with the IHS patient registration database. RRs are calculated in SEER*Stat before rounding of rates and may not equal RRs calculated from rates presented in table. Rates are per 100 000 people and were age adjusted to the 2000 US standard population (19 age groups; Census P25–113026). Indian Health Service regions are defined as follows: Alaskab; Northern Plains (IL, IN,b IA,b MI,b MN,b MT,b NE,b ND,b SD,b WI,b WYb); Southern Plains (OK,b KS,b TXb); Southwest (AZ,b CO,b NV,b NM,b UTb); Pacific Coast (CA,b ID,b OR,b WA,b HI); East (AL,b AR, CT,b DE, FL,b GA, KY, LA,b ME,b MD, MA,b MS,b MO, NH, NJ, NY,b NC,b OH, PA,b RI,b SC,b TN, VT, VA, WV, DC).
Source. AI/AN Mortality Database (1990–2009). Data are based on linked Indian Health Service–National Vital Statistics System mortality files. The following states and years of data were excluded because Hispanic origin was not collected on the death certificate: LA, 1990; NH, 1990–1992; and OK, 1990–1996.
Age-adjusted within age group for proper comparison.
Identifies states with ≥ 1 county designated as Contract Health Service Delivery Area.
*P < .001.
Trends for diabetes as an underlying COD and a multiple COD, 1990–2009.
Across the 20-year time period, age-adjusted death rates for diabetes as an underlying COD and multiple COD (Figure 2) were consistently higher in AI/AN than in White persons. In general, AI/AN persons’ rates of diabetes as an underlying COD were similar in magnitude to that of Whites’ rates of diabetes as a multiple COD. For AI/AN persons, rates of diabetes as an underlying COD increased from 1990 to 1997 (APC = 5.2%) and then declined from 1997 to 2009 (APC = −1.4%). For Whites, rates of diabetes as an underlying COD increased from 1990 to 2001 (APC = 2.3%) and subsequently leveled off before decreasing from 2005 to 2009 (APC = −3.6%). All these APCs were statistically significant at an α of .05. For both groups, death rates for diabetes as a multiple COD displayed similar patterns, with increasing rates followed by decreasing rates. However, trends were not always significant. In 2009, the age-adjusted death rate for diabetes as an underlying COD was 89.6 for AI/AN persons compared with 25.0 for Whites. Similarly, the death rate for diabetes as a multiple COD was 237.4 for AI/AN persons compared with 88.9 for Whites.
Trends in AI/AN Subpopulations, 1990–2010
Twenty-year trends in death rates for diabetes as an underlying COD by age group, sex, and IHS residence region are displayed in Table 2. Across the entire period, rates for diabetes as an underlying COD rose for adults aged 20 to 44 years (APC = 4.8%; P < .05) and showed no significant change for adults aged 45 to 54 years (APC = −0.4%; P ≥ .05). However, for all other age groups, we found 2 distinct periods of trend. In adults aged 55 to 64 years, the rate did not significantly change between 1990 and 2004 (APC = −0.3%; P ≥ .05) but decreased sharply between 2004 and 2009 (APC = −7.2%, P < .05). In adults aged 65 years or older, the rate increased in the first half of the time period. Then, for those aged 65 to 74 years, it decreased between 1997 and 2009 (APC = −3.7%; P < .05). However, in adults aged 75 years or older, it leveled off between 1999 and 2009 (APC = −0.6%; P ≥ .05). Interestingly, rates for diabetes as an underlying COD in 2009 were higher than 1990 rates in the oldest and the youngest age groups. For those aged 75 years or older, the rates were 427.8 in 1990 and 512.3 in 2009. For those aged 20 to 44 years, they were 3.7 and 9.2, respectively.
TABLE 2—
Trends in Rates of Diabetes as Underlying Cause of Death Among Adult American Indians and Alaska Natives: Contract Health Service Delivery Area Counties, United States, 1990–2009
| Observed Death Rate |
Trend 1 |
Trend 2 |
||||
| Category and Classification | 1990 | 2009 | Year | APC (95% CI) | Year | APC (95% CI) |
| Overall | ||||||
| Crude | 50.1 | 63.4 | 1990–1997 | 6.5* (3.0, 10.1) | 1997–2009 | −0.3 (−1.3, 0.7) |
| Age adjusted | 87.9 | 89.6 | 1990–1997 | 5.2* (1.5, 9.1) | 1997–2009 | −1.4* (−2.5, −0.2) |
| Age group, y | ||||||
| 20–44 | 3.7 | 9.2 | 1990–2009 | 4.8* (1.4, 8.2) | ||
| 45–54 | 39.2 | 38.5 | 1990–2009 | −0.4 (−1.6, 0.8) | ||
| 55–64 | 139.9 | 92.9 | 1990–2004 | −0.3 (−1.8, 1.2) | 2004–2009 | −7.2* (−12.5, −1.7) |
| 65–74 | 244.1 | 224.8 | 1990–1997 | 7.9* (2.8, 13.3) | 1997–2009 | −3.7* (−5.2, −2.1) |
| ≥ 75 | 427.8 | 512.3 | 1990–1999 | 4.3* (1.5, 7.3) | 1999–2009 | −0.6 (−2.3, 1.1) |
| Sex | ||||||
| Male | 79.1 | 100.7 | 1990–1997 | 7.1* (2.6, 11.9) | 1997–2009 | −0.2 (−1.5, 1.1) |
| Female | 93.6 | 80.2 | 1990–1996 | 5.2* (0.4, 10.2) | 1996–2009 | −2.1* (−3.1, −1.0) |
| Region | ||||||
| Northern Plains | 131.2 | 118.6 | 1990–2009 | 0.1 (−1.4, 1.5) | ||
| Alaskaa | . . . | 36.5 | 1990–2009 | −0.7 (−3.5, 2.1) | ||
| Southern Plainsa | . . . | 101.7 | 1997–2009 | −0.2 (−1.9, 1.4) | ||
| Southwest | 102.9 | 109.0 | 1990–1997 | 3.3* (0.1, 6.6) | 1997–2009 | −1.8* (−2.9, −0.6) |
| Pacific Coast | 65.9 | 65.6 | 1990–2005 | 3.3* (1.1, 5.6) | 2005–2009 | −8.1 (−19.1, 4.5) |
| East | 59.2 | 68.3 | 1990–1994 | 27.2* (0.4, 61.0) | 1994–2009 | −3.2* (−5.4, −1.0) |
Note. APC = annual percentage change; CI = confidence interval. Analyses are limited to people of non-Hispanic origin aged 20 years and older. American Indian/Alaska Native race is reported from death certificates or through linkage with the IHS patient registration database. Rates are per 100 000 people and were age adjusted to the 2000 US standard population (19 age groups; Census P25-113026). Trends are given as APC between joinpoints. Indian Health Service regions are defined as follows: Alaskab; Northern Plains (IL, IN,b IA,b MI,b MN,b MT,b NE,b ND,b SD,b WI,b WYb); Southern Plains (OK,b KS,b TXb); Southwest (AZ,b CO,b NV,b NM,b UTb); Pacific Coast (CA,b ID,b OR,b WA,b HI); East (AL,b AR, CT,b DE, FL,b GA, KY, LA,b ME,b MD, MA,b MS,b MO, NH, NJ, NY,b NC,b OH, PA,b RI,b SC,b TN, VT, VA, WV, DC).
Source. AI/AN Mortality Database (1990–2009). Data are based on linked Indian Health Service–National Vital Statistics System mortality files. The following states and years of data were excluded because Hispanic origin was not collected on the death certificate: LA, 1990; NH, 1990–1992; and OK, 1990–1996.
Alaska had < 10 deaths in 1990, so the rate was suppressed because it was unstable. The Southern Plains region did not have reliable data before 1997; thus, the trend was plotted from 1997 onward.
Identifies states with ≥ 1 county designated as Contract Health Service Delivery Area.
*P < .05.
Rates for diabetes as an underlying COD for men and women increased in the 1st half of the study period (APC = 7.1%; P < .05, from 1990 to 1997 for men; APC = 5.2%; P < .05, from 1990 to 1996 for women). In the latter half of the period, however, rates leveled off among men (APC = −0.2% from 1997 to 2009; P ≥ .05) and decreased among women (APC = −2.1% from 1996 to 2009; P < .05). These changes resulted in a higher diabetes death rate in 2009 than in 1990 for men (100.7 vs 79.1). Meanwhile, they led to a lower rate in 2009 than in 1990 for women (80.2 vs 93.6).
Trends also varied by region. In 3 regions (Southwest, Pacific Coast, and East), increases in death rates were followed by decreases. However, in the other 3 regions (Northern Plains, Alaska, and Southern Plains), we found little change in death rates across the whole time period.
DISCUSSION
We found both encouraging and discouraging trends in diabetes-related mortality in the AI/AN population between 1990 and 2009. After increasing in the first half of the 20-year study period, rates for diabetes as an underlying COD and a multiple COD subsequently decreased for both populations. Rates for diabetes as an underlying COD in AI/AN persons began to decline in 1997, 8 years earlier than for Whites. These findings are also consistent with the national vital statistics, which show rates of diabetes as an underlying COD starting to decline nationally in 2005.27 The decline in mortality occurred even though the number of adults with diabetes—and thus the number of people who could potentially die from the disease—continued to grow. However, the decline in diabetes mortality could increase its prevalence as well. Reasons for these mortality declines cannot be determined from our data. However, these trends follow other encouraging trends in the health of the US and AI/AN diabetic populations. Examples are declines in rates of diabetes-related complications,28–31 improvements in risk factor control and diabetes care,32–34 and decreases in all-cause and cardiovascular disease death rates among people with diabetes.35
Not all of our findings, however, were encouraging. Our data demonstrate that, proportionally, more AI/AN persons died from diabetes at younger ages than did Whites. When we compared AI/AN diabetes-related death rates with White diabetes-related death rates, disparities were large. For instance, the age-adjusted death rate of AI/AN persons was 2.6 to 3.6 times that of Whites. These disparities were evident for all IHS regions except Alaska, which has the lowest diabetes prevalence among all regions.1,36 Previous studies1,4,8,9 have found that diabetes prevalence in AI/AN persons is at least twice that of Whites. These disparities in diabetes death rates could be mostly caused by the greater prevalence of diabetes among the AI/AN population compared with Whites, suggesting that decreasing diabetes-related mortality and lessening disparities will require the challenging task of reducing AI/AN diabetes incidence. A similar conclusion was reached in a recent study using data from the Women’s Health Initiative.37 AI/AN persons were not included in its analysis because of sample size limitations. However, the study found that postmenopausal women with diabetes had a 2 to 3 times higher risk of all-cause and cardiovascular mortality than did women without diabetes. It also noted that disparities in mortality seen in Hispanics and Blacks compared with Whites were primarily a function of the greater prevalence of diabetes among minority populations. This finding led the authors to suggest that efforts to reduce disparities in diabetes mortality could focus on preventing type 2 diabetes.
In addition, we also found that not all parts of the AI/AN population shared in the recent decline in rates of diabetes as an underlying COD. In fact, the estimated 2009 rates of diabetes as an underlying COD in young adults (aged 20–44 years), older adults (aged ≥ 75 years), and men were greater than they had been 20 years earlier in 1990. Differential growth in diabetes among these population subgroups may have affected these trends. However, the increase in death rates for diabetes as an underlying COD in those aged 75 years or older may actually reflect several positive trends. For example, improved access to better quality of health care may have led to increased longevity for people with diabetes or a delay in diabetes onset for at least some AI/AN people. It is also possible that people are not dying from other diseases at younger ages and thus become more likely to die from diabetes at older ages. Similar studies were conducted within the same time period of our study, although they did not cover the full 20 years. These earlier studies had documented large and disproportionate increases in diabetes prevalence among young AI/AN persons38,39 compared with older adults.5 A greater increase in prevalence among men than women was also noted.5 Unfortunately, estimated numbers of AI/AN and White adults with diabetes in CHSDA counties are not available for our 20-year study period. Therefore, we cannot examine the impact of changes in diabetes prevalence on trends and disparities in diabetes-related mortality.
Decreasing trends in diabetes-related death rates in recent years suggest progress in diabetes control efforts among AI/AN persons. In 1997, in response to the AI/AN diabetes epidemic, Congress established the Special Diabetes Program for Indians within the IHS. During fiscal year 2013, this program provided funds to 404 IHS, tribal, and urban Indian health grant programs across the United States for diabetes treatment and prevention.32,40 These community-based programs have increased access to diabetes treatment and prevention services. They have also helped program participants lower risk factors for diabetes complications (e.g., glucose, blood pressure, and cholesterol levels) and improve rates of diabetes complications.29,32,41,42 In addition, these programs have promoted physical activity and weight management among AI/AN communities, including efforts focused on AI/AN youths.
In 2004, Congress appropriated additional funds for grants to translate diabetes prevention research into community-based interventions for AI/AN persons at high risk of developing diabetes. The Special Diabetes Program for Indians helped established 36 demonstration programs to serve 80 tribes. They were designed to reduce risk factors (e.g., body weight, systolic blood pressure, lipid levels) among those at high risk. An evaluation of these programs found that it was feasible to use the lifestyle intervention to reduce risk factors for diabetes in diverse AI/AN communities.43
Limitations
The linkage of IHS patient records and death certificate data within CHSDA counties is a major strength as well as a weakness of this study. The data linkage of the AI/AN resident population within CHSDA counties definitely improves the ascertainment of AI/AN deaths. However, these CHSDA residents who receive care from the IHS are not likely to represent the entire AI/AN population or the AI/AN populations of the 6 IHS regions. Those not represented include AI/ANs who are not members of federally recognized tribes and are therefore ineligible for IHS services and people who were eligible for but never use IHS services. AI/AN individuals living in urban areas and other locations outside of CHSDA counties are also excluded.12 Moreover, among federally recognized tribes, criteria for tribal membership differ. From tribe to tribe, the definition of “tribal ancestry” varies from being descended from a tribal member to having a specified proportion of Indian blood (blood quantum).44 Membership in a federally recognized tribe, in turn, determines the individual’s eligibility for IHS services. Additionally, our analyses were restricted to non-Hispanic decedents only, which may disproportionately affect some states, particularly in the Southwest, Southern Plains, and Pacific Coast regions, though the exclusion of Hispanic AI/AN persons only reduced the overall number of AI/AN deaths by less than 5%.12
Another major limitation is the lack of diabetic population estimates for use in the calculation of death rates. If rates had taken into account the prevalence of diabetes, racial disparities in diabetes death rates might not have been as great. Additionally, trends over time for AI/AN subpopulations would likely have differed (assuming that the burden of diabetes grew faster in some population groups than in others). The use of general population denominators allows us to perform estimation of trends in diabetes death rates in the whole AI/AN population. However, it cannot allow us to determine why there may be an increasing trend in a subpopulation. Is it because diabetes is becoming more deadly or simply more prevalent, or is some other competing cause of death becoming less lethal? Having death rates based on AI/AN population estimates of the total and those with diabetes may be more informative in decreasing death rates and reducing disparities.
For any given disease or condition, population-based mortality estimates at a national level depend on an analysis of the cause-specific information on death certificates. There are issues related to the reliability and validity of COD data on death certificates44 that may have affected study findings. They include inaccuracy of diagnosis, variation in a causal sequence interpretation, improper completion of the certificate, changing perceptions of the causal role of diseases, and, particularly, competing conditions contributing to death.45,46
The causal role of diabetes in the process of death is often unclear, and perceptions of the role of diabetes may vary by physician.46 Among people with diabetes, the presence of comorbid conditions and the interval between the onset of diabetes and its complications and time of death often make the COD determination process complicated. Consequently, it becomes difficult to assess the role diabetes played in the fatal outcome.47 The certifying physician would likely consider diabetes as a possible underlying or contributing cause of death in a decedent with a known history of diagnosed diabetes. Otherwise, diabetes might not be listed on the death certificate even if it had contributed to the fatal outcome.45 Thus, the certifier’s knowledge of the decedent’s medical history is critical because it dictates the content of the death certificate and the accuracy of COD information.
In our study, among those with multiple COD deaths, diabetes was listed as an underlying COD 41% of the time among AI/AN persons, but only 29% of the time among Whites. It is unclear whether diabetes is more deadly among AI/AN than among White persons or whether physicians serving AI/AN people are more likely to perceive diabetes as the major cause leading to death. If the latter is true, then the racial disparity in diabetes mortality between AI/AN and White populations might be overestimated.
Conclusions
Data linkages provide us with an important tool to improve racial identification of AI/AN persons in national death records and to strengthen surveillance of diabetes-related mortality. Ongoing production and accessibility of AI/AN diabetic population estimates would also improve and strengthen our surveillance of diabetes and its impact on AI/AN diabetes-related mortality. Recent trends suggest encouraging declines in diabetes-related mortality in AI/AN and White populations, which are consistent with recent improvements in the health of these populations. The decline in the rates of diabetes as an underlying COD among AI/AN persons were observed 8 years earlier than that among Whites. However, despite these positive trends and impressive achievements of the Special Diabetes Program for Indians in AI/AN communities across the country, AI/AN persons still experience substantially higher diabetes death rates than Whites. Given the disproportionately high prevalence rates of diabetes in AI/AN populations, reducing disparities will require developing effective approaches to not only control but prevent diabetes among these communities.
Acknowledgments
We are grateful to David Espey, MD, and his team for their valuable assistance. We also thank 2 anonymous reviewers for their constructive suggestions on earlier versions of this article.
Human Participant Protection
The CDC and IHS determined this project to constitute public health practice and not research; therefore, no formal institutional review board approvals were required.
References
- 1.Centers for Disease Control and Prevention. National Diabetes Fact Sheet: National Estimates and General Information on Diabetes and Prediabetes in the United States, 2011. Atlanta, GA: US Department of Health and Human Services, Centers for Disease Control and Prevention; 2011. [Google Scholar]
- 2.Centers for Disease Control and Prevention. Increasing prevalence of diagnosed diabetes—United States and Puerto Rico, 1995–2010. MMWR Morb Mortal Wkly Rep. 2012;61(45):918–921. [PubMed] [Google Scholar]
- 3.Geiss LS, Cowie C. Type 2 diabetes and persons at high risk of diabetes. In: Venkat Narayan KM, Williams D, Gregg EW, Cowie C, editors. Diabetes Public Health: From Data to Policy. New York, NY: Oxford University Press; 2011. pp. 15–32. [Google Scholar]
- 4.Barnes PM, Adams PF, Powell-Griner E. Health characteristics of the American Indian or Alaska Native adult population: United States, 2004–2008. Natl Health Stat Report. 2010;20:1–22. [PubMed] [Google Scholar]
- 5.Centers for Disease Control and Prevention. Diabetes prevalence among American Indians and Alaska Natives and the overall population—United States, 1994–2002. MMWR Morb Mortal Wkly Rep. 2003;52(30):702–704. [PubMed] [Google Scholar]
- 6.Centers for Disease Control and Prevention. Prevalence of diagnosed diabetes among American Indians/Alaskan Natives—United States, 1996. MMWR Morb Mortal Wkly Rep. 1998;47(42):901–904. [PubMed] [Google Scholar]
- 7.Montana Diabetes Project. Diabetes: The Burden in Montana. Helena, MT: Montana Department of Public Health and Human Services; 2007. [Google Scholar]
- 8.North Dakota Diabetes Control Program. Diabetes and Related Health Factors in North Dakota Adults: An Analysis of North Dakota BRFSS Data, 1994–2000. Bismarck, ND: North Dakota Department of Health; 2002. [Google Scholar]
- 9.New Mexico Diabetes Prevention and Control Program. Diabetes in New Mexico: The Latest Numbers. Santa Fe, NM: New Mexico Department of Health; 2010. Available at: http://www.diabetesnm.org. Accessed September 6, 2013. [Google Scholar]
- 10.Writing Group for the SEARCH for Diabetes in Youth Study Group. Incidence of diabetes in youth in the United States. JAMA. 2007;297(24):2716–2724. doi: 10.1001/jama.297.24.2716. [DOI] [PubMed] [Google Scholar]
- 11.Heron M. Deaths: Leading causes for 2009. Natl Vital Stat Rep. 2012;61(7) [PubMed] [Google Scholar]
- 12.Espey DK, Jim MA, Richards T, Begay C, Haverkamp D, Roberts D. Methods for improving the quality and completeness of mortality data for American Indians and Alaska Natives. Am J Public Health. 2014;104(6 suppl 3):S286–S294. doi: 10.2105/AJPH.2013.301716. [DOI] [PMC free article] [PubMed] [Google Scholar]
- 13.Rosenberg HM, Maurer JD, Sorlie PD et al. Quality of death rates by race and Hispanic origin: a summary of current research, 1999. Vital Health Stat 2. 1999;(128):1–13. [PubMed] [Google Scholar]
- 14.Sorlie PD, Rogot E, Johnson NJ. Validity of demographic characteristics on the death certificate. Epidemiology. 1992;3(2):181–184. doi: 10.1097/00001648-199203000-00018. [DOI] [PubMed] [Google Scholar]
- 15.Arias E, Schauman WS, Eschbach K, Sorlie PD, Backlund E. The validity of race and Hispanic origin reporting on death certificates in the United States. Vital Health Stat 2. 2008;148:1–23. [PubMed] [Google Scholar]
- 16.Ingram DD, Parker JD, Schenker N et al. United States Census 2000 population with bridged race categories. Vital Health Stat 2. 2003;135:1–55. [PubMed] [Google Scholar]
- 17.National Cancer Institute Surveillance Epidemiology and End Results Program. Adjusted populations for the counties/parishes affected by Hurricanes Katrina and Rita. Available at: http://seer.cancer.gov/popdata/hurricane_adj.html. Accessed August 29, 2013.
- 18.Edwards BK, Noone AM, Mariotto AB et al. Annual report to the nation on the status of cancer, 1975–2010, featuring prevalence of comorbidity and impact on survival among persons with lung, colorectal, breast, or prostate cancer. Cancer. 2013 doi: 10.1002/cncr.28509. Epub ahead of print. [DOI] [PMC free article] [PubMed] [Google Scholar]
- 19.International Classification of Diseases, Ninth Revision. Geneva, Switzerland: World Health Organization; 1980. [Google Scholar]
- 20.International Classification of Diseases, 10th Revision. Geneva, Switzerland: World Health Organization; 1990. [Google Scholar]
- 21.Espey DK, Jim MA, Cobb N et al. Leading causes of death and all-cause mortality in American Indians and Alaska Natives. Am J Public Health. 2014;104(6 suppl 3):S303–S311. doi: 10.2105/AJPH.2013.301798. [DOI] [PMC free article] [PubMed] [Google Scholar]
- 22.Tiwari RC, Clegg LX, Zou Z. Efficient interval estimation for age-adjusted cancer rates. Stat Methods Med Res. 2006;15(6):547–569. doi: 10.1177/0962280206070621. [DOI] [PubMed] [Google Scholar]
- 23.National Cancer Institute Surveillance Research Program. Joinpoint regression program. Available at: http://surveillance.cancer.gov/joinpoint. Accessed August 29, 2013.
- 24.Kim HJ, Fay MP, Feuer EJ, Midthune DN. Permutation tests for Joinpoint regression with applications to cancer rates. Stat Med. 2000;19(3):335–351. doi: 10.1002/(sici)1097-0258(20000215)19:3<335::aid-sim336>3.0.co;2-z. [DOI] [PubMed] [Google Scholar]
- 25.Clegg LX, Hankey BF, Tiwari R, Feuer EJ, Edwards BK. Estimating average annual per cent change in trend analysis. Stat Med. 2009;28(29):3670–3682. doi: 10.1002/sim.3733. [DOI] [PMC free article] [PubMed] [Google Scholar]
- 26.Day JC. Population Projections of the United States by Age, Sex, Race, and Hispanic Origin: 1995–2050. Current Population Reports P25-1130. Washington, DC: US Government Printing Office; 1996. [Google Scholar]
- 27.Murphy SL, Xu J, Kochanek KD. Deaths: Final data for 2010. Natl Vital Stat Rep. 2013;61(4) [PubMed] [Google Scholar]
- 28.Li Y, Burrows NR, Gregg EW, Albright A, Geiss LS. Declining rates of hospitalization for nontraumatic lower-extremity amputation in the diabetic population aged 40 years or older: US, 1988–2008. Diabetes Care. 2012;35(2):273–277. doi: 10.2337/dc11-1360. [DOI] [PMC free article] [PubMed] [Google Scholar]
- 29.Burrows NR, Li Y, Geiss LS. Incidence of treatment for end-stage renal disease among individuals with diabetes in the US continues to decline. Diabetes Care. 2010;33(1):73–77. doi: 10.2337/dc09-0343. [DOI] [PMC free article] [PubMed] [Google Scholar]
- 30.Wang J, Williams DE, Narayan KM, Geiss LS. Declining death rates from hyperglycemic crisis among adults with diabetes, US, 1985-2002. Diabetes Care. 2006;29(9):2018–2022. doi: 10.2337/dc06-0311. [DOI] [PubMed] [Google Scholar]
- 31.Wang J, Imai K, Engelgau MM, Geiss LS, Wen C, Zhang P. Secular trends in diabetes-related preventable hospitalizations in the United States, 1998-2006. Diabetes Care. 2009;32(7):1213–1217. doi: 10.2337/dc08-2211. [DOI] [PMC free article] [PubMed] [Google Scholar]
- 32.Indian Health Service Special Diabetes Program for Indians. 2011 Report to Congress: Making Progress Toward a Healthier Future. Rockville, MD: US Department of Health and Human Services; 2012. [Google Scholar]
- 33.Ali MK, Bullard KM, Saaddine JB, Cowie CC, Imperatore G, Gregg EW. Achievement of goals in US diabetes care, 1999–2010. N Engl J Med. 2013;368(17):1613–1624. doi: 10.1056/NEJMsa1213829. [DOI] [PubMed] [Google Scholar]
- 34.Wang J, Geiss LS, Cheng YJ et al. Long-term and recent progress in blood pressure levels among US adults with diagnosed diabetes, 1988–2008. Diabetes Care. 2011;34(7):1579–1581. doi: 10.2337/dc11-0178. [DOI] [PMC free article] [PubMed] [Google Scholar]
- 35.Gregg EW, Cheng YJ, Saydah S et al. Trends in death rates among US adults with and without diabetes between 1997 and 2006: findings from the National Health Interview Survey. Diabetes Care. 2012;35(6):1252–1257. doi: 10.2337/dc11-1162. [DOI] [PMC free article] [PubMed] [Google Scholar]
- 36.Burrows NR, Geiss LS, Engelgau MM, Acton KJ. Prevalence of diabetes among Native Americans and Alaska Natives, 1990-1997: an increasing burden. Diabetes Care. 2000;23(12):1786–1790. doi: 10.2337/diacare.23.12.1786. [DOI] [PubMed] [Google Scholar]
- 37.Ma Y, Hébert JR, Balasubramanian R et al. All-cause, cardiovascular, and cancer mortality rates in postmenopausal White, Black, Hispanic, and Asian women with and without diabetes in the United States. Am J Epidemiol. 2013 doi: 10.1093/aje/kwt177. Epub ahead of print. [DOI] [PMC free article] [PubMed] [Google Scholar]
- 38.Roberts H, Jiles R, Mokdad A, Beckles G, Ríos-Burrows N. Trend analysis of diagnosed diabetes prevalence among American Indian/Alaska Native young adults—United States, 1994–2007. Ethn Dis. 2009;19(3):276–279. [PubMed] [Google Scholar]
- 39.Centers for Disease Control and Prevention. Diagnosed diabetes among American Indians and Alaska Natives aged <35 years—United States, 1994–2004. MMWR Morb Mortal Wkly Rep. 2006;55(44):1201–1203. [PubMed] [Google Scholar]
- 40.Special Diabetes Program for Indians. Overview fact sheet. 2012. Available at: http://www.ihs.gov/MedicalPrograms/Diabetes/HomeDocs/Resources/FactSheets/2012/Fact_Sheet_SDPI_508c.pdf. Accessed September 13, 2013.
- 41.Sequist TD, Cullen T, Bernard K, Shaykevich S, Orav EJ, Ayanian JZ. Trends in quality of care and barriers to improvement in the Indian Health Service. J Gen Intern Med. 2011;26(5):480–486. doi: 10.1007/s11606-010-1594-4. [DOI] [PMC free article] [PubMed] [Google Scholar]
- 42.Sequist TD, Cullen T, Acton KJ. Indian Health Service innovations have helped reduce health disparities affecting American Indian and Alaska Native people. Health Aff (Millwood) 2011;30(10):1965–1973. doi: 10.1377/hlthaff.2011.0630. [DOI] [PubMed] [Google Scholar]
- 43.Jiang L, Manson SM, Beals J et al. Translating the diabetes prevention program into American Indian and Alaska Native communities: results from the Special Diabetes Program for Indians Diabetes Prevention demonstration project. Diabetes Care. 2013;36(7):2027–2034. doi: 10.2337/dc12-1250. [DOI] [PMC free article] [PubMed] [Google Scholar]
- 44.Watson M, Benard V, Thomas C, Brayboy A, Paisano R, Becker T. Cervical cancer incidence and mortality among American Indian and Alaska Native women, 1999-2009. Am J Public Health. 2014;104(6 suppl 3):S415–S422. doi: 10.2105/AJPH.2013.301681. [DOI] [PMC free article] [PubMed] [Google Scholar]
- 45.McEwen LN, Kim C, Hann M et al. Diabetes reporting as a cause of death: results from the Translating Research Into Action for Diabetes (TRIAD) study. Diabetes Care. 2006;29(2):247–253. doi: 10.2337/diacare.29.02.06.dc05-0998. [DOI] [PubMed] [Google Scholar]
- 46.Geiss LS, Herman WH, Smith PJ. Diabetes in America. 2nd ed. Bethesda, MD: National Institutes of Health; 1995. Mortality in non-insulin-dependent diabetes. In: National Diabetes Data Group; pp. 233–257. NIH publication no. 95-1468. [Google Scholar]
- 47.Tierney EF, Geiss LS, Engelgau MM et al. Population-based estimates of mortality associated with diabetes: use of a death certificate check box in North Dakota. Am J Public Health. 2001;91(1):84–92. doi: 10.2105/ajph.91.1.84. [DOI] [PMC free article] [PubMed] [Google Scholar]