

Abstract
Objectives. We evaluated trends and disparities in stroke death rates for American Indians and Alaska Natives (AI/ANs) and White people by Indian Health Service region.
Methods. We identified stroke deaths among AI/AN persons and Whites (adults aged 35 years or older) using National Vital Statistics System data for 1990 to 2009. We used linkages with Indian Health Service patient registration data to adjust for misclassification of race for AI/AN persons. Analyses excluded Hispanics and focused on Contract Health Service Delivery Area (CHSDA) counties.
Results. Stroke death rates among AI/AN individuals were higher than among Whites for both men and women in CHSDA counties and were highest in the youngest age groups. Rates and AI/AN:White rate ratios varied by region, with the highest in Alaska and the lowest in the Southwest. Stroke death rates among AI/AN persons decreased in all regions beginning in 2001.
Conclusions. Although stroke death rates among AI/AN populations have decreased over time, rates are still higher for AI/AN persons than for Whites. Interventions that address reducing stroke risk factors, increasing awareness of stroke symptoms, and increasing access to specialty care for stroke may be more successful at reducing disparities in stroke death rates.
Stroke is the fourth leading cause of death for all persons in the United States and the seventh leading cause of death among American Indian and Alaska Native (AI/AN) persons.1,2 In 2010, stroke caused 559 deaths among AI/AN persons.1 Recent National Vital Statistics System (NVSS) data have typically reported stroke death rates for AI/AN persons to be lower than those for the overall population and non-Hispanic White people.1 However, the prevalence of stroke is higher among the AI/AN population than among any other racial/ethnic group (i.e., in 2010, 5.9% of AI/AN persons and 2.4% of non-Hispanic Whites had a history of stroke).3 In addition, when compared with other racial groups, AI/AN persons report high prevalence of risk factors for stroke, including diabetes, obesity, current smoking, and physical inactivity.4–7
AI/AN populations have a younger mean age at time of death caused by stroke than White populations.7,8 Among younger age groups, stroke incidence9 and mortality (based on NVSS data)10 are higher among AI/AN adults than among non-Hispanic White adults. On the basis of NVSS data for 1995 to 1998, stroke death rates for those aged 25 to 64 years were higher for AI/AN persons than for non-Hispanic White persons,10 and the Strong Heart Study found a higher incidence of stroke among AI/AN persons than non-Hispanic White persons among those aged 45 to 74 years.9 In addition, the Strong Heart Study found higher case fatality rates among their AI/AN participants aged 45 to 74 years at enrollment; 1-year case fatality rates were 1.5 times the rates reported in other studies of majority White participants.9 Though NVSS data show lower overall stroke death rates for AI/AN persons than for non-Hispanic White persons, when restricted to areas served by the Indian Health Service (IHS), stroke death rates among AI/AN men aged 35 to 74 years were comparable with rates for all races (i.e., IHS AI/AN men = 73.6 per 100 000 population; US men, all races = 66.8 per 100 000 population) and significantly higher than those for women (IHS AI/AN women = 66.7 per 100 000; US women, all races = 51.0 per 100 000).11
One explanation for the lower stroke death rates reported by national vital event data is that misclassification of AI/AN persons in the national mortality data sets may result in underestimated death rates for the group.12,13 In this study, we address this issue by using a data set for which IHS patient data have been linked to the NVSS database to provide more accurate classification of AI/AN individuals.
In addition, geographic disparities in stroke death11,14,15 and risk factors for stroke14,16 have been reported for AI/AN persons. Therefore, we examine regional disparities in stroke death by stratifying these unique data according to IHS region and restricting analyses to IHS Contract Health Services Delivery Area (CHSDA) counties.
METHODS
Detailed methods for generating the analytic mortality files are described elsewhere in this supplement.17
Data Sources
Population estimates.
We included bridged single-race population estimates developed by the US Census Bureau and the Centers for Disease Control and Prevention’s National Center for Health Statistics and adjusted for the population shifts caused by Hurricanes Katrina and Rita in 2005 as denominators in the calculation of death rates.18,19 Bridged single-race data allow for comparability between the pre- and post-2000 race/ethnicity population estimates during this study period.
During preliminary analyses, we discovered that the updated bridged intercensal population estimates significantly overestimated AI/AN persons of Hispanic origin.20 Therefore, to avoid underestimating mortality among AI/AN persons, we limited analyses to non-Hispanic AI/AN persons and chose non-Hispanic White persons as the most homogeneous referent group. Henceforth, we omit the qualifying term ‘‘non-Hispanic’’ when discussing both groups (we refer to non-Hispanic AI/AN persons as AI/AN persons and non-Hispanic White persons as Whites).
Death records.
Death certificate data are compiled by each state and sent to the National Center for Health Statistics, where the information is compiled and made available as part of the NVSS.21 The National Center for Health Statistics applies a bridging algorithm nearly identical to that used by the US Census Bureau to assign a single race to decedents with multiple races reported on the death certificate.22
We linked the Indian Health Service (IHS) patient registration database to death certificate data in the National Death Index to identify AI/AN deaths misclassified as non-Native.17 Approximately 62% of all AI/AN persons receive care from the IHS. After this linkage, a flag indicating a positive link to IHS was added to the NVSS mortality file as an additional indicator of AI/AN ancestry.
This file was combined with the population estimates to create an analytic file in SEER*Stat version 8.0.2,23 which includes all deaths reported to the National Center for Health Statistics from 1990 to 2009. For this analysis, we coded stroke as the underlying cause of death for the years 1990 to 1998 according to the International Classification of Diseases Ninth Revision24 (codes 430–434, 436–438). For 1999 to 2009, we used the International Classification of Diseases 10th Revision25 (codes I60–69).
Geographic coverage.
We restricted most of the analyses in this report to Indian Health Service CHSDA or Tribal Service Delivery Area (abbreviated henceforth as CHSDA) counties, which contain federally recognized tribal reservations or off-reservation trust land or are adjacent to these areas.17 The IHS uses CHSDA residence to determine eligibility for services not directly available within the IHS. Linkage studies have indicated less misclassification of race for AI/AN persons in these counties.13,26 The CHSDA counties also have higher proportions of AI/AN persons in relation to total population than do non-CHSDA counties, with 64% of the United States AI/AN population residing in the 637 counties designated as CHSDA; these counties represent 20% of the 3141 counties in the United States.
Although they are less geographically representative, we present analyses restricted to CHSDA counties for death rates in this report for the purpose of offering more internally valid comparisons of rates for AI/AN persons and Whites. For death rates restricted to CHSDA counties, we include data from 35 states and 6 regions. We completed the analyses for all regions combined and by individual IHS region (Table 1). Identical or similar regional analyses have been used for other health-related publications focusing on AI/AN populations.27–29 Additional details about CHSDA counties and IHS regions, including population coverage, are provided elsewhere.16
TABLE 1—
Stroke Deaths, Death Rates, and Rate Ratios by Indian Health Service Region and Sex for American Indian/Alaska Native and White Persons: United States, 1999–2009
| CHSDA Counties |
All Counties |
|||||||
| IHS Region by Sex | AI/AN Stroke Deaths, No. | AI/AN Rate | White Rate | AI/AN:White RRa (95% CI) | AI/AN Stroke Deaths, No. | AI/AN Rate | White Rate | AI/AN:White RRa (95% CI) |
| All regions | ||||||||
| Total | 4984 | 115.5 | 96.9 | 1.19* (1.16, 1.23) | 6937 | 100.0 | 95.1 | 1.05* (1.02, 1.08) |
| Men | 2126 | 115.3 | 96.4 | 1.20* (1.14, 1.25) | 2929 | 98.7 | 94.8 | 1.04 (1.00, 1.08) |
| Women | 2858 | 114.2 | 95.9 | 1.19* (1.15, 1.24) | 4008 | 99.7 | 93.9 | 1.06* (1.03, 1.10) |
| Northern Plains | ||||||||
| Total | 785 | 126.9b | 97.6 | 1.30* (1.20, 1.40) | 1122 | 115.4 | 97.1 | 1.19* (1.11, 1.27) |
| Men | 339 | 129.2 | 99.8 | 1.30* (1.14, 1.47) | 478 | 116.6 | 98.8 | 1.18* (1.06, 1.31) |
| Women | 446 | 124.0 | 95.0 | 1.31* (1.18, 1.44) | 644 | 113.1 | 94.6 | 1.20* (1.10, 1.30) |
| Alaska | ||||||||
| Total | 399 | 144.3b | 95.6 | 1.51* (1.34, 1.70) | 399 | 144.3 | 95.6 | 1.51* (1.34, 1.70) |
| Men | 183 | 150.3 | 95.6 | 1.57* (1.29, 1.90) | 183 | 150.3 | 95.6 | 1.57* (1.29, 1.90) |
| Women | 216 | 138.0 | 94.6 | 1.46* (1.24, 1.71) | 216 | 138.0 | 94.6 | 1.46* (1.24, 1.71) |
| Southern Plains | ||||||||
| Total | 1416 | 141.6b | 114.2 | 1.24* (1.17, 1.31) | 1659 | 128.9 | 107.5 | 1.20* (1.14, 1.26) |
| Men | 579 | 137.6 | 109.4 | 1.26* (1.14, 1.38) | 675 | 123.1 | 103.6 | 1.19* (1.09, 1.29) |
| Women | 837 | 140.3 | 115.8 | 1.21* (1.13, 1.30) | 984 | 129.6 | 108.4 | 1.20* (1.12, 1.27) |
| Southwest | ||||||||
| Total | 1040 | 78.3 | 84.5 | 0.93* (0.87, 0.99) | 1123 | 78.9 | 86.1 | 0.92* (0.86, 0.97) |
| Men | 472 | 84.9 | 80.7 | 1.05 (0.95, 1.16) | 509 | 85.4 | 82.2 | 1.04 (0.94, 1.14) |
| Women | 568 | 73.7 | 86.1 | 0.86* (0.78, 0.93) | 614 | 74.5 | 87.6 | 0.85* (0.78, 0.92) |
| Pacific Coast | ||||||||
| Total | 1024 | 131.4b | 106.5 | 1.23* (1.15, 1.32) | 1344 | 112.0 | 103.0 | 1.09* (1.03, 1.15) |
| Men | 408 | 119.7 | 105.2 | 1.14* (1.01, 1.27) | 537 | 102.1 | 102.1 | 1.00 (0.91, 1.10) |
| Women | 616 | 138.0 | 106.1 | 1.30* (1.19, 1.41) | 807 | 117.7 | 102.4 | 1.15* (1.07, 1.23) |
| East | ||||||||
| Total | 320 | 98.7 | 89.6 | 1.10 (0.98, 1.24) | 1290 | 71.5 | 91.7 | 0.78* (0.73, 0.83) |
| Men | 145 | 101.9 | 90.8 | 1.12 (0.93, 1.34) | 547 | 70.1 | 91.7 | 0.76* (0.69, 0.84) |
| Women | 175 | 94.3 | 87.3 | 1.08 (0.92, 1.26) | 743 | 71.5 | 90.3 | 0.79* (0.73, 0.85) |
Note. AI/AN = American Indian/Alaska Native; CHSDA = Contract Health Service Delivery Area; CI = confidence interval; IHS = Indian Health Service; RR = rate ratio. Analyses are limited to people of non-Hispanic origin aged ≥ 35 years. AI/AN race is reported from death certificates or through linkage with the IHS patient registration database. Rates are per 100 000 persons and are age adjusted to the 2000 US standard population (6 age groups; Census P25-1130). Stroke was defined using International Classification of Diseases, 10th Revision25 (codes I60–I69). IHS regions are defined as follows: Northern Plains (IL, IN, c IA,c MA,c MN,c MT,c NE,c ND,c SD,c WI,c WY); Southern Plains (OK,c KS,c TXc); Southwest (AZ,c CO,c NV,c NM,c UTc); Pacific Coast (CA,c ID,c OR,c WA,c HI); East (AL,c AR, CT,c DE, FL,c GA, KY, LA,c ME,c MD, MA,c MS,c MO, NH, NJ, NY,c NC,c OH, PA,c RI,c SC,c TN, VT, VA, WV, DC, IL, IN,c IA,c MIc).
Source. AI/AN Mortality Database (1990–2009). Data are based on linked Indian Health Service-National Vital Statistics System mortality files.
RRs are calculated in SEER*Stat, version 8.0.2,23 before rounding and may not equal RRs calculated from rates presented in table.
Comparison of region-specific total AI/AN rate to all regions total AI/AN rate is statistically significant (P < .05). Only rates statistically significantly higher than the total rate are noted.
Identifies states with at least 1 county designated as CHSDA. Percentage regional coverage of AI/AN persons in CHSDA counties to AI/AN persons in all counties: Northern Plains = 64.8%; Alaska = 100%; Southern Plains = 76.3%; Southwest = 91.3%; Pacific Coast = 71.3%; East = 18.2%; total US = 64.2%.
*P < .05.
Statistical Methods
We directly age-standardized all rates, expressed per 100 000 population, to the 2000 US standard population and 6 age groups (35–44 years, 45–54 years, 55–64 years, 65–74 years, 75–84 years, 85 years or older) in accordance with a 1998 US Department of Health and Human Services recommendation.30–31 Readers should avoid comparison of these data with published death rates calculated with a different age-standard population.
Using the age-standardized death rates, we calculated rate ratios (RRs) comparing AI/AN persons with Whites, a population that provides more homogeneity across regions. We calculated confidence intervals for age-standardized rates and RRs as described by Tiwari et al.32
We conducted trend analyses and comparability tests for age-standardized death rates by using Joinpoint software, version 4.0.3.33 The number of trend segments is based on a segmented line regression analysis of best fit with the smallest number of joinpoints, or points at which the direction of the trend line changes. We calculated annual percentage change for each of the trend segments and average annual percentage change (AAPC) for 2001 to 2009 to quantify the average trend over this period. We conducted tests to assess pairwise differences between AI/AN persons and Whites to determine whether the trend lines were parallel or coincident.34 Tests determine whether (1) 2 joinpoint regression functions are identical (test of coincidence) or (2) 2 regression mean functions are parallel (test of parallelism). We conducted all trend analyses among CHSDA counties only. Statistical significance was set at a P level of less than .05.
RESULTS
We included an additional 1033 stroke deaths for AI/AN persons in our analyses when compared with the NVSS mortality file before linkage (6937 deaths compared with 5904). The total stroke death rate for AI/AN persons for 1999 to 2009 (Table 1) was greater for CHSDA counties (115.5) than for all counties (100.0). The RRs comparing AI/AN persons with Whites were also statistically significantly higher for CHSDA counties (1.19) than for all counties (1.05). The remaining analyses are confined to CHSDA counties only.
In CHSDA counties, the stroke death rate for AI/AN persons for all regions combined was similar for men (115.3) and women (114.2; Table 1). Rates varied by IHS region. Alaska (144.3) and the Southern Plains (141.6) consistently had the highest stroke death rates among AI/AN persons; these elevated rates were present for AI/AN women, men, and the total population in these regions. AI/AN persons in the Southwest had the lowest rates (78.3).
Stroke death RRs comparing AI/AN persons with Whites varied across IHS regions and were significantly higher for AI/AN persons than Whites in most areas. For men, women, and both sexes combined, the highest RRs for AI/AN persons compared with Whites occurred in Alaska (RR for both sexes = 1.51; RR for men = 1.57; RR for women = 1.46; Table 1). The Southwest region was the only region in which the RR was higher for Whites than for AI/AN women (0.86) and both sexes combined (0.93).
In all regions combined, stroke death rates were higher for AI/AN persons than for Whites in all age groups except 85 years and older (Table 2). RRs for AI/AN persons compared with Whites were highest in every IHS region in the youngest age group (35–44 years), ranging from 7.40 in Alaska to 1.66 in the Southwest. In the oldest age group (≥ 85 years), rates were statistically significantly lower among AI/AN persons than Whites in the Southwest (RR = .77).
TABLE 2—
Stroke Deaths, Rates, and Rate Ratios by Indian Health Service Region and Age for American Indian/Alaska Native and White Persons: United States, 1999–2009
| CHSDA Counties |
All Counties |
|||||||
| IHS Region by Age Group | AI/AN Stroke Deaths | AI/AN Rate | White Rate | AI/AN:White RRa (95% CI) | AI/AN Stroke Deaths | AI/AN Rate | White Rate | AI/AN:White RRa (95% CI) |
| All regions | ||||||||
| 35–44 y | 235 | 10.0 | 4.0 | 2.50* (2.18, 2.85) | 327 | 8.4 | 4.0 | 2.07* (1.85, 2.31) |
| 45–54 y | 450 | 21.9 | 10.9 | 2.01* (1.82, 2.21) | 625 | 17.6 | 11.0 | 1.60* (1.48, 1.73) |
| 55–64 y | 619 | 48.4 | 27.5 | 1.76* (1.62, 1.91) | 878 | 40.2 | 28.2 | 1.42* (1.33, 1.52) |
| 65–74 y | 1025 | 147.7 | 96.9 | 1.52* (1.43, 1.62) | 1432 | 129.1 | 97.6 | 1.32* (1.26, 1.39) |
| 75–84 y | 1430 | 450.0 | 386.6 | 1.16* (1.10, 1.23) | 1991 | 395.9 | 378.2 | 1.05* (1.00, 1.09) |
| ≥ 85 years | 1225 | 1309.9 | 1371.8 | 0.95 (0.90, 1.01) | 1684 | 1133.0 | 1329.5 | 0.85* (0.81, 0.89) |
| Northern Plains | ||||||||
| 35–44 y | 41 | 10.5 | 4.1 | 2.58* (1.83, 3.55) | 68 | 10.4 | 3.8 | 2.71* (2.10, 3.45) |
| 45–54 y | 85 | 25.9 | 10.0 | 2.58* (2.05, 3.22) | 126 | 22.6 | 10.1 | 2.23* (1.85, 2.66) |
| 55–64 y | 98 | 50.6 | 25.5 | 1.98* (1.60, 2.43) | 143 | 44.5 | 26.4 | 1.69* (1.42, 1.99) |
| 65–74 y | 201 | 196.8 | 91.7 | 2.15* (1.85, 2.47) | 260 | 165.8 | 97.4 | 1.70* (1.50, 1.92) |
| 75–84 y | 220 | 514.1 | 387.4 | 1.33* (1.16, 1.52) | 319 | 485.6 | 385.7 | 1.26* (1.12, 1.41) |
| ≥ 85 years | 140 | 1238.4 | 1433.1 | 0.86 (0.73, 1.02) | 206 | 1138.1 | 1391.9 | 0.82* (0.71, 0.94) |
| Alaska | ||||||||
| 35–44 y | 34 | 20.8 | 2.8 | 7.40* (4.23, 13.15) | 34 | 20.8 | 2.8 | 7.40* (4.23, 13.15) |
| 45–54 y | 37 | 26.4 | 8.2 | 3.22* (2.11, 4.85) | 37 | 26.4 | 8.2 | 3.22* (2.11, 4.85) |
| 55–64 y | 39 | 47.3 | 20.0 | 2.37* (1.60, 3.45) | 39 | 47.3 | 20.0 | 2.37* (1.60, 3.45) |
| 65–74 y | 72 | 156.3 | 95.2 | 1.64* (1.24, 2.16) | 72 | 156.3 | 95.2 | 1.64* (1.24, 2.16) |
| 75–84 y | 132 | 628.1 | 419.1 | 1.50* (1.22, 1.82) | 132 | 628.1 | 419.1 | 1.50* (1.22, 1.82) |
| ≥ 85 years | 85 | 1560.8 | 1318.8 | 1.18 (0.92, 1.50) | 85 | 1560.8 | 1318.8 | 1.18 (0.92, 1.50) |
| Southern Plains | ||||||||
| 35–44 y | 49 | 10.3 | 6.1 | 1.69* (1.22, 2.30) | 56 | 8.5 | 4.6 | 1.84* (1.38, 2.40) |
| 45–54 y | 102 | 23.7 | 15.6 | 1.52* (1.22, 1.87) | 122 | 19.9 | 12.3 | 1.61* (1.34, 1.93) |
| 55–64 y | 162 | 57.0 | 37.7 | 1.51* (1.28, 1.78) | 189 | 47.5 | 32.3 | 1.47* (1.27, 1.70) |
| 65–74 y | 257 | 159.0 | 120.9 | 1.32* (1.15, 1.49) | 306 | 144.2 | 107.0 | 1.35* (1.20, 1.51) |
| 75–84 y | 433 | 541.8 | 450.7 | 1.20* (1.09, 1.32) | 495 | 490.2 | 425.7 | 1.15* (1.05, 1.26) |
| ≥ 85 years | 413 | 1788.5 | 1532.6 | 1.17* (1.05, 1.29) | 491 | 1687.6 | 1520.1 | 1.11* (1.01, 1.21) |
| Southwest | ||||||||
| 35–44 y | 48 | 6.7 | 4.0 | 1.66* (1.20, 2.24) | 54 | 6.8 | 3.6 | 1.87* (1.39, 2.47) |
| 45–54 y | 93 | 15.9 | 10.8 | 1.48* (1.18, 1.82) | 101 | 15.5 | 9.8 | 1.57* (1.27, 1.92) |
| 55–64 y | 136 | 38.2 | 26.5 | 1.44* (1.20, 1.71) | 144 | 36.6 | 25.1 | 1.45* (1.22, 1.72) |
| 65–74 y | 207 | 101.5 | 85.5 | 1.19* (1.03, 1.36) | 231 | 105.4 | 85.2 | 1.24* (1.08, 1.41) |
| 75–84 y | 270 | 282.1 | 328.6 | 0.86* (0.76, 0.97) | 290 | 285.1 | 340.2 | 0.84* (0.74, 0.94) |
| ≥ 85 years | 286 | 907.9 | 1186.1 | 0.77* (0.68, 0.86) | 303 | 915.7 | 1225.0 | 0.75* (0.67, 0.84) |
| Pacific Coast | ||||||||
| 35–44 y | 42 | 9.5 | 3.7 | 2.55* (1.82, 3.47) | 52 | 7.9 | 3.6 | 2.17* (1.61, 2.86) |
| 45–54 y | 98 | 23.3 | 11.0 | 2.13* (1.72, 2.60) | 124 | 19.5 | 10.7 | 1.83* (1.52, 2.19) |
| 55–64 y | 136 | 51.5 | 27.5 | 1.87* (1.57, 2.22) | 183 | 45.7 | 27.0 | 1.69* (1.45, 1.96) |
| 65–74 y | 221 | 168.9 | 104.2 | 1.62* (1.41, 1.85) | 289 | 148.2 | 101.3 | 1.46* (1.30, 1.64) |
| 75–84 y | 292 | 522.4 | 431.5 | 1.21* (1.08, 1.36) | 380 | 443.8 | 417.6 | 1.06 (0.96, 1.18) |
| ≥ 85 years | 235 | 1508.2 | 1530.4 | 0.99 (0.86, 1.12) | 316 | 1266.5 | 1473 | 0.86* (0.77, 0.96) |
| East | ||||||||
| 35–44 y | 21 | 12.4 | 3.8 | 3.25* (2.00, 5.00) | 63 | 6.5 | 4.2 | 1.55* (1.19, 1.99) |
| 45–54 y | 35 | 22.5 | 10.5 | 2.14* (1.49, 2.99) | 115 | 12.1 | 11.3 | 1.07 (0.88, 1.29) |
| 55–64 y | 48 | 49.1 | 27.1 | 1.81* (1.34, 2.41) | 180 | 30.6 | 28.8 | 1.06 (0.91, 1.23) |
| 65–74 y | 67 | 136.3 | 93.5 | 1.46* (1.13, 1.85) | 274 | 98.0 | 96.7 | 1.01 (0.90, 1.14) |
| 75–84 y | 83 | 369.5 | 358.1 | 1.03 (0.82, 1.28) | 375 | 293.3 | 363.9 | 0.81* (0.73, 0.89) |
| ≥ 85 years | 66 | 1001.2 | 1234.5 | 0.81 (0.63, 1.03) | 283 | 745.7 | 1255.3 | 0.59* (0.53, 0.67) |
Note. AI/AN = American Indian/Alaska Native; CHSDA = Contract Health Service Delivery Area; CI = confidence interval; IHS = Indian Health Service; RR = rate ratio. Analyses are limited to people of non-Hispanic origin. AI/AN race is reported from death certificates or through linkage with the IHS patient registration database. Rates are per 100 000 people. Stroke is defined using the International Classification of Diseases, 10th Edition25 (codes I60–I69). IHS regions are defined as follows: Northern Plains (IL, IN, b IA,b MA,b MN,b MT,b NE,b ND,b SD,b WI,b WYb); Southern Plains (OK,b KS,b TXb); Southwest (AZ,b CO,b NV,b NM,b UTb); Pacific Coast (CA,b ID,b OR,b WA,b HI); East (AL,b AR, CT,b DE, FL,b GA, KY, LA,b ME,b MD, MA,b MS,b MO, NH, NJ, NY,b NC,b OH, PA,b RI,b SC,b TN, VT, VA, WV, DC, IL, IN,b IA,b MIb).
Source. AI/AN Mortality Database (1990–2009). Data are based on linked Indian Health Service-National Vital Statistics System mortality files.
RRs are calculated in SEER*Stat, version 8.0.2,23 before rounding of rates and may not equal RRs calculated from rates presented in table.
Identifies states with at least 1 county designated as CHSDA. Percentage regional coverage of AI/AN persons in CHSDA counties to AI/AN persons in all counties: Northern Plains = 64.8%; Alaska = 100%; Southern Plains = 76.3%; Southwest = 91.3%; Pacific Coast = 71.3%; East = 18.2%; total US = 64.2%.
*P < .05.
Although no significant change in stroke death rates occurred among AI/AN persons during 1990 to 2001, the joinpoint trend analysis showed a significant downward trend in stroke death rates among AI/AN persons from 2001 to 2009 (annual percentage change = −4.3; Figure 1). Rates among Whites declined similarly over the same time period but with different joinpoints. The AAPC for 2001–2009 shows no significant differences in the average trend for AI/AN persons and Whites. Comparison tests show the overall trends from 1990 to 2009 for AI/AN persons and Whites to be parallel, but not coincident (rates for AI/AN persons were higher and peaked in 2001 compared with 2000 for Whites).
FIGURE 1—
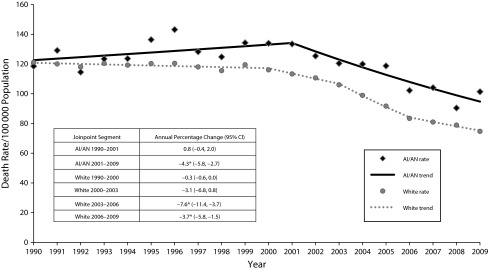
Age-standardized stroke death rates and trend lines for American Indian/Alaska Native and White persons, Contract Health Service Delivery Area counties: United States, 1990–2009.
Note. AI/AN = American Indian/Alaska Native; CI = confidence interval. Analyses are limited to people of non-Hispanic origin. AI/AN race is reported from death certificates or through linkage with the Indian Health Service patient registration database. Rates are per 100 000 people and are age-adjusted to the 2000 US standard population (6 age groups; Census P25-1130). Stroke was defined using International Classification of Diseases, Tenth Edition25 (codes I60–I69) and International Classification of Diseases, Ninth Edition24 (codes 430–434, 436–438).
Source. AI/AN Mortality Database (1990–2009). Data are based on linked Indian Health Service-National Vital Statistics System mortality files. The following states and years of data were excluded because Hispanic origin was not collected on the death certificate: LA, 1990; NH, 1990–1992; OK, 1990–1996.
*P < .05.
Trend analyses for 1990 to 2009 show differences by region in the segments and slopes of the trend lines (Table 3). During 2001 to 2009, all regions except Alaska and the East experienced a statistically significant reduction in the stroke death rate for AI/AN persons (Northern Plains AAPC = −4.6; Southern Plains AAPC = −3.3; Pacific Coast AAPC = −5.6; Southwest AAPC = −5.0). When comparing the AAPCs for 2001 to 2009, we found no significant differences between AI/AN persons and Whites within regions, except in Alaska. From 1990 to 2009, the relative percentage of change over time was similar for all regions. On the basis of the trends shown in Table 3, comparison tests showed that the trends from 1990 to 2009 for AI/AN persons and Whites were parallel but not coincident for the Northern Plains, Southern Plains, and Pacific Coast.
TABLE 3—
Stroke Death Rate Trends With Joinpoint Analyses by Indian Health Service Region for American Indian/Alaska Native and White People, Contract Health Service Delivery Area Counties: United States, 1990–2009
| Modeled Rate |
Trend 1 |
Trend 2 |
Trend 3 |
Trend 4 |
||||||||
| IHS Region and Race | 1990 | 2009 | Years | APCa | Years | APCa | Years | APCa | Years | APCa | AAPC 2001–2009 (95% CI) | RPC |
| Northern Plains | ||||||||||||
| AI/AN | 181.0 | 101.0 | 1990–1997 | −0.2 | 1997–2009 | −4.6* | … | … | … | … | −4.6* (−6.2, −3.0) | −44 |
| White | 128.0 | 75.3 | 1990–2001 | −0.9* | 2001–2009 | −5.2* | … | … | … | … | −5.2* (−5.9, −4.6) | −41 |
| Alaska | ||||||||||||
| AI/AN | 145.9 | 150.6 | 1990–2009 | 0.2 | … | … | … | … | … | … | 0.2 (−1.6, 2.0) | 3 |
| White | 119.6 | 71.3 | 1990–2000 | 0.3 | 2000–2009 | −5.9* | … | … | … | … | −5.9* (−8.1, −3.7) | −40 |
| Southern Plainsb | ||||||||||||
| AI/AN | … | 123.2 | 1997–2001 | 5.4 | 2001–2009 | −3.3* | … | … | … | … | −3.3* (−5.5, −1.0) | … |
| White | … | 94.0 | 1997–2002 | 0.1 | 2002–2009 | −4.2* | … | … | … | … | −3.6* (−4.9, −2.4) | … |
| Pacific Coast | ||||||||||||
| AI/AN | 134.3 | 102.1 | 1990–2001 | 1.7 | 2001–2009 | −5.6* | … | … | … | … | −5.6* (−9.0, −2.0) | −24 |
| White | 130.9 | 77.9 | 1990–1999 | 0.1 | 1999–2003 | −1.8 | 2003–2006 | −9.9* | 2006–2009 | −4.6* | −5.9* (−8.4, −3.4) | −40 |
| East | ||||||||||||
| AI/AN | 124.4 | 88.9 | 1990–2009 | −1.8 | … | … | … | … | … | … | −1.8 (−3.5, 0.0) | −29 |
| White | 113.4 | 72.8 | 1990–2000 | −0.5* | 2000–2003 | −3.7* | 2003–2006 | −6.6* | 2006–2009 | −2.3* | −4.3* (−5.6, −2.9) | −36 |
| Southwest | ||||||||||||
| AI/AN | 90.8 | 60.5 | 1990–1999 | 1.2 | 1999–2009 | −5.0* | … | … | … | … | −5.0* (−7.1, −2.9) | −33 |
| White | 107.3 | 64.2 | 1990–2000 | −0.1 | 2000–2009 | −5.5* | … | … | … | … | −5.5* (−6.2, −4.8) | −40 |
Note. AAPC = average annual percentage change; AI/AN = American Indian/Alaska Native; IHS = Indian Health Service; APC = annual percentage change; CI = confidence interval; RPC = relative percentage change. Analyses are limited to persons of non-Hispanic origin. AI/AN race is reported from death certificates or through linkage with the IHS patient registration database. Rates are per 100 000 people and are age adjusted to the 2000 US standard population (6 age groups; Census P25-1130). Stroke is defined using International Classification of Diseases, 10th Edition25 (codes I60–I69) and the International Classification of Diseases, 9th Edition24 (codes 430–434, 436–438). IHS regions are defined as follows: Northern Plains (IL, IN, c IA,c MA,c MN,c MT,c NE,c ND,c SD,c WI,c WYc); Southern Plains (OK,c KS,c TXc); Southwest (AZ,c CO,c NV,c NM,c UTc); Pacific Coast (CA,c ID,c OR,c WA,c HI); East (AL,c AR, CT,c DE, FL,c GA, KY, LA,c ME,c MD, MA,c MS,c MO, NH, NJ, NY,c NC,c OH, PA,c RI,c SC,c TN, VT, VA, WV, DC, IL, IN,c IA,c MIc).
Source. AI/AN Mortality Database (1990–2009). Data are based on linked Indian Health Service-National Vital Statistics System mortality files. The following states and years of data are excluded because Hispanic origin was not collected on the death certificate: LA: 1990, NH: 1990–1992, OK: 1990–1996.
Number of trend segments and joinpoints varies and is based on the joinpoint regression analysis of best fit with the smallest number of joinpoints. Some regions have only 1 trend line for AI/AN persons or Whites for the time period 1990–2009, whereas others have as many as 4.
Trends before 1997 for Southern Plains are not included because small numbers (caused by the exclusion criteria noted earlier) lead to unstable estimates. RPC is not calculated. The rate in 1997 was 130.3 per 100 000 for AI/AN persons and 126.0 per 100 000 for Whites.
Identifies states with at least 1 county designated as Contract Health Service Delivery Area. Percentage regional coverage of AI/AN persons in Contract Health Service Delivery Area counties to AI/AN persons in all counties: Northern Plains = 64.8%; Alaska = 100%; Southern Plains = 76.3%; Southwest = 91.3%; Pacific Coast = 71.3%; East = 18.2%; total US = 64.2%.
*P < .05.
DISCUSSION
We found stroke death rates to be higher for AI/AN persons than Whites in CHSDA counties for men, women, and both sexes combined. Disparities in rates for AI/AN persons compared with Whites were greatest in the youngest age groups. Geographic disparities in stroke death rates among AI/AN persons exist; rates were highest in Alaska and the Southern Plains and lowest in the Southwest. AI/AN:White RRs were highest in Alaska and showed the opposite association (higher rates among Whites) in the Southwest. Trends in stroke death rates for AI/AN persons have declined since 2001, though they are still higher than those for Whites.
Our findings of higher stroke death rates among AI/AN persons than Whites in CHSDA counties is in keeping with previous studies that reported higher prevalence of stroke risk factors among AI/AN persons than among Whites. Though hypertension rates are similar for AI/AN persons and Whites, AI/AN populations have higher prevalence of cigarette smoking, obesity, and diabetes and lower prevalence of leisure-time physical activity.7,35 In addition, compared with Whites, low-income AI/AN persons are more likely to have insurance coverage only through public or state programs or IHS (51% vs 18%), though the percentage of uninsured people is similar.36 AI/AN persons with access only to IHS had lower access to and use of preventive care, including unmet prescription drug needs, though most of these differences were attenuated when family income was included in the models.36
Similar to other studies, we found higher RRs among younger age groups when comparing stroke deaths among AI/AN persons with those among White people.10,37 Among those aged 35 to 44 years, RRs in our study were higher in Alaska (RR = 7.40) than in all other regions except the East. A study of stroke mortality among Alaska Natives found higher RRs when comparing Alaska Natives with Whites in the United States for both hemorrhagic and ischemic stroke among men and women in the birth to 44 years and 45 to 64 years age groups.37 Previous studies have found some risk factors for stroke to be higher among younger AI/AN age groups (18–24 years and 25–44 years) than among older AI/AN age groups, including smoking and low fruit or vegetable consumption.38 A study of AI/AN adults with diabetes found body mass index to be inversely related to age, with the highest mean body mass index among those aged 18 to 39 years.39
Both AI/AN persons and Whites saw a decline in stroke deaths over the past 10 years. Beginning in 2001, the AAPCs for AI/AN persons and Whites were not significantly different (−4.3 for AI/AN persons, −5.0 for Whites), showing a marked decline in stroke death rates among both populations. Other studies have attributed the decline in stroke deaths beginning near 2000 to improved awareness, treatment, and control of high blood pressure and high cholesterol, a decrease in smoking rates, and improvements in acute stroke treatment.40 However, the death rate for AI/AN persons was higher than that for Whites at the beginning of this period; therefore, the rates for AI/AN persons have lagged behind those for Whites.
By IHS region, 4 of 6 regions had higher stroke death rates for AI/AN persons than for Whites both overall and by sex (i.e., Alaska, Northern Plains, Southern Plains, Pacific Coast), and these regions also had higher stroke death rates than all regions combined. Although stroke death rates decreased over time for both AI/AN persons and Whites, we found regional differences in the trends among AI/AN persons, most notably a slower decline in Alaska than in several other regions. These regional differences may reflect geographic variation in stroke risk factors. Previous studies have found diabetes prevalence for AI/AN persons to be higher than that for Whites in all regions except Alaska.41 Among AI/AN persons with diabetes, the prevalence of high blood pressure is highest in the Southern Plains, the prevalence of high cholesterol and obesity is highest in Alaska and the Pacific Coast, and the prevalence of tobacco use is highest in the Northern Plains.42 Among all AI/AN persons, the prevalence of obesity, no leisure-time physical activity, and binge drinking was similar across all regions, but the prevalence of smoking was highest in Alaska and the Northern Plains.41
Access to appropriate primary and acute care may vary by the region’s degree of rurality. Approximately half of the CHSDA counties are considered rural, with Alaska counties being the most rural. A previous study found that Medicare beneficiaries living in rural areas have fewer overall medical visits and travel greater distances for care than those living in urban areas.43 Timely treatment of an acute stroke event is critical; delays in treatment, such as those related to access to acute stroke care, contribute to potential disability or death.7,44
To increase awareness of stroke warning signs and symptoms and the importance of calling 911 immediately at the onset of symptoms, the National Institute of Neurologic Disorders and Stroke launched the Know Stroke campaign in 2008.45 In addition, some states and tribal areas with heart disease and stroke prevention programs are conducting similar activities to increase stroke symptom awareness (e.g., Montana Stroke Storm Watch Campaign, Take Heart Alaska Coalition).46,47 However, recognizing the warning signs of a stroke is only the first in a sequence of steps required for early and effective intervention. To maximize the benefits of tissue plasminogen activator, patients must receive rapid transport and appropriate diagnosis of acute ischemic stroke symptoms. These drugs should be administered within 3 hours of symptom onset43; however, before administration, differential diagnosis is required to distinguish between a hemorrhagic and ischemic stroke because tissue plasminogen activator is contraindicated in cases of hemorrhagic stroke. AI/AN adults aged 25 to 44 years have a higher RR than Whites in the United States for both types of stroke, and AI/AN women have higher rates of subarachnoid hemorrhage.2–4 People living in many rural areas, especially on tribal lands far from hospitals able to provide the best care for stroke, are at a great disadvantage in accessing appropriate timely treatment. Many health care system certification programs (e.g., the Joint Commission) focus on providing quality care and improving stroke outcomes in their certified hospitals. However, the majority of these care facilities are located in urban areas. The expansion of telemedicine for stroke care delivery can help to provide care in rural or isolated areas.48 Several AI/AN communities are implementing telemedicine in their hospitals (e.g., Arizona Telemedicine Program),49 and the US Department of Health and Human Services Health Resources and Services Administration is funding projects for AI/AN tribal organizations and other nonprofit groups to expand the use of telehealth networks to improve health care services for medically underserved populations in urban, rural, and frontier communities.50
Healthy People 2020, a program of health promotion and disease prevention goals set by the US Department of Health and Human Services, includes objectives intended to eliminate disparities and ensure that federal, state, tribal, and local health agencies have the necessary infrastructure to effectively provide essential public health services.51 One of the Healthy People 2010 objectives (12-7) was to reduce stroke deaths to a 2010 target of 48 stroke deaths per 100 000 population,52 and the Healthy People 2020 objective for stroke (HDS-3) is to reduce stroke mortality to 33.8 stroke deaths per 100 000. Although stroke death rates among AI/AN persons in 2009 have decreased since 2000, AI/AN persons still have more than 2 times the rate of the 2010 objective and more than 3 times the rate of the 2020 objective.
Strengths and Limitations
These results provide estimates of stroke death rates and RRs by using the IHS patient registration database to identify AI/AN decedents who would not otherwise be coded as such. A previous misclassification-adjusted cardiovascular disease mortality study found an 11% increase in stroke death rates after adjustment.12 We included 17% more stroke deaths among AI/AN persons than the NVSS mortality file before linkage. In addition, our results showed overall higher rates and RRs when analyses were restricted to CHSDA counties only. Several states contain only CHSDA counties (Alaska, Arizona, Connecticut, Nevada, Oklahoma, South Carolina), but other states contain only a few or no CHSDA counties. Limiting our analyses to CHSDA counties provides a more accurate comparison between AI/AN and White populations because the proportion of AI/AN persons to the total population is higher in CHSDA counties, with less misclassification than in non-CHSDA counties.13,53
Our study should be interpreted within the context of several limitations. AI/AN persons who did not have a patient record with IHS (approximately 38% of all AI/AN persons) or who were not listed as AI/AN on a death certificate could not be categorized as such in this study. Substantial variation exists between federally recognized tribes in the proportion of native ancestry required for tribal membership and therefore for eligibility for IHS services. Whether and how this discrepancy in tribal membership requirements may influence some of our findings is unclear, although our findings are consistent with prior reports. The findings from CHSDA counties highlighted in this supplement do not represent all US AI/AN populations in individual IHS regions.53 In addition, including only those deaths with the underlying cause of death listed as stroke compared to any contributing cause may provide a conservative estimate of stroke death rates. Finally, although the exclusion of non-Hispanic AI/AN persons from the analyses reduced the overall AI/AN deaths by less than 5%, it may disproportionately affect some states.
Conclusions
Linking IHS patient registration information to mortality data allows for more accurate documentation of the burden and risk of stroke death among AI/AN people. Within CHSDA counties, stroke death rates were higher for AI/AN persons than for Whites, especially among the younger age groups and in Alaska. AI/AN persons frequently live in rural locations, making access to primary prevention, timely acute care, and secondary care for stroke challenging. AI/AN persons also experience increased risk factors for stroke. Interventions that address reducing stroke risk factors, increasing awareness of stroke symptoms (to allow prompt access to care for diagnosis and treatment), and increasing the accessibility of specialty care for stroke in rural areas, including the use of telemedicine, may be more successful at reducing disparities in stroke death rates in the AI/AN population.
Acknowledgments
We thank Shifan Dai from the Centers for Disease Control and Prevention for his assistance with the design of the study.
Human Participant Protection
Human participants were not involved in this study.
References
- 1.Murphy SL, Xu J, Kochanek KD. Deaths: Final data for 2010. Natl Vital Stat Rep. 2013;61(4) [PubMed] [Google Scholar]
- 2.Hall MJ, Levant S, DeFrances CJ. Hospitalization for stroke in U.S. hospitals, 1989-2009. NCHS Data Brief. 2012;95:1–8. [PubMed] [Google Scholar]
- 3.Centers for Disease Control and Prevention. Prevalence of stroke–United States, 2006-2010. MMWR Morb Mortal Wkly Rep. 2012;61(20):379–382. [PubMed] [Google Scholar]
- 4.Galloway JM. Cardiovascular health among American Indians and Alaska Natives: successes, challenges, and potentials. Am J Prev Med. 2005;29(5 suppl 1):11–17. doi: 10.1016/j.amepre.2005.07.023. [DOI] [PubMed] [Google Scholar]
- 5.Hayes DK, Denny CH, Keenan NL, Croft JB, Sundaram AA, Greenlund KJ. Racial/ethnic and socioeconomic differences in multiple risk factors for heart disease and stroke in women: Behavioral Risk Factor Surveillance System, 2003. J Womens Health (Larchmt) 2006;15(9):1000–1008. doi: 10.1089/jwh.2006.15.1000. [DOI] [PubMed] [Google Scholar]
- 6.Health, United States, 2010: With Special Feature on Death and Dying. Hyattsville, MD: National Center for Health Statistics; 2011. [PubMed] [Google Scholar]
- 7.Go AS, Mozaffarian D, Roger VL. Heart disease and stroke statistics–2013 update: a report from the American Heart Association. Circulation. 2013;127(1):e6–e245. doi: 10.1161/CIR.0b013e31828124ad. [DOI] [PMC free article] [PubMed] [Google Scholar]
- 8.Centers for Disease Control and Prevention. Disparities in deaths from stroke among persons aged <75 years—United States, 2002. MMWR Morb Mortal Wkly Rep. 2005(54):477–481. [PubMed] [Google Scholar]
- 9.Zhang Y, Galloway JM, Welty TK et al. Incidence and risk factors for stroke in American Indians: the Strong Heart Study. Circulation. 2008;118(15):1577–1584. doi: 10.1161/CIRCULATIONAHA.108.772285. [DOI] [PMC free article] [PubMed] [Google Scholar]
- 10.Ayala C, Greenlund KJ, Croft JB et al. Racial/ethnic disparities in mortality by stroke subtype in the United States, 1995-1998. Am J Epidemiol. 2001;154(11):1057–1063. doi: 10.1093/aje/154.11.1057. [DOI] [PubMed] [Google Scholar]
- 11.Indian Health Service. Regional Differences in Indian Health: 2002-2003. Bethesda, MD: US Department of Health and Human Services; 2008. [Google Scholar]
- 12.Rhoades DA. Racial misclassification and disparities in cardiovascular disease among American Indians and Alaska Natives. Circulation. 2005;111(10):1250–1256. doi: 10.1161/01.CIR.0000157735.25005.3F. [DOI] [PubMed] [Google Scholar]
- 13.Jim MA, Seneca D, Arias E, Hoopes M, Jim C, Wiggins C. Racial misclassification of American Indian and Alaska Natives by Indian Health Service Contract Health Service Delivery area. Am J Public Health. 2014;104(6 suppl 3):S295–S302. doi: 10.2105/AJPH.2014.301933. [DOI] [PMC free article] [PubMed] [Google Scholar]
- 14.Casper M, Denny C, Coolidge J . Atlas of Heart Disease and Stroke Among American Indians and Alaska Natives. Atlanta, GA: US Department of Health and Human Services, Centers for Disease Control and Prevention and Indian Health Service; 2005. [Google Scholar]
- 15.Casper ML, Barnett E, Williams G, Halverson JA, Braham VE, Greenlund KJ. Atlas of Stroke Mortality: Racial, Ethnic and Geographic Disparities in the United States. Atlanta, GA: US Department of Health and Human Services, Centers for Disease Control and Prevention; 2003. [Google Scholar]
- 16.Levin S, Welch VL, Bell RA, Casper ML. Geographic variation in cardiovascular disease risk factors among American Indians and comparisons with the corresponding state populations. Ethn Health. 2002;7(1):57–67. doi: 10.1080/13557850220146993. [DOI] [PubMed] [Google Scholar]
- 17.Espey DK, Jim MA, Begay C, Haverkamp D, Richards T, Roberts D. Methods for improving the quality and completeness of mortality data for American Indians and Alaska Natives. Am J Public Health. 2014;104(6 suppl 3):S286–S294. doi: 10.2105/AJPH.2013.301716. [DOI] [PMC free article] [PubMed] [Google Scholar]
- 18.National Center for Health Statistics. U.S. Census populations with bridged race categories. Available at: http://www.cdc.gov/nchs/nvss/bridged_race.htm. Accessed March 13, 2013.
- 19.National Cancer Institute—Surveillance. Adjusted populations for the counties/parishes affected by Hurricanes Katrina and Rita. Available at: http://seer.cancer.gov/popdata/hurricane_adj.html. Accessed March 18, 2013.
- 20.Edwards BK, Noone AM, Mariotto AB, et al. Annual report to the nation on the status of cancer, 1975–2010, featuring prevalence of comorbidity and impact on survival among persons with lung, colorectal, breast, or prostate cancer. Cancer. 2013 doi: 10.1002/cncr.28509. Epub ahead of print. [DOI] [PMC free article] [PubMed] [Google Scholar]
- 21.National Center for Health Statistics. National Vital Statistics System. Available at: http://www.cdc.gov/nchs/nvss.htm. Accessed May 2, 2012.
- 22. Weed J. NCHS procedures for multiple-race and Hispanic origin data: collection, coding, editing, and transmitting. Presented at: Joint Meeting of the National Association for Public Health Statistics and Information Systems and the Vital Statistics Cooperative Program; June 6–10, 2004; Portland, OR. Available at: http://www.cdc.gov/nchs/data/dvs/multiple_race_documentation_5-10-04.pdf. Accessed March 18, 2013.
- 23. SEER*Stat [computer program]. Version 8.0.2. National Cancer Institute. 2013. Available at: http://www.seer.cancer.gov/seerstat. Accessed January 27, 2014.
- 24.International Classification of Diseases, Ninth Revision. Geneva, Switzerland: World Health Organization; 1980. [Google Scholar]
- 25.International Classification of Diseases, 10th Revision. Geneva, Switzerland: World Health Organization; 1992. [Google Scholar]
- 26.Arias E, Schauman WS, Eschbach K, Sorlie PD, Backlund E. The validity of race and Hispanic origin reporting on death certificates in the United States. National Center for Health Statistics. Vital Health Stat 2. 2008;148:1–23. [PubMed] [Google Scholar]
- 27.Denny CH, Taylor TL. American Indian and Alaska Native health behavior: findings from the Behavioral Risk Factor Surveillance System, 1992-1995. Ethn Dis. 1999;9(3):403–409. [PubMed] [Google Scholar]
- 28.Espey D, Paisano R, Cobb N. Regional patterns and trends in cancer mortality among American Indians and Alaska Natives, 1990-2001. Cancer. 2005;103(5):1045–1053. doi: 10.1002/cncr.20876. [DOI] [PubMed] [Google Scholar]
- 29.Wiggins CL, Espey DK, Wingo PA et al. Cancer among American Indians and Alaska Natives in the United States, 1999-2004. Cancer. 2008;113(5 suppl):1142–1152. doi: 10.1002/cncr.23734. [DOI] [PubMed] [Google Scholar]
- 30.Anderson RN, Rosenberg HM. Report of the Second Workshop on Age Adjustment. Vital Health Stat 4. 1998;(30):I–VI. 1–37. [PubMed] [Google Scholar]
- 31.Anderson RN, Rosenberg HM. Age standardization of death rates: implementation of the year 2000 standard. Natl Vital Stat Rep. 1998;47(3):1–16. 20. [PubMed] [Google Scholar]
- 32.Tiwari RC, Clegg LX, Zou Z. Efficient interval estimation for age-adjusted cancer rates. Stat Methods Med Res. 2006;15(6):547–569. doi: 10.1177/0962280206070621. [DOI] [PubMed] [Google Scholar]
- 33.Joinpoint [computer program]. Version 4.0.3. Rockville, MD: National Cancer Institute; 2013. [Google Scholar]
- 34.Kim H-J, Fay MP, Yu B, Barrett MJ, Feuer EJ. Comparability of segmented line regression models. Biometrics. 2004;60(4):1005–1014. doi: 10.1111/j.0006-341X.2004.00256.x. [DOI] [PubMed] [Google Scholar]
- 35.Denny CH, Holtzman D, Goins RT, Croft JB. Disparities in chronic disease risk factors and health status between American Indian/Alaska Native and White elders: findings from a telephone survey, 2001 and 2002. Am J Public Health. 2005;95(5):825–827. doi: 10.2105/AJPH.2004.043489. [DOI] [PMC free article] [PubMed] [Google Scholar]
- 36.Zuckerman S, Haley J, Roubideaux Y, Lillie-Blanton M. Health service access, use, and insurance coverage among American Indians/Alaska Natives and Whites: what role does the Indian Health Service play? Am J Public Health. 2004;94(1):53–59. doi: 10.2105/ajph.94.1.53. [DOI] [PMC free article] [PubMed] [Google Scholar]
- 37.Horner RD, Day GM, Lanier AP, Provost EM, Hamel RD, Trimble BA. Stroke mortality among Alaska Native people. Am J Public Health. 2009;99(11):1996–2000. doi: 10.2105/AJPH.2008.148221. [DOI] [PMC free article] [PubMed] [Google Scholar]
- 38.Jernigan VB, Duran B, Ahn D, Winkleby M. Changing patterns in health behaviors and risk factors related to cardiovascular disease among American Indians and Alaska Natives. Am J Public Health. 2010;100(4):677–683. doi: 10.2105/AJPH.2009.164285. [DOI] [PMC free article] [PubMed] [Google Scholar]
- 39.Wilson C, Gilliland S, Moore K, Acton K. The epidemic of extreme obesity among American Indian and Alaska Native adults with diabetes. Prev Chronic Dis. 2007;4(1):A06. [PMC free article] [PubMed] [Google Scholar]
- 40.Towfighi A, Saver JL. Stroke declines from third to fourth leading cause of death in the United States: historical perspective and challenges ahead. Stroke. 2011;42(8):2351–2355. doi: 10.1161/STROKEAHA.111.621904. [DOI] [PubMed] [Google Scholar]
- 41.Steele CB, Cardinez CJ, Richardson LC, Tom-Orme L, Shaw KM. Surveillance for health behaviors of American Indians and Alaska Natives—findings from the Behavioral Risk Factor Surveillance System, 2000-2006. Cancer. 2008;113(5 suppl):1131–1141. doi: 10.1002/cncr.23727. [DOI] [PubMed] [Google Scholar]
- 42.Rith-Najarian SJ, Gohdes DM, Shields R et al. Regional variation in cardiovascular disease risk factors among American Indians and Alaska Natives with diabetes. Diabetes Care. 2002;25(2):279–283. doi: 10.2337/diacare.25.2.279. [DOI] [PubMed] [Google Scholar]
- 43.Chan L, Hart LG, Goodman DC. Geographic access to health care for rural Medicare beneficiaries. J Rural Health. 2006;22(2):140–146. doi: 10.1111/j.1748-0361.2006.00022.x. [DOI] [PubMed] [Google Scholar]
- 44.Adams HP, Jr, del Zoppo G, Alberts MJ et al. Guidelines for the early management of adults with ischemic stroke: a guideline from the American Heart Association/American Stroke Association Stroke Council, Clinical Cardiology Council, Cardiovascular Radiology and Intervention Council, and the Atherosclerotic Peripheral Vascular Disease and Quality of Care Outcomes in Research Interdisciplinary Working Groups. Circulation. 2007;115(20):e478–e534. doi: 10.1161/CIRCULATIONAHA.107.181486. [DOI] [PubMed] [Google Scholar]
- 45.National Institute of Neurological Disorders and Stroke. Know stroke. Know the signs. Act in time. 2008. Available at: http://www.ninds.nih.gov/health_and_medical/pubs/knowstroke.htm. Accessed March 28, 2013.
- 46.Alaska’s Cardiovascular Health Coalition. Take Heart Alaska. Available at: http://dhss.alaska.gov/sites/takeheart. Accessed March 28, 2013.
- 47.Montana Department of Public Health and Human Services. American Indian Cardiovascular Health Resources. Available at: http://www.dphhs.mt.gov/publichealth/cardiovascular/americanindianresources.shtml. Accessed March 28, 2013.
- 48.Schwamm LH, Audebert HJ, Amarenco P et al. Recommendations for the implementation of telemedicine within stroke systems of care: a policy statement from the American Heart Association. Stroke. 2009;40(7):2635–2660. doi: 10.1161/STROKEAHA.109.192361. [DOI] [PubMed] [Google Scholar]
- 49.The University of Arizona. Arizona Telemedicine Program. Available at: http://www.telemedicine.arizona.edu/app. Accessed March 28, 2013.
- 50.US Department of Health and Human Services Health Resources and Services Administration. Telehealth. Available at: http://www.hrsa.gov/ruralhealth/about/telehealth. Accessed March 29, 2013.
- 51.US Department of Health and Human Services Office of Disease Prevention and Health Promotion. Healthy People 2020. Available at: http://www.healthypeople.gov/2020. Accessed March 26, 2013.
- 52.US Department of Health and Human Services Office of Disease Prevention and Health Promotion. Healthy People 2010. Available at: http://www.healthypeople.gov/2010. Accessed March 26, 2013. [PubMed]
- 53.Espey DK, Wiggins CL, Jim MA, Miller BA, Johnson CJ, Becker TM. Methods for improving cancer surveillance data in American Indian and Alaska Native populations. Cancer. 2008;113(5 suppl):1120–1130. doi: 10.1002/cncr.23724. [DOI] [PubMed] [Google Scholar]