

Abstract
Objectives. We evaluated heart disease death rates among American Indians and Alaska Natives (AI/ANs) and Whites after improving identification of AI/AN populations.
Methods. Indian Health Service (IHS) registration data were linked to the National Death Index for 1990 to 2009 to identify deaths among AI/AN persons aged 35 years and older with heart disease listed as the underlying cause of death (UCOD) or 1 of multiple causes of death (MCOD). We restricted analyses to IHS Contract Health Service Delivery Areas and to non-Hispanic populations.
Results. Heart disease death rates were higher among AI/AN persons than Whites from 1999 to 2009 (1.21 times for UCOD, 1.30 times for MCOD). Disparities were highest in younger age groups and in the Northern Plains, but lowest in the East and Southwest. In AI/AN persons, MCOD rates were 84% higher than UCOD rates. From 1990 to 2009, UCOD rates declined among Whites, but only declined significantly among AI/AN persons after 2003.
Conclusions. Analysis with improved race identification indicated that AI/AN populations experienced higher heart disease death rates than Whites. Better prevention and more effective care of heart disease is needed for AI/AN populations.
Heart disease is the leading cause of death and a major cause of medical expenditures in the United States.1,2 Among American Indians/Alaska Natives (AI/ANs), death rates for heart disease have been consistently equal to or lower than that of the overall US population and non-Hispanic Whites, especially among older age groups (75 years and older) as reported by National Vital Statistics System (NVSS) data.3 However, from 1997 to 2011, the self-reported prevalence of heart disease in the National Health Interview Survey was either higher or similar among AI/AN persons compared with other populations.3 Moreover, the most recent Behavioral Risk Factor Surveillance System data showed that prevalence of coronary heart disease for 2006 to 2010 was much higher among AI/AN populations than other groups.4 In addition, the Strong Heart Study found that the incidence of coronary heart disease events in participating AI/AN communities was 2 times higher than estimates from other large cohort studies using similar case ascertainment methods.5 Available data also indicated that the prevalence of risk factors for heart disease and stroke—including smoking,6,7 physical inactivity,7 and obesity6,7—among AI/AN persons was comparable to or higher than the other high-risk racial groups such as Blacks or African Americans and Native Hawaiians or other Pacific Islanders. A diabetes epidemic among AI/AN individuals in the last couple of decades also coincided with increasing prevalence of heart disease in this group.6,8–10 In 2003, the prevalence of having 2 or more heart disease and stroke risk factors in AI/AN persons was similar to that in Blacks, but was higher than that in Whites, Hispanics, and Asians.11
The overall age-adjusted heart disease death rate in the US population has declined steadily since the late 1950s1; however, available data indicate that the decline may be slower among AI/AN persons compared with both the US general population and Whites.3 However, the incidence of coronary heart disease may be increasing.5 In addition, geographic disparities in mortality among AI/AN individuals12,13 and disparities between AI/AN persons and Whites in risk factors13,14 for heart disease have been observed.
No published studies have compared the risk-adjusted case-fatality rates between AI/AN and White persons as a possible explanation for this paradox of a lower heart disease death rate among AI/AN individuals, but a higher prevalence of heart disease and its risk factors. Racial misclassification in mortality and population data, however, is a likely explanation.15 A recent study indicated that up to 30% of AI/AN persons were misclassified or underreported on death certificates.15,16 Given the high prevalence of diabetes in the AI/AN population, differences in the practice of coding diabetes versus heart disease as the underlying cause of death (UCOD) on the death certificate may also play a role in this paradox.17 An accurate accounting of the disease burden and proper trend analysis is critical in making public health policy decisions and allocating resources. In the present analysis, we addressed this issue by using a dataset that links the Indian Health Service’s (IHS’s) patient registry data and the National Death Index (NDI) database to achieve more accurate racial classification of AI/AN persons. We analyzed both the UCOD and multiple causes of death (MCOD) on death records.
We described disparities in heart disease death rates by age, gender, region, and year of death for AI/AN individuals compared with Whites, and evaluated whether racial misclassification might explain previous observations that heart disease mortality was similar among AI/AN and White persons, although AI/AN populations appeared to have higher prevalence of risk factors for heart disease.
METHODS
Detailed methods for generating the analytical mortality files are described elsewhere in this supplement.18,19
Population Estimates
We included bridged single-race population estimates developed by the US Census Bureau and the Centers for Disease Control and Prevention (CDC) National Center for Health Statistics (NCHS) as denominators. Estimates were adjusted for population shifts because of Hurricanes Katrina and Rita in 2005.20,21 Bridged single-race data made the post-2000 race/ethnicity population estimates comparable to the pre-2000 race/ethnicity estimates and enabled trend analyses.
During preliminary analyses, we discovered that the updated bridged intercensal population estimates significantly overestimated AI/AN populations of Hispanic origin.22 Therefore, to avoid underestimating death rates in AI/AN populations, we limited all analyses to non-Hispanic AI/AN persons. Non-Hispanic White was chosen as the most homogenous referent group. All analyses were limited to non-Hispanic persons. Henceforth, the term “non-Hispanic” was omitted when discussing both groups.
Death Records
Death certificate data were compiled by states and sent to the NCHS, where they were edited for consistency and stripped of personal identifiers. The data were available as part of the NVSS, which includes UCOD and MCOD fields, state and county of residence, age, gender, race, and ethnicity.23 NCHS applies a bridging algorithm to assign a single race to decedents with multiple races recorded on the death certificate.21,24 As described elsewhere,19 decedents were classified as AI/AN if AI/AN was coded on their death certificate or if their record in the NDI was matched by a probabilistic record linkage software to the IHS patient registry database.
We supplemented an analysis of deaths for heart disease designated as an UCOD with an analysis of heart disease deaths captured in 1 or more of the MCOD fields on the death record. For both UCODs and MCODs and their rates, heart disease was identified by a cause coded as I00-I09, I11, I13, or I20-I51 using the International Classification of Diseases, 10th Revision (ICD-10)25 for data from 1999 to 2009. For data from 1990 to 1998, heart disease was identified with codes 390–398, 402, 404, or 410–429 using ICD-9.26
Geographic Coverage
We restricted our analyses to Contract Health Service Delivery Area (CHSDA) counties that contain or are adjacent to federally recognized tribal lands.19 CHSDA residence is used by the IHS to determine eligibility for services not directly available within the IHS. Linkage studies indicate less misclassification of race for AI/AN persons in these counties.16,19 The CHSDA counties have higher proportions of AI/AN individuals than non-CHSDA counties, with 64% of the US AI/AN population residing in these 637 counties. Although less geographically representative, mortality analyses restricted to CHSDA counties allowed more targeted comparisons of rates for AI/AN persons and Whites. Data from 35 states and 6 regions were included for death rates restricted to CHSDA counties.
Similar to other publications focusing on AI/AN populations,27–29 we reported our results by region: Northern Plains, Alaska, Southern Plains, Southwest, Pacific Coast, East, and all combined.19 This approach was preferable to the use of smaller jurisdictions, such as the administrative areas defined by IHS,30 which yielded less stable estimates. Additional details about CHSDA counties and IHS regions, including population coverage, are provided elsewhere (Table 1).19
TABLE 1—
Age-Adjusted Heart Disease Death Rates by Indian Health Service Region and Gender for Indian/Alaska Native and White Adults Aged 35 Years and Older: Contract Health Service Delivery Area Counties, United States, 1999–2009
| Heart Disease UCOD |
Heart Disease MCOD |
|||||||
| Region/Gender | AI/AN Deaths | AI/AN Rate | White Rate | AI/AN:White RR (95% CI) | AI/AN Deaths | AI/AN Rate | White Rate | AI/AN:White RR (95% CI) |
| Total | ||||||||
| Both | 22 798 | 493.7 | 406.9 | 1.21* (1.20, 1.23) | 42 604 | 910.0 | 702.3 | 1.30* (1.28, 1.31) |
| Men | 12 661 | 619.6 | 510.1 | 1.21* (1.19, 1.24) | 22 768 | 1111.2 | 866.0 | 1.28* (1.26, 1.30) |
| Women | 10 137 | 396.5 | 325.4 | 1.22* (1.19, 1.24) | 19 836 | 758.2 | 576.7 | 1.31* (1.30, 1.33) |
| Northern Plains | ||||||||
| Both | 4151 | 610.7 | 387.6 | 1.58* (1.52, 1.63) | 7639 | 1112.2 | 632.9 | 1.76* (1.71, 1.80) |
| Men | 2385 | 778.0 | 494.7 | 1.57* (1.50, 1.65) | 4187 | 1373.7 | 798.4 | 1.72* (1.66, 1.78) |
| Women | 1766 | 481.6 | 304.9 | 1.58* (1.50, 1.66) | 3452 | 916.0 | 509.2 | 1.80* (1.74, 1.86) |
| Alaska | ||||||||
| Both | 1233 | 413.5 | 325.0 | 1.27* (1.19, 1.36) | 2126 | 731.4 | 534.0 | 1.37* (1.30, 1.44) |
| Men | 707 | 519.5 | 406.2 | 1.28* (1.16, 1.41) | 1175 | 928.3 | 653.3 | 1.42* (1.32, 1.53) |
| Women | 526 | 329.5 | 249.1 | 1.32* (1.19, 1.46) | 951 | 591.2 | 426.9 | 1.38* (1.28, 1.49) |
| Southern Plains | ||||||||
| Both | 7239 | 679.6 | 527.7 | 1.29* (1.26, 1.32) | 12 525 | 1161.9 | 841.9 | 1.38* (1.35, 1.41) |
| Men | 3887 | 851.8 | 645.4 | 1.32* (1.27, 1.37) | 6530 | 1426.2 | 1022.8 | 1.39* (1.36, 1.43) |
| Women | 3352 | 548.3 | 433.8 | 1.26* (1.22, 1.31) | 5995 | 965.5 | 703.3 | 1.37* (1.34, 1.41) |
| Southwest | ||||||||
| Both | 4809 | 343.3 | 386.3 | 0.89* (0.86, 0.92) | 9674 | 677.4 | 622.6 | 1.09* (1.07, 1.11) |
| Men | 2716 | 446.7 | 480.3 | 0.93* (0.89, 0.97) | 5279 | 852.0 | 760.7 | 1.12* (1.09, 1.15) |
| Women | 2093 | 266.7 | 305.8 | 0.87* (0.83, 0.91) | 4395 | 548.0 | 506.2 | 1.08* (1.05, 1.12) |
| Pacific Coast | ||||||||
| Both | 4005 | 476.6 | 392.7 | 1.21* (1.17, 1.26) | 8030 | 937.4 | 715.5 | 1.31* (1.28, 1.34) |
| Men | 2253 | 598.5 | 489.9 | 1.22* (1.16, 1.28) | 4283 | 1126.6 | 874.4 | 1.29* (1.24, 1.33) |
| Women | 1752 | 384.0 | 315.1 | 1.22* (1.16, 1.28) | 3747 | 794.4 | 592.0 | 1.34* (1.30, 1.39) |
| East | ||||||||
| Both | 1361 | 402.5 | 416.1 | 0.97* (0.91, 1.02) | 2610 | 759.0 | 735.2 | 1.03 (0.99, 1.08) |
| Men | 713 | 469.6 | 526.7 | 0.89* (0.82, 0.97) | 1314 | 861.3 | 916.0 | 0.94 (0.88, 1.00) |
| Women | 648 | 348.7 | 332.2 | 1.05* (0.97, 1.14) | 1296 | 681.0 | 602.4 | 1.13* (1.07, 1.20) |
Note. AI/AN = American Indian/Alaska Native; CHSDA = Contract Health Service Delivery Area; CI = confidence interval; IHS = Indian Health Service; MCOD = multiple causes of death, including heart diseases; RR = rate ratio; UCOD = underlying cause of death because of heart disease. IHS regions are defined as follows: Alaskaa; Northern Plains (IL, IN,a IA,a MI,a MN,a MT,a NE,a ND,a SD,a WI,a WYa); Southern Plains (OK,a KS,a TXa); Southwest (AZ,a CO,a NV,a NM,a UTa); Pacific Coast (CA,a ID,a OR,a WA,a HI); East (AL,a AR, CT,a DE, FL,a GA, KY, LA,a ME,a MD, MA,a MS,a MO, NH, NJ, NY,a NC,a OH, PA,a RI,a SC,a TN, VT, VA, WV, DC). Percent regional coverage of AI/AN persons in CHSDA counties to AI/AN persons in all counties: Northern Plains = 64.8%; Alaska = 100%; Southern Plains = 76.3%; Southwest = 91.3%; Pacific Coast = 71.3%; East = 18.2%; total US = 64.2%. Analyses are limited to persons of non-Hispanic origin. AI/AN race is reported from death certificates or through linkage with the Indian Health Service patient registration database. Rates are per 100 000 population and age-standardized to the 2000 US standard population (age groups 35–44, 45–54, 55–64, 65–74, 75–84, ≥ 85 years).31 RRs are calculated in SEER*Stat before rounding of rates and may not equal RRs calculated from rates presented in table. The following states and years of data are excluded because Hispanic origin was not collected on the death certificate: LA: 1990; NH: 1990–1992; OK: 1990–1996.
Source. AI/AN Mortality Database (AMD 1990–2009).
Identifies states with at least 1 county designated as CHSDA.
*P < .05.
Statistical Methods
Both UCOD and MCOD rates, expressed per 100 000 population and restricted to persons aged 35 years and older, were directly age-standardized to the 2000 US standard population and 6 age groups (35–44, 45–54, 55–64, 65–74, 75–84, and ≥ 85 years) using SEER*Stat software32 in accordance with a 1998 US Department of Health and Human Services recommendation.31,33
We calculated rate ratios (RRs) by comparing the age-standardized death rates among AI/AN populations with those of Whites stratified first by age, then by gender, and then by region. RRs were calculated by SEER*Stat before rounding. Ninety-five percent confidence intervals (CIs) for age-standardized RRs were calculated based on methods described by Tiwari et al.34
Trend analyses and comparability tests for age-standardized death rates plotted over time by year were conducted using Joinpoint software, developed by the National Cancer Institute.35 All trend analyses were restricted to CHSDA counties, with region-specific analyses further restricted to UCOD only. The number of trend segments was based on a segmented line regression analysis of best fit, with the smallest number of “joinpoints” or points at which the direction of the trend line changed. The expected percent change in the rate over a year (i.e., the annual percent change [APC]) was estimated from joinpoint regression for each of the trend segments. Average annual percent change (AAPC) was calculated for 2001 to 2009 to quantify the average trend over this period. Tests were conducted to assess pairwise differences between AI/AN persons and Whites to determine whether the trend lines were parallel or coincident.36 Tests determined whether (1) 2 joinpoint regression functions were identical (test of coincidence), or (2) 2 regression mean functions were parallel (test of parallelism). Statistical significance was set at a P level of less than .05.
RESULTS
From 1999 to 2009, AI/AN persons experienced significantly higher UCOD heart disease rates than Whites (RR = 1.21) and higher MCOD rates than Whites (RR = 1.30). Among AI/AN individuals, MCOD rates were 84.3% higher than those of UCOD (910.0 vs 493.7) compared with 72.8% higher among Whites (702.3 vs 406.9; Table 1). Among AI/AN persons and Whites, men consistently experienced higher rates of both UCOD and MCOD heart disease deaths than women, but the RRs based on UCOD and MCOD comparing AI/AN persons with Whites did not significantly vary by gender. Data to compare UCOD rates for both races in CHSDA and all counties are available as a supplement to the online version of this article at http://www.ajph.org. All other results described in the following apply to CHSDA areas only.
Both AI/AN women and men in the Southern Plains and the Northern Plains consistently had the highest heart disease death rates (both genders, UCOD and MCOD rates = 679.6 and 1161.9, and 610.7 and 1112.2, respectively), and the Southwest had the lowest rates (both genders, UCOD and MCOD rates = 343.3 and 677.4). Regardless of gender, RRs comparing AI/AN individuals to Whites were highest in the Northern Plains region (UCOD RR for both genders = 1.58; MCOD RR = 1.76). Although Alaska Native men and women had relatively low rates of heart disease compared with all AI/AN persons, their RRs compared with their White counterparts in Alaska were higher (UCOD RR = 1.27; MCOD RR = 1.37). In the Southwest, UCOD rates of heart disease death were modestly lower among AI/AN men and women compared with their White counterparts (RR = 0.89), but MCOD rates were significantly higher (RR = 1.09; Table 1).
Both AI/AN persons and Whites showed the expected steep increase in heart disease death rates with age. UCOD rates were significantly higher for AI/AN individuals compared with Whites in all age groups, except among those aged 85 years and older (Table 2). RRs based on similar MCOD rates were significantly higher for AI/ANs compared with Whites in all age groups. For UCOD and MCOD, the RRs for AI/AN persons compared with Whites were highest in every region in the youngest age group (age 35–44 years) and declined with advancing age, except in Alaska and the East, where RRs were highest in the age 45 to 54 years group. This was more varied for heart disease listed as MCOD. Heart disease death rates were lower in AI/AN persons than Whites in the oldest age group (≥ 85 years) in the Southwest and East (UCOD RR = 0.68 and 0.70, respectively; Table 2).
TABLE 2—
Age-Specific Heart Disease Death Rates by Indian Health Service Region and Gender for American Indian/Alaska Native and White Adults Aged 35 Years and Older: Contract Health Service Delivery Area Counties, United States, 1999–2009
| Heart Disease UCOD |
Heart Disease MCOD |
|||||||
| Region/Age, Years | AI/AN Deaths | AI/AN Rate | White Rate | AI/AN: White RR (95% CI) | AI/AN Deaths | AI/AN Rate | White Rate | AI/AN:White RR (95% CI) |
| Total | ||||||||
| 35–44 | 1160 | 49.2 | 25.9 | 1.90* (1.79, 2.02) | 2411 | 102.3 | 47.1 | 2.17* (2.08, 2.26) |
| 45–54 | 2603 | 126.4 | 79.9 | 1.58* (1.52, 1.65) | 5046 | 245.1 | 136.0 | 1.80* (1.75, 1.85) |
| 55–64 | 4040 | 316.0 | 200.7 | 1.57* (1.53, 1.62) | 7543 | 590.0 | 346.8 | 1.70* (1.66, 1.74) |
| 65–74 | 5005 | 721.4 | 501.9 | 1.44* (1.40, 1.48) | 9675 | 1394.6 | 920.5 | 1.52* (1.48, 1.55) |
| 75–84 | 5504 | 1731.9 | 1434.4 | 1.21* (1.18, 1.24) | 10 301 | 3241.3 | 2575.9 | 1.26* (1.23, 1.28) |
| ≥ 85 | 4486 | 4796.9 | 5030.7 | 0.95 (0.93, 0.98) | 7628 | 8156.7 | 8151.4 | 1.00 (0.98, 1.02) |
| Northern Plains | ||||||||
| 35–44 | 254 | 65.1 | 24.1 | 2.70* (2.37, 3.07) | 491 | 125.8 | 39.0 | 3.22* (2.93, 3.54) |
| 45–54 | 554 | 168.9 | 72.6 | 2.33* (2.13, 2.53) | 1015 | 309.5 | 110.5 | 2.80* (2.62, 2.98) |
| 55–64 | 862 | 444.7 | 184.4 | 2.41* (2.25, 2.58) | 1544 | 796.6 | 291.2 | 2.74* (2.60, 2.88) |
| 65–74 | 975 | 954.5 | 478.2 | 2.00* (1.87, 2.13) | 1900 | 1860.1 | 811.6 | 2.29* (2.19, 2.40) |
| 75–84 | 915 | 2138.1 | 1366.9 | 1.56* (1.46, 1.67) | 1697 | 3965.3 | 2342.7 | 1.69* (1.61, 1.78) |
| ≥ 85 | 591 | 5227.8 | 4861.9 | 1.08 (0.99, 1.17) | 992 | 8774.9 | 7617.8 | 1.15* (1.08, 1.23) |
| Alaska | ||||||||
| 35–44 | 59 | 36.0 | 23.3 | 1.55* (1.13, 2.08) | 102 | 62.3 | 32.7 | 1.90* (1.50, 2.40) |
| 45–54 | 155 | 110.6 | 62.9 | 1.76* (1.46, 2.10) | 250 | 178.4 | 84.6 | 2.11* (1.82, 2.44) |
| 55–64 | 202 | 244.8 | 158.6 | 1.54* (1.32, 1.80) | 306 | 370.9 | 224.7 | 1.65* (1.45, 1.87) |
| 65–74 | 290 | 629.4 | 449.5 | 1.40* (1.22, 1.60) | 498 | 1080.8 | 727.9 | 1.48* (1.34, 1.64) |
| 75–84 | 314 | 1494.0 | 1254.4 | 1.19* (1.05, 1.35) | 565 | 2688.3 | 2183.3 | 1.23* (1.12, 1.35) |
| ≥ 85 | 213 | 3911.1 | 3486.2 | 1.12 (0.96, 1.30) | 405 | 7436.7 | 5844.5 | 1.27* (1.14, 1.42) |
| Southern Plains | ||||||||
| 35–44 | 319 | 67.1 | 38.7 | 1.73* (1.53, 1.96) | 577 | 121.4 | 61.1 | 1.99* (1.81, 2.17) |
| 45–54 | 766 | 177.9 | 122.6 | 1.45* (1.34, 1.56) | 1325 | 307.7 | 181.5 | 1.70* (1.60, 1.80) |
| 55–64 | 1144 | 402.3 | 296.7 | 1.36* (1.27, 1.44) | 2063 | 725.5 | 461.6 | 1.57* (1.50, 1.65) |
| 65–74 | 1470 | 909.7 | 667.8 | 1.36* (1.29, 1.44) | 2660 | 1646.1 | 1123.4 | 1.47* (1.41, 1.52) |
| 75–84 | 1852 | 2317.3 | 1820.5 | 1.27* (1.21, 1.33) | 3227 | 4037.7 | 3037.4 | 1.33* (1.28, 1.38) |
| ≥ 85 | 1688 | 7309.9 | 6143.4 | 1.19* (1.13, 1.25) | 2673 | 11 575.4 | 9361.7 | 1.24* (1.19, 1.29) |
| Southwest | ||||||||
| 35–44 | 272 | 38.0 | 27.1 | 1.40* (1.23, 1.59) | 669 | 93.4 | 48.5 | 1.93* (1.77, 2.09) |
| 45–54 | 478 | 81.9 | 87.0 | 0.94 (0.86, 1.03) | 1128 | 193.3 | 143.0 | 1.35* (1.27, 1.44) |
| 55–64 | 851 | 239.1 | 211.5 | 1.13* (1.05, 1.21) | 1688 | 474.3 | 341.2 | 1.39* (1.32, 1.46) |
| 65–74 | 1055 | 517.3 | 478.0 | 1.08* (1.02, 1.15) | 2124 | 1041.4 | 816.8 | 1.28* (1.22, 1.33) |
| 75–84 | 1165 | 1217.3 | 1330.7 | 0.91* (0.86, 0.97) | 2226 | 2325.9 | 2207.0 | 1.05* (1.01, 1.10) |
| ≥ 85 | 988 | 3136.3 | 4617.0 | 0.68* (0.64, 0.72) | 1839 | 5837.7 | 6987.2 | 0.84* (0.80, 0.88) |
| Pacific Coast | ||||||||
| 35–44 | 203 | 45.9 | 21.9 | 2.09* (1.81, 2.41) | 462 | 104.4 | 45.1 | 2.32* (2.11, 2.54) |
| 45–54 | 474 | 112.6 | 71.2 | 1.58* (1.44, 1.73) | 976 | 231.9 | 132.2 | 1.75* (1.64, 1.87) |
| 55–64 | 725 | 274.4 | 183.1 | 1.50* (1.39, 1.61) | 1446 | 547.3 | 339.3 | 1.61* (1.53, 1.70) |
| 65–74 | 896 | 684.8 | 482.6 | 1.42* (1.33, 1.52) | 1858 | 1420.1 | 944.2 | 1.50* (1.44, 1.57) |
| 75–84 | 938 | 1678.0 | 1404.0 | 1.20* (1.12, 1.27) | 1966 | 3517.0 | 2661.9 | 1.32* (1.26, 1.38) |
| ≥ 85 | 769 | 4935.5 | 4948.0 | 1.00 (0.93, 1.07) | 1322 | 8484.7 | 8332.0 | 1.02 (0.96, 1.07) |
| East | ||||||||
| 35–44 | 53 | 31.3 | 27.7 | 1.13 (0.85, 1.48) | 110 | 65.1 | 50.5 | 1.29* (1.06, 1.55) |
| 45–54 | 176 | 113.3 | 81.9 | 1.38* (1.19, 1.61) | 352 | 226.6 | 143.8 | 1.58* (1.41, 1.75) |
| 55–64 | 256 | 261.9 | 203.1 | 1.29* (1.14, 1.46) | 496 | 507.5 | 366.0 | 1.39* (1.27, 1.51) |
| 65–74 | 319 | 649.0 | 509.2 | 1.27* (1.14, 1.42) | 635 | 1292.0 | 967.7 | 1.34* (1.23, 1.44) |
| 75–84 | 320 | 1424.5 | 1468.7 | 0.97 (0.87, 1.08) | 620 | 2760.0 | 2692.5 | 1.03 (0.95, 1.11) |
| ≥ 85 | 237 | 3595.3 | 5152.2 | 0.70* (0.61, 0.79) | 397 | 6022.5 | 8482.4 | 0.71* (0.64, 0.78) |
Note. AI/AN = American Indian/Alaska Native; CI = confidence interval; CHSDA = Contract Health Service Delivery Area; IHS = Indian Health Service; MCOD = multiple causes of death, including heart diseases; RR = rate ratio; UCOD = underlying cause of death because of heart disease. Analyses are limited to persons of non-Hispanic origin. AI/AN race is reported from death certificates or through linkage with the IHS patient registration database. Rates are per 100 000 population. RRs are calculated in SEER*Stat before rounding of rates and may not equal RRs calculated from rates presented in the table. IHS regions are defined as follows: Alaskaa; Northern Plains (IL, IN,a IA,a MI,a MN,a MT,a NE,a ND,a SD,a WI,a WYa); Southern Plains (OK,a KS,a TXa); Southwest (AZ,a CO,a NV,a NM,a UTa); Pacific Coast (CA,a ID,a OR,a WA,a HI); East (AL,a AR, CT,a DE, FL,a GA, KY, LA,a ME,a MD, MA,a MS,a MO, NH, NJ, NY,a NC,a OH, PA,a RI,a SC,a TN, VT, VA, WV, DC). Percent regional coverage of AI/AN persons in CHSDA counties to AI/AN persons in all counties: Northern Plains = 64.8%; Alaska = 100%; Southern Plains = 76.3%; Southwest = 91.3%; Pacific Coast = 71.3%; East = 18.2%; total US = 64.2%. The following states and years of data are excluded because Hispanic origin was not collected on the death certificate: LA: 1990; NH: 1990–1992; OK: 1990–1996.
Source. AI/AN Mortality Database (AMD 1990–2009).
Identifies states with at least 1 county designated as CHSDA.
*P < .05.
Heart disease as the UCOD decreased significantly for Whites from 1990 to 1998 with an APC of – 2.0 (P < .05), and even more so from 1998 to 2009 (APC = −3.7; P < .05). Although no significant change in heart disease measured by the UCOD rate among AI/AN individuals from 1990 to 2003 was noted (APC = −0.4), there was a significant decrease from 2003 to 2009 (APC = −3.2; P < .05; Figure 1). MCOD rates among Whites declined from 1990 to 2002, whereas AI/AN MCOD rates remained flat. MCOD rates declined among AI/AN persons from 2003 to 2009 (APC −1.4; P < .05), and declined more steeply among Whites from 2002 to 2009 (APC = −2.5; P < .05). The AAPC in UCOD rates for 2001 to 2009 was similar for AI/AN persons and Whites, but the AAPC for MCOD was significantly greater among Whites than AI/AN persons (Figure 1).
FIGURE 1—
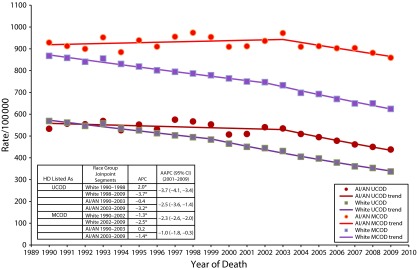
Age-adjusted heart disease death rates and trends among American Indian/Alaska Native and White adults aged 35 years and older: Contract Health Service Delivery Area Counties, United States, 1990–2009.
Note. AAPC = average of annual percent change; AI/AN = American Indian/Alaska Native; APC = annual percent change; CI = confidence interval; IHS = Indian Health Service; MCOD = multiple causes of death, including heart diseases; UCOD = underlying cause of death because of heart disease. Analyses are limited to persons of non-Hispanic origin. AI/AN race is reported from death certificates or through linkage with the IHS patient registration database. Rates are per 100 000 population and age-standardized to the 2000 US standard population (age groups 35–44, 45–54, 55–64, 65–74, 75–84, ≥ 85 years).31 Trends are given as APC between joinpoints and AAPCs weighted by the length in years between their associated joinpoints. The number of trend segments and joinpoints varies and is based on the joinpoint regression analysis of best fit with the smallest number of deaths. Relative percent change calculated as ([2009–1990]1990). The following states and years of data are excluded because Hispanic origin was not collected on the death certificate: LA: 1990; NH: 1990–1992; OK: 1990–1996.
Source. AI/AN Mortality Supplement Database (AMD 1990–2009).
*P < .05.
Trend analyses by region for 1990 to 2009 showed differences by region in the segments and slopes of the trend lines for UCOD rates (Table 3; data available as a supplement to the online version of this article at http://www.ajph.org).
TABLE 3—
Trends in Death Rates of Heart Disease as Underlying Cause of Death by Indian Health Service Region Among American Indian/Alaska Native and White Adults Aged 35 Years and Older: Contract Health Service Delivery Area Counties, United States, 1990–2009
| Rates |
Trend 1 |
Trend 2 |
Trend 3 |
|||||||
| IHS Region/ Race | Modeled 1990 | Modeled 2009 | Years | APC | Years | APC | Years | APC | Average APC for 2001–2009 (95% CI) | RPC |
| Northern Plains | ||||||||||
| AI/AN | 800.6 | 514.4 | 1990–1992 | 8.5 | 1992–2009 | −3.5* | −3.5* (−4.0, −3.0) | −36% | ||
| White | 569.9 | 319.6 | 1990–1998 | −2.0* | 1998–2009 | −3.7* | −3.7* (−4.1, −3.4) | −44% | ||
| Alaska | ||||||||||
| AI/AN | 567.4 | 378.9 | 1990–2009 | −2.1* | −2.1* (−3.0, −1.2) | −33% | ||||
| White | 506.5 | 283.0 | 1990–2009 | −3.0* | −3.0* (−3.5, −2.6) | −44% | ||||
| Southern Plainsa | ||||||||||
| AI/AN | 742.7 | 650.8 | 1997–2009 | −1.1 | −1.1 (−2.4, 0.2) | |||||
| White | 608.6 | 438.4 | 1997–2002 | −1.0 | 2002–2009 | −3.9* | −3.6* (−4.2, −3.0) | . . . | ||
| Pacific Coast | ||||||||||
| AI/AN | 546.0 | 452.7 | 1990–2009 | 1.0* | −1.0* (−1.6, −0.4) | −17% | ||||
| White | 554.1 | 328.1 | 1990–2002 | −2.1* | 2002–2009 | −3.7* | −3.5* (−3.9, −3.1) | −41% | ||
| East | ||||||||||
| AI/AN | 611.1 | 351.2 | 1990–2009 | −2.9* | −2.9* (−3.8, −2.0) | −43% | ||||
| White | 596.8 | 343.2 | 1990–1993 | −0.2 | 1993–1998 | −2.3* | 1998–2009 | −3.8* | −3.8* (−4.0, −3.6) | −36% |
| Southwest | ||||||||||
| AI/AN | 418.2 | 321.7 | 1990–2009 | −1.7* | −1.7* (−2.2, −1.2) | −23% | ||||
| White | 555.0 | 323.7 | 1990–2005 | −2.3* | 2005–2009 | −4.5* | −3.4* (−4.0, −2.8) | −42% | ||
Note. AI/AN = American Indian/Alaska Native; APC = annual percent change; CHSDA = Contract Health Services Delivery Area; CI = confidence interval; IHS = Indian Health Service; RPC = relative percent change. A dash signifies no test performed because no 1990 data were available. Analyses are limited to persons of non-Hispanic origin. AI/AN race is reported from death certificates or through linkage with the IHS patient registration database. Rates are per 100 000 population and age-standardized to the 2000 US standard population (age groups 35–44, 45–54, 55–64, 65–74, 75–84, ≥ 85 years).31 Trends are given as APC between joinpoints and average APCs weighted by the length in years between their associated joinpoints. The number of trend segments and joinpoints varies and is based on the joinpoint regression analysis of best fit with the smallest number of deaths. RPC is calculated as ([2009–1990]1990). IHS regions are defined as follows: Alaskab; Northern Plains (IL, IN,b IA,b MI,b MN,b MT,b NE,b ND,b SD,b WI,b WYb); Southern Plains (OK,b KS,b TXb); Southwest (AZ,b CO,b NV,b NM,b UTb); Pacific Coast (CA,b ID,b OR,b WA,b HI); East (AL,b AR, CT,b DE, FL,b GA, KY, LA,b ME,b MD, MA,b MS,b MO, NH, NJ, NY,b NC,b OH, PA,b RI,b SC,b TN, VT, VA, WV, DC). Percent regional coverage of AI/AN persons in CHSDA counties to AI/AN persons in all counties: Northern Plains = 64.8%; Alaska = 100%; Southern Plains = 76.3%; Southwest = 91.3%; Pacific Coast = 71.3%; East = 18.2%; total US = 64.2%. The following states and years of data are excluded because Hispanic origin was not collected on the death certificate: LA: 1990; NH: 1990–1992; OK: 1990–1996.
Source. AI/AN Mortality Supplement Database (AMD 1990–2009).
Before 1997, the Southern Plains are not included because of small numbers caused by the preceding exclusion criteria, which led to unstable estimates.
Identifies states with at least 1 county designated as CHSDA.
*P < .05.
From 2001 to 2009, AI/AN populations in all regions except those in the Southern Plains experienced significant reductions in heart disease measured by the UCOD rate, with the greatest decrease seen in those in the Northern Plains (AAPC = −3.5) followed by those in the East (AAPC = −2.9), Alaska (AAPC = −2.1), Southwest (AAPC = −1.7), and Pacific Coast (AAPC = −1.0). When comparing the AAPC for 2001 to 2009, no significant differences were found between AI/AN populations and Whites within the 6 regions, except in the Southern Plains, Pacific Coast, and Southwest. From 1990 to 2009, the relative percent change for AI/AN persons showed a decrease for all regions, except the Southern Plains, with the greatest decrease in the East (−43%).
DISCUSSION
In CHSDA counties, the age-adjusted UCOD and MCOD rates for heart disease were greater among AI/AN persons than Whites by 21% and 30%, respectively. From 1999 to 2009, rates among AI/AN persons were higher than Whites in both genders, and especially in younger age groups, the Northern Plains, Southern Plains, and Alaska. Both AI/AN individuals and Whites experienced declining rates over the 19-year period. For AI/AN persons, the rates declined after 2003. In AI/AN populations, MCOD rates were 84% higher than UCOD rates compared with only a 72% difference among Whites. In terms of public health impact, if AI/AN persons had the same age-adjusted rates as Whites, their UCOD rates would drop by 86.8 deaths per year and their MCOD rates would drop by 207.7 deaths per year. After greatly reducing the problem of racial misclassification through linkage, the rates of heart disease mortality among AI/AN persons were higher than the rates in Whites, possibly caused, in part, by the higher prevalence of heart disease risk factors (e.g., diabetes, hypertension, and obesity)3,5–7,37 and to more frequent treatment delays following myocardial infarction in AI/AN persons.38,39
Higher rates than previously documented were also likely the result of improved racial classification on death certificates by linking national mortality files with IHS patient registration numbers.19,40 An analysis of the present data for all counties in the United States revealed that AI/AN populations had lower rates in all counties than in CHSDA counties where linkage to IHS data would correct more racial misclassification on death certificates (data available as a supplement to the online version of this article at http://www.ajph.org). However, Whites had lower rates of heart disease mortality in CHSDA counties than in all counties. A comparison of the age-adjusted heart disease death rates among AI/AN persons in CHSDA counties from 1996 to 1998, where only the death certificate was used to classify race compared with the White41 rates in CHSDA counties, revealed no difference between AI/AN and White population, but did not explain the 21% excess risk among AI/AN individuals (data available as a supplement to the online version of this article at http://www.ajph.org). Thus, racial misclassification on the death certificate documented by Jim et al.40 in this issue likely confirmed previous findings that lower rates of heart disease mortality among AI/AN persons, compared with Whites or all races in the United States, were largely caused by underreporting of AI/AN race on the death certificate.15,41
Differences between AI/AN persons and Whites by age and gender in this analysis were observed previously, even without correcting for racial misclassification.12,41 The rate of heart disease mortality among AI/AN individuals was higher than the White rate for persons younger than 75 years, but lower for persons 85 years old or older. This may be because of a cohort effect, a period effect, or both. The life course of the younger birth cohorts were more strongly affected by the diabetes epidemic than the oldest birth cohorts because diabetes prevalence increased among AI/AN persons over time.42–44
There were considerable variations in the disparity of heart disease deaths between AI/AN persons and Whites by region. There was no agreement between the prevalence of cardiovascular risk factors as measured by the Behavioral Risk Factor Surveillance System and the pattern of heart disease death rates we observed.45 Although heart disease death rates were lower in the Southwest than Oklahoma or the Northern Plains, diabetes prevalence was much higher in the former,12,13 a finding also seen in the Strong Heart Study.9,14 Historically, published heart disease death rates among AI/AN populations in the Northern Plains were the highest in the United States.12 Smoking might contribute to explaining this; current smoking rates were higher among AI/AN persons in the Northern Plains.13,14 Our finding that the Southern Plains had the highest rates of heart disease mortality was new; previous studies restricted to CHSDA counties and relying on death certification for racial classification had not shown that the Southern Plains (Oklahoma City Area of the IHS) had rates as high as the Northern Plains.12 This was likely the result of the Southern Plains having the highest underreporting of AI/AN race on the death certificate in the past, resulting in the largest increase in rates when linkage to IHS enrollment was used to better classify race, a 44% increase, as confirmed by Jim et al. in this supplement.40
This was the first published study to show that Alaska Natives had higher death rates because of heart disease compared with Whites. Although previous studies showed Alaska Natives with lower rates of heart disease mortality than all races in the United States12 or US Whites,46 this study compared AI/AN persons with the very low-risk population of Whites living in Alaska. This underscored the importance of stratifying comparisons between racial and ethnic groups by geographic region. Other potential explanations for regional variation in AI/AN death rates also need further investigation: the role of age when diabetes was diagnosed on the probability of dying from competing causes such as kidney disease instead of heart disease; awareness of the signs and symptoms of heart attack; time to treatment of myocardial infarction; and quality of care in treating and managing heart disease.
A number of possible explanations for the drop in heart disease death rates after 2003 among AI/AN persons are as follows: the congressionally funded Special Diabetes Program for Indians began implementation of its 66 community demonstration projects targeted at preventing heart disease and controlling diabetes in 20048; among the 338 previously established Community-Directed Diabetes Programs funded by Special Diabetes Program for Indians, the adoption of interventions aimed at physical activity, weight control, nutrition, and diabetes management accelerated and became widespread between 1997 and 20108; drug-eluting stents began widespread use in 200445 and might have had a greater impact on AI/AN persons than Whites; the electronic health record with its cardiovascular clinical reminders related to lipids, aspirin, and blood pressure, especially among diabetes patients, began to be implemented in the AI/AN health care system in 200547; and IHS performance improvement measures under the Government Performance and Results Act, including process of care measures for diabetes patients, became more prominent in the system beginning in 2002.48 This drop in rates occurred during a time frame when there was no evidence of a decrease in the prevalence of diabetes among IHS patients.8 Additional time series analyses on potential causes of heart disease mortality could improve understanding of the decline in AI/AN heart disease mortality identified in this study.
As shown previously,12 the disparities between AI/AN and White persons were greater for MCOD rates than for UCOD rates. The use of MCOD rates compared with UCOD rates added proportionately more deaths to the numerator among AI/AN individuals than among Whites. One possible explanation was that diabetes might be more likely to replace coronary heart disease as the UCOD on the death certificate among AI/AN decedents dying of coronary heart disease than among White decedents. Differences in the probability of classifying diabetes as the UCOD on the death certificate (often displacing coronary heart disease to another position on the death certificate) by race or over time could lead to biased conclusions and underscore the need to track both UCOD and MCOD.17
Strengths and Limitations
Strengths of our study included the use of the linkage dataset to improve the ascertainment of race, the restriction of analysis only to areas served by IHS to preserve the validity of this linkage, and the use of both UCOD and MCOD. There were several limitations to consider when interpreting the results presented in this article. First, linkage with the IHS patient registration database did not completely resolve racial misclassification because it would not have been able to improve the racial classification of AI/AN persons who were not eligible for IHS Services. Second, some decedents might have been eligible for, but never used, IHS services, and therefore, were never included in the IHS registration database. Third, the findings from CHSDA counties highlighted in this supplement did not represent all US AI/AN populations in individual IHS regions.19 In particular, the East region data included only 18.2% of the total AI/AN population for that region. Furthermore, the analyses based on CHSDA designation excluded many AI/AN decedents in urban areas who were not part of a CHSDA county. Urban AI/AN persons differed from all AI/AN persons in poverty level, health care access, and other factors that might influence mortality patterns.49,50 Fourth, these analyses revealed less variation for Whites than for AI/AN populations by IHS regions using data from CHSDA counties only. Perhaps alternative groupings of states or counties would reveal a different picture. Fifth, trends in specific causes of heart disease, such as coronary heart disease and heart failure, were not addressed. Sixth, although the exclusion of Hispanic AI/AN individuals from the analyses reduced the overall AI/AN deaths by less than 5%, it might disproportionately affect some states. Finally, there was substantial variation between federally recognized tribes in the proportion of native ancestry required for tribal membership, and therefore, for eligibility for IHS services. Whether and how this discrepancy in tribal membership requirements could influence some of our findings was unclear.
Conclusions
Linking IHS patient registration information to mortality data allowed for more accurate documentation of the burden of heart disease mortality among AI/AN populations. Within CHSDA counties, heart disease death rates were higher for AI/AN persons compared with Whites, especially among the younger age groups, and in the Northern Plains, Southern Plains, and Alaska. The use of causes of death listed anywhere on the death record, along with UCOD, revealed an even greater disparity between AI/AN persons and Whites, possibly as a result of higher rates of diabetes-related deaths, and shed new light on AI/AN versus White disparities in some IHS regions. Future monitoring of disparities in heart disease mortality should consider adjusting for racial misclassification on the death certificate and supplementing UCOD with MCOD rates. Given the excess death rates from heart disease, improvements in prevention and effective care of heart disease are critical for AI/AN populations.
Acknowledgments
J. H.’s contribution was supported by the National Institutes of Health (grants 1S06GM092240 [NIH/NIGMS/IHS] and 1P50CA148110 [NIH/NCI]).
Note. The findings and conclusions in this article are those of the authors and do not necessarily represent the official position of the Centers for Disease Control and Prevention or the Indian Health Service.
Human Participant Protection
The CDC and IHS determined this project to constitute public health practice and not research; therefore, no formal institutional review board approvals were required.
References
- 1.Xu K, Kochanek KD, Murphy SL, Tejada-Vera B. Deaths: Final Data for 2007. National Vital Statistics Reports. Vol 58. Hyattsville, MD: National Center for Health Statistics; 2010. [PubMed] [Google Scholar]
- 2.Roehrig C, Miller G, Lake C, Bryant J. National health spending by medical condition, 1996–2005. Health Aff (Millwood) 2009;28(2):w358–w367. doi: 10.1377/hlthaff.28.2.w358. [DOI] [PubMed] [Google Scholar]
- 3.National Center for Health Statistics. Health, United States, 2012: With Special Feature on Emergency Care. Hyattsville, MD: National Center for Health Statistics; 2013. [PubMed] [Google Scholar]
- 4.US Centers for Disease Control and Prevention. Prevalence of coronary heart disease–United States, 2006–2010. MMWR Morb Mortal Wkly Rep. 2011;60(40):1377–1381. [PubMed] [Google Scholar]
- 5.Howard BV, Lee ET, Cowan LD et al. Rising tide of cardiovascular disease in American Indians. The Strong Heart Study. Circulation. 1999;99(18):2389–2395. doi: 10.1161/01.cir.99.18.2389. [DOI] [PubMed] [Google Scholar]
- 6.Roger VL, Go AS, Lloyd-Jones DM et al. Heart disease and stroke statistics–2012 update: a report from the American Heart Association. Circulation. 2012;125(1):e2–e220. doi: 10.1161/CIR.0b013e31823ac046. [DOI] [PMC free article] [PubMed] [Google Scholar]
- 7.Schiller JS, Lucas JW, Ward BW, Peregoy JA. Summary health statistics for US adults: National Health Interview Survey, 2010. Vital Health Stat 10. 2012;(252):1–207. [PubMed] [Google Scholar]
- 8.Indian Health Service. Special Diabetes Program for Indians. 2011 Report to Congress: Making Progress Toward a Healthier Future. Bethesda, MD: Indian Health Service; 2011. [Google Scholar]
- 9.Howard BV, Lee ET, Fabsitz RR et al. Diabetes and coronary heart disease in American Indians: the Strong Heart Study. Diabetes. 1996;45(suppl 3):S6–S13. doi: 10.2337/diab.45.3.s6. [DOI] [PubMed] [Google Scholar]
- 10.Hoehner CM, Williams DE, Sievers ML, Knowler WC, Bennett PH, Nelson RG. Trends in heart disease death rates in diabetic and nondiabetic Pima Indians. J Diabetes Complications. 2006;20(1):8–13. doi: 10.1016/j.jdiacomp.2005.06.003. [DOI] [PubMed] [Google Scholar]
- 11.Centers for Disease Control and Prevention. Racial/ethnic and socioeconomic disparities in multiple risk factors for heart disease and stroke–United States, 2003. MMWR Morb Mortal Wkly Rep. 2005;54(5):113–117. [PubMed] [Google Scholar]
- 12.Indian Health Service, US Department of Health and Human Services. Regional Differences in Indian Health, 2002–2003 Edition. Washington, DC: Government Printing Office; 2008. [Google Scholar]
- 13.Casper M, Denny CH, Coolidge JN . Atlas of Heart Disease and Stroke Among American Indians and Alaska Natives. Atlanta, GA: US Department of Health and Human Services, Centers of Disease Control and Prevention and Indian Health Services; 2005. [Google Scholar]
- 14.Welty TK, Lee ET, Yeh J et al. Cardiovascular disease risk factors among American Indians. The Strong Heart Study. Am J Epidemiol. 1995;142(3):269–287. doi: 10.1093/oxfordjournals.aje.a117633. [DOI] [PubMed] [Google Scholar]
- 15.Rhoades DA. Racial misclassification and disparities in cardiovascular disease among American Indians and Alaska Natives. Circulation. 2005;111(10):1250–1256. doi: 10.1161/01.CIR.0000157735.25005.3F. [DOI] [PubMed] [Google Scholar]
- 16.Arias E, Schauman WS, Eschbach K, Sorlie PD, Backlund E. The validity of race and Hispanic origin reporting on death certificates in the United States. Vital Health Stat 2. 2008;(148):1–23. [PubMed] [Google Scholar]
- 17.McEwen LN, Karter AJ, Curb JD, Marrero DG, Crosson JC, Herman WH. Temporal trends in recording of diabetes on death certificates: results from Translating Research Into Action for Diabetes (TRIAD) Diabetes Care. 2011;34(7):1529–1533. doi: 10.2337/dc10-2312. [DOI] [PMC free article] [PubMed] [Google Scholar]
- 18.Espey DK, Jim MA, Cobb N et al. Leading causes of death and all-cause mortality in American Indians and Alaska Natives. Am J Public Health. 2014;104(6 suppl 3):S303–S311. doi: 10.2105/AJPH.2013.301798. [DOI] [PMC free article] [PubMed] [Google Scholar]
- 19.Espey DK, Jim MA, Richards T, Begay C, Haverkamp D, Roberts D. Methods for improving the quality and completeness of mortality data for American Indians and Alaska Natives. Am J Public Health. 2014;104(6 suppl 3):S286–S294. doi: 10.2105/AJPH.2013.301716. [DOI] [PMC free article] [PubMed] [Google Scholar]
- 20.National Cancer Institute - Surveillance. Adjusted populations for the counties/parishes affected by Hurricanes Katrina and Rita. Available at: http://seer.cancer.gov/popdata/hurricane_adj.html. Accessed March 18, 2013.
- 21.National Center for Health Statistics. US census populations with bridged race categories. Available at: http://www.cdc.gov/nchs/nvss/bridged_race.htm. Accessed March 13, 2013.
- 22.Edwards BK, Noone AM, Mariotto AB et al. Annual report to the nation on the status of cancer, 1975–2010, featuring prevalence of comorbidity and impact on survival among persons with lung, colorectal, breast, or prostate cancer. Cancer. 2013 doi: 10.1002/cncr.28509. Epub ahead of print. [DOI] [PMC free article] [PubMed] [Google Scholar]
- 23.National Center for Health Statistics. Division of Vital Statistics. National Vital Statistics System. Available at: http://www.cdc.gov/nchs/nvss.htm. Accessed May 2, 2012.
- 24.Weed J. NCHS Procedures for Multiple-Race and Hispanic Origin Data: Collection, Coding, Editing, and Transmitting. Portland, OR: Joint Meeting of the National Association for Public Health Statistics and Information Systems and the Vital Statistics Cooperative Program; 2004. [Google Scholar]
- 25.International Classification of Diseases, 10th Revision. Geneva, Switzerland: World Health Organization; 1992. [Google Scholar]
- 26.International Classification of Diseases, Ninth Revision. Switzerland. Geneva,: World Health Organization; 1980. [Google Scholar]
- 27.Denny CH, Taylor TL. American Indian and Alaska Native health behavior: findings from the Behavioral Risk Factor Surveillance System, 1992–1995. Ethn Dis. 1999;9(3):403–409. [PubMed] [Google Scholar]
- 28.Espey D, Paisano R, Cobb N. Regional patterns and trends in cancer mortality among American Indians and Alaska Natives, 1990–2001. Cancer. 2005;103(5):1045–1053. doi: 10.1002/cncr.20876. [DOI] [PubMed] [Google Scholar]
- 29.Wiggins CL, Espey DK, Wingo PA et al. Cancer among American Indians and Alaska Natives in the United States, 1999–2004. Cancer. 2008;113(5 suppl):1142–1152. doi: 10.1002/cncr.23734. [DOI] [PubMed] [Google Scholar]
- 30.Indian Health Service. Indian Health Service locations. Available at: http://www.ihs.gov/locations. Accessed November 25, 2013.
- 31.Anderson RN, Rosenberg HM. Age standardization of death rates: implementation of the year 2000 standard. Natl Vital Stat Rep. 1998;47(3):1–16, 20. [PubMed] [Google Scholar]
- 32. National Cancer Institute. SEER*Stat software version 8.0.2. Bethesda, MD: National Cancer Institute, 2013. Available at: http://www.seer.cancer.gov/seerstat. Accessed June 5, 2013.
- 33.Anderson RN, Rosenberg HM. Report of the second workshop on age adjustment. Vital Health Stat 4. 1998;(30):1–37. [PubMed] [Google Scholar]
- 34.Tiwari RC, Clegg LX, Zou Z. Efficient interval estimation for age-adjusted cancer rates. Stat Methods Med Res. 2006;15(6):547–569. doi: 10.1177/0962280206070621. [DOI] [PubMed] [Google Scholar]
- 35.Statistical Methodology and Applications Branch. Surveillance Research Program. National Cancer Institute. Joinpoint Regression Program, Version 4.0. Washington, DC: Statistical Methodology and Applications Branch, Surveillance Research Program, National Cancer Institute; 2012. [Google Scholar]
- 36.Kim H-J, Fay MP, Yu B, Barrett MJ, Feuer EJ. Comparability of segmented line regression models. Biometrics. 2004;60(4):1005–1014. doi: 10.1111/j.0006-341X.2004.00256.x. [DOI] [PubMed] [Google Scholar]
- 37.Frieden TR. Centers for Disease Control and Prevention (CDC). CDC health disparities and inequalities report - United States, 2011. MMWR Surveill Summ. 2011;60(suppl):1–2. [PubMed] [Google Scholar]
- 38.Brody EA, Duarte AC, June-Tsosie A et al. No improvement in time to treatment of acute myocardial infarction in rural Native American patients: temporal trends 1999-2006. J Am Coll Cardiol. 2008;51(10 suppl 1):A193. [Google Scholar]
- 39.Brody EA, Duarte AC, June-Tsosie A et al. Dramatic time-to-treatment delay in rural Native Americans with acute myocardial infarction. J Am Coll Cardiol. 2008;51(10 suppl 1):A193. [Google Scholar]
- 40.Jim MA, Arias E, Seneca DS et al. Racial misclassification of American Indians and Alaska Natives by Indian Health Service Contract Health Service Delivery Area. Am J Public Health. 2014;104(6 suppl 3):295–302. doi: 10.2105/AJPH.2014.301933. [DOI] [PMC free article] [PubMed] [Google Scholar]
- 41.Indian Health Service, US Department of Health and Human Services. Trends in Indian Health, 2001-2002 Edition. Washington, DC: Government Printing Office; 2004. [Google Scholar]
- 42.Burrows NR, Geiss LS, Engelgau MM, Acton KJ. Prevalence of diabetes among Native Americans and Alaska Natives, 1990–1997: an increasing burden. Diabetes Care. 2000;23(12):1786–1790. doi: 10.2337/diacare.23.12.1786. [DOI] [PubMed] [Google Scholar]
- 43.Gohdes DM. Diabetes in American Indians: a growing problem. Diabetes Care. 1986;9(6):609–613. doi: 10.2337/diacare.9.6.609. [DOI] [PubMed] [Google Scholar]
- 44.Gohdes DM. Diabetes in North American Indians and Alaska Natives. In: Harris MC, Stern MP, Boyko EJ, editors. Diabetes in America. 2nd ed. Bethesda, MD: US Department of Health and Human Services, Public Health Service, National Institutes of Health; 1995. pp. 683–695. [Google Scholar]
- 45.Serruys PW, Kutryk MJB, Ong ATL. Coronary-artery stents. N Engl J Med. 2006;354(5):483–495. doi: 10.1056/NEJMra051091. [DOI] [PubMed] [Google Scholar]
- 46.Johnston JM, Day GE, Veazie MA, Provost E. Heart disease mortality among Alaska Native people, 1981–2007. Public Health Rep. 2011;126(1):73–83. doi: 10.1177/003335491112600111. [DOI] [PMC free article] [PubMed] [Google Scholar]
- 47.Sequist TD, Cullen T, Hays H, Taualii MM, Simon SR, Bates DW. Implementation and use of an electronic health record within the Indian Health Service. J Am Med Inform Assoc. 2007;14(2):191–197. doi: 10.1197/jamia.M2234. [DOI] [PMC free article] [PubMed] [Google Scholar]
- 48.Sequist TD, Cullen T, Ayanian JZ. Information technology as a tool to improve the quality of American Indian health care. Am J Public Health. 2005;95(12):2173–2179. doi: 10.2105/AJPH.2004.052985. [DOI] [PMC free article] [PubMed] [Google Scholar]
- 49.Urban Indian Health Commission. Invisible Tribes: Urban Indians and Their Health in a Changing World. Seattle, WA: Urban Indian Health Institute; 2007. [Google Scholar]
- 50.Urban Indian Health Institute. Reported Health and Health-Influencing Behaviors Among Urban American Indians and Alaska Natives: An Analysis of Data Collected by the Behavioral Risk Factor Surveillance System. Seattle, WA: Urban Indian Health Institute; 2008. [Google Scholar]