

Significance
Microscopic analysis of cellular architectures within a diseased tissue often provides an independent assay relative to measurements of molecular biomarkers from that same tissue. Both methods may point to the same disease state, but the relationship between the two is often not clear. We explore a connection by investigating how growth factor-driven protein signaling depends upon the distance separating pairs of cancer cells. A thermodynamic-derived theory identifies the intercellular separation that corresponds to the steady state of the signaling. That length scale is found to be the dominant cell separation distance in bulk tissue culture. The approach is tested in one cell line and validated in another, and may provide insight into the diffusive nature of certain brain cancer phenotypes.
Keywords: GBM, surprisal analysis, cancer cell–cell signaling, biological steady state, two-body cell–cell interaction
Abstract
To understand how pairwise cellular interactions influence cellular architectures, we measured the levels of functional proteins associated with EGF receptor (EGFR) signaling in pairs of U87EGFR variant III oncogene receptor cells (U87EGFRvIII) at varying cell separations. Using a thermodynamics-derived approach we analyzed the cell-separation dependence of the signaling stability, and identified that the stable steady state of EGFR signaling exists when two U87EGFRvIII cells are separated by 80–100 μm. This distance range was verified as the characteristic intercellular separation within bulk cell cultures. EGFR protein network signaling coordination for the U87EGFRvIII system was lowest at the stable state and most similar to isolated cell signaling. Measurements of cultures of less tumorigenic U87PTEN cells were then used to correctly predict that stable EGFR signaling occurs for those cells at smaller cell–cell separations. The intimate relationship between functional protein levels and cellular architectures explains the scattered nature of U87EGFRvIII cells relative to U87PTEN cells in glioblastoma multiforme tumors.
Pathological analysis of tumor tissues is typically led by the analyses of cellular architectures within those tumors. Relationships between those architectures and molecular biomarkers of disease are often poorly understood. We seek to establish such a relationship, starting from physical principles. We take as an example glioblastoma multiforme (GBM) cancer cells that express the EGF receptor (EGFR) variant III oncogene receptor (EGFRvIII). Although these cells enhance tumorigenicity, invasion, and other hallmarks of cancer (1, 2), they comprise only a subpopulation of the cancer cells within an EGFRvIII+ tumor, and their distribution is diffuse (1, 3, 4). To help understand this diffuse cellular architecture, we developed an experimental–theoretical methodology based on analysis of EGFR signaling in two interacting cells. In many physical systems—from planets to atomic solids—the interactions of an element of that system with its surroundings can be understood within the context of two-body interactions. This broad observation inspired our experimental approach, which was to measure EGFR-associated signaling activity in statistically significant numbers of two EGFRvIII+ GBM cells, as a function of intercellular separation. Our theoretical approach was similarly inspired: it assumed that the resultant two-cell data sets could be interpreted using thermodynamic-like considerations.
Our approach allows a determination of the stability of a phosphoprotein signaling network in two interacting cells, and demonstrates how that stability dictates the cell–cell distance distribution in a bulk culture. Using this concept we determined the most probable intercellular separation distance range within cell populations, and the deviations thereof. The available literature suggests our conclusions can be extended to bulk tumors (1).
EGFR signaling plays an important role in motility and promoting tumor growth within EGFRvIII+ GBM tumors (2, 5–8). We thus hypothesized that a detailed examination of the EGFR signaling pathway, within two GBM cells at different separations, would allow a determination of a distance range that exhibited the most stable EGFR signaling. This approach assumes that cell–cell separations with the most stable EGFR signaling will appear with a higher frequency within a bulk population.
Our experimental/theoretical analysis combines measurements of functional proteins, such as phosphorylated kinases, within the EGFR signaling pathway in isolated pairs of GBM cells, at varying cell separations, with surprisal analysis (9–11). Here we use surprisal analysis to determine the most balanced state of the two cells at different distance ranges. We thereby identified a steady-state separation distance between two U87EGFRvIII cells of 80–100 μm. The steady-state separation of two cells was found to correspond to the most probable distance range determined through microscopy measurements of the radial distribution function (RDF) of those same cells in bulk culture. The RDF represents the measured distributions of cell locations with respect to each other. We then turned this approach around, and used measurements of the RDF from a bulk culture of the less tumorigenic U87PTEN cells [model GBM cells expressing wild-type EGFR and the tumor suppressor phosphatase and tensin homolog (PTEN)] to identify the most probable cell–cell separation distance. Thereby we predict that the most stable cell–cell pairwise signaling in U87PTEN cells occurs at smaller cell–cell separations. Those predictions were then shown to be consistent with two-cell, functional proteomics assays.
Our results may help explain the scattered distribution of EGFRvIII cells and less infiltrative nature of U87PTEN cells; furthermore, they point to an intimate relationship between cellular signaling activity, distance dependent cell–cell interactions, and cell culture architectures. The methodology demonstrated here shows how a thermodynamic-like approach, coupled with quantitative functional protein measurements, can provide information about the stability of a cellular system. This approach should be broadly applicable.
Results
Experimental Measurements.
As an input for surprisal analysis, we used data obtained from the recently reported version (12) of the single-cell barcode chip (SCBC) platform (13) (Fig. 1A). This particular SCBC is comprised of ∼8,700 0.2-nL-volume microchambers molded into a polydimethylsiloxane (PDMS) elastomer slab. That slab is bonded to a glass slide that has been patterned so that each microchamber is equipped with a full copy of a six-element antibody array. Cells are loaded onto the chip and isolated within the microchambers for an incubation period of 6 h. During that time, the cells adhere to the collagen-coated PDMS surface, and may secrete proteins, two of which (VEGF and IL-6) are captured on designated spots on the antibody array. After incubation, lysate solution containing phosphatase and protease inhibitors is diffused into each microchamber (Fig. 1C), spilling the cell contents and permitting additional phospho (p) proteins (pAkt, pS6k, pERK, and pEGFR) associated with EGFR signaling to be captured onto designated spots within the antibody array. The microchambers are then flushed, the molded PDMS layer is peeled from the barcoded glass slide, and the protein assays are developed using fluorophore-labeled detection antibodies (Table S1 contains all biomolecular reagents used). The fluorescence from the developed antibody array is digitized using custom algorithms coupled with a GenePix array scanner. That digitized data may be converted into quantitative (protein copy number) assays using calibration curves measured on a similar SCBC platform. The final data are loaded into a table. Each row of the table correlates to a single microchamber address. The row entries contain the numbers and locations of the cells at that address, and the levels of each of the six assayed proteins. Such assays are accurate to ∼10% measurement error (13). A data set contains ∼1,000 zero-cell assays (used for background measurements), ∼2,000 one-cell assays, and >500 two-cell assays (Fig. 1B). The two-cell assays are binned according to ranges of cell–cell separation.
Fig. 1.

Measurement of pairwise interactions using the SCBC platform. (A) The SCBC is comprised of clamped elastomer and glass layers. (B) A fluorescence image of two cells within an SCBC microchamber permits a measurement of the center-to-center separation (r) of the cells. A drawn outline of the antibody array is shown. (Lower) These three images (from a GenePix array scanner) show the developed antibody arrays from microchambers that contained zero, one, and two cells. The central (green) array spot is an alignment marker; the red spots are the protein assays. (C) SCBC operation steps. Cells are incubated on the collagen-coated microchamber surface for 6 h, during which time secreted proteins are captured by the specific antibodies on the barcode antibody array. Lysis buffer is introduced by varying the clamp pressure to allow communication between the microchamber and a surrounding fluid reservoir. The SCBC is dissembled, and the barcoded glass slide is developed using a mixture of fluorophore-labeled secondary antibodies.
Fig. 2A shows the copy numbers of pEGFR vs. U87EGFRvIII cell separation (smoothed proteomic data, red curve). The data were binned into six intercellular distance ranges (Fig. 2A, blue dots) with at least 45 (45 ≤ n ≤ 155) cell pairs for each range. Mean values of copy number distributions for each protein i (Fig. 2A, blue dots) were calculated for each range. Corresponding data for the other five assayed proteins is provided (Fig. S1). Increasing the numbers of distance bins did not alter the overall conclusions described below.
Fig. 2.

Effect of cell–cell separation on the stability of EGFR signaling. (A) SCBC data showing the measured level of pEGFR as a function of cell separation distance from 500 pairs (×2) of U87EGFRvIII cells. The data were binned into six different ranges (blue dots). The smooth red curve was been generated in KaleidaGraph software by applying a Stineman function to the SCBC data. Blue dots represent mean values of protein copy numbers at every distance range calculated from protein distributions. Values are mean ± SEM. (B) Surprisal analysis yields the extent of participation of each assayed protein in the biological processes described by constraints 0 (the steady state), 1, and 2. (C) The distance dependent amplitudes of the constraints  and
and  , represented by
  , reflect the extent of the deviation of the measured EGFR network from the steady state as a function of distance (in micrometers). The error bars for
  were calculated by propagating errors associated with the mean values of measured proteins as a function of distance (SI Text, Determination of the Errors for the Calculated Parameters Obtained from Surprisal Analysis).
With 6 h of on-chip incubation before cell lysis, the signaling activity exhibited a clear dependence on cell separation distance (Fig. 2A and Fig. S1). By comparison, with only 30 min of on-chip incubation, no such dependence was observed (12). Using data recorded from isolated single cells for comparison, the two-cell data exhibits clear repression of EGFR signaling at small cell separations (<80 μm), and elevated EGFR signaling at larger separations (>100 μm) (12). Elevated levels of phosphoproteins downstream of EGFR have been associated with enhanced tumorigenicity and motility (2, 5–8). Thus, the data implies a relationship between tumorigenic activity and cell separation.
Predicting Spatial Distributions of GBM Cells from the Measured Signaling Network.
We consider EGFR signaling as subject to thermodynamic-like considerations, which means that the most stable state of that signaling network is a free-energy minimum. During the 6-h on-chip incubation, cells were not observed to move from their initial positions (12). We used surprisal analysis (9–11, 14, 15) of the two-cell data to help identify when the influence of the fixed cell separation distance, as well as any other constraint, is minimized (for more details on surprisal analysis see SI Text). The idea is to identify an intercellular separation distance range that yields the most stable state.
Surprisal analysis was first applied to characterize the dynamics of nonequilibrium systems in chemical physics (10). The analysis is based on the assumption that the entropy of a system is at its possible maximum. We need to distinguish between a maximum under the constraints and a (higher) maximum when the constraints are removed. For experiments at room temperature (typical in biology), an entropy maximum is equivalent to a free-energy minimum, and the state of lowest free energy is the steady state. We search for a minimum of the free energy in the presence of constraints. Surprisal analysis, as presented in Eq. 1, identifies both the steady state and the biologically constrained state where the protein expression levels deviate from the steady state. The analysis is done for each of the six experimentally accessed distance ranges:
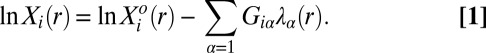 |
Here,  is the mean copy number of protein i at an intercellular distance range r.
  is the mean level of protein i at the steady state in the same distance bin. The quantitative determination of
  is our central purpose here. The terms,
  , describe the deviation of protein levels from the steady state due to the constraints labeled by
  (
( ). A biological perturbation that prevents the cells from reaching the steady state can be considered as a constraint, and will decrease the entropy. The weights
  describe the extent a given protein i participates in a constraint
  .
.  is the weight of the constraint
  at a specific cellular separation distance range r (11, 16). The steady state is biologically realized as the actual state for those cell–cell separation distance ranges at which the constraints do not contribute (i.e.,
  for all measured proteins, Fig. S2A). Over those ranges, only the steady-state term,
  , contributes to Eq. 1.
To use Eq. 1 to identify the steady state, we use the method of singular value decomposition (SVD) (11, 14). For that calculation, the input matrix includes mean values of functional protein distributions (Table S2, rows) at a certain distance range (Table S2, columns). This SVD decomposition leads to as many constraints as the smaller dimension of the input data matrix.
We seek to identify which constraints are important, the physical meaning of those important constraints, and the influence of those constraints on the levels of the assayed proteins. Other than the steady-state term ( ), only two constraints,
  (Table S3), are resolved. Thus, the steady-state level and two constraints quantitatively account for the observed mean protein expression levels at any of the measured intracellular separation distance ranges.
The proteins assayed by the SCBC are, to varying degrees, associated with growth factor signaling, and so can be viewed as upstream or downstream effectors of one another. This signaling network, with its associated protein–protein inhibitory and activating interactions, determines the protein levels  that describe the steady state. Indeed, the steady-state levels yield the largest contribution to the observed expression level of each protein at each distance range (SI Text, Output of the Surprisal Analysis).
The variation of the steady state with intercellular separation is given by the variation of  over the distance variable r. This variation is mild across the full 20- to 150-μm range (Table S3). Our analysis shows relatively restrained deviations of the observed levels of proteins from the steady-state values and thereby implies the robustness of the EGFR protein signaling network. Therefore, the constraints should be considered as a perturbation of the steady state.
The  constraint exhibits a strong dependence on intercellular separation, with highly variable contributions from the assayed proteins [
 vector (Fig. 2B) and
  products (Fig. S2B)]. Markers of highly invasive GBM tumors, IL-6 and pEGFR (2, 5, 17), have large, negative-valued contributions to
  , whereas pS6k has a large, positive-valued contribution and pERK does not contribute significantly (Fig. 2B and Fig. S2B). The
  plot (Fig. 2C) follows closely the variation in functional protein levels with intercellular separation (Fig. 2A). Thus, we associate this constraint with the perturbing influence of intercellular separation on EGFR signaling.
The only other constraint of measureable amplitude is  (Table S3), which has significant contributions from almost all proteins (Fig. 2B). This constraint might, for example, represent a higher-order response of the protein-signaling networks to varying intercellular separation. Those networks are not expected to be comprised of simple, linear protein–protein relationships.
Note from the plot of the Fig. 2C and Fig. S2B that the amplitude of  and
and  go to zero near 80–100 μm intercellular separation. Within this distance range, only the steady-state term contributes, and so this distance range is that of the steady state.
The deviation in free energy per protein molecule due to the biological constraints is captured by the function DPE(r) (SI Text, DPE Function):
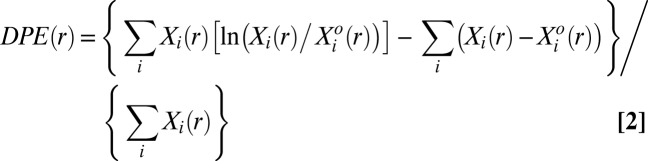 |
If the system is at the steady state, then  ; it only has amplitude away from the steady state. According to the calculated
  , two U87EGFRvIII cells separated by ∼80–100 μm are effectively at the steady state (Fig. 3A). Thus, we predict that in bulk cultures this distance range will occur more frequently than expected from a random cell distribution.
Fig. 3.

Predicting spatial distributions of U87EGFRvIII cells in bulk cell culture. (A) The DPE function provides a measurement of the deviation of two interacting cells from the steady state; it has a value near zero at midrange and a secondary minimum near 40 μm. The error bars were calculated by propagating errors associated with the mean values of measured proteins as a function of distance (SI Text, Determination of the Errors for the Calculated Parameters Obtained from Surprisal Analysis). (B) Using custom algorithms, optical micrographs of U87EGFRvIII cells in bulk culture were digitized and analyzed so that all cell pairs, up to a separation distance of 200 μm were measured, for ∼10,000 cell pairs. The resultant histogram provides a probability for finding a pair of the cells at a certain distance. The obtained probability was divided by a random probability of cell–cell distance distributions. This result was used as an input to calculate RDF. (C) The potential energy  of cell–cell interactions was calculated from the RDF. Values are mean ± SEM (n = 5). In every biological replicate
  cell pairs were found that had a separation distance of ≤200 μm and were used to calculate RDF and
  functions.
Validation.
We performed time-course microscopy analysis of U87EGFRvIII cellular distributions in bulk culture environments, starting from different initial seeding densities. Fig. S3, Upper shows representative micrographs of growing U87EGFRvIII cells at three time-points following seeding. The density shown in the 24-h panel is equivalent to that found in the SCBC experiments (Fig. S4A), and so was used for the calculation of a radial distribution function. At this point, cells have had time to migrate (18) and are adherent. One might ask why the cells would migrate in the bulk culture, whereas they are not observed to move on the SCBC platform. A likely answer is that the cell–cell interactions are additive. For example, consider two cells that are interacting at a distance smaller than the steady-state separation. The resultant force that tends to push those cells toward the steady-state distance might not be sufficient to overcome any energy barrier to motion (i.e., a static friction) that exists for the adherent GBM cells. When multiple cells are interacting, the forces between pairs of cells are additive, and thus are more able to overcome such a barrier. The implication is that the  constraint, though of a relatively small amplitude for two interacting cells, can exert a significant influence in a bulk culture or tissue.
Using custom algorithms, we extracted RDFs from microscopy measurements of ∼10,000 cell pairs (Fig. 3B). The RDF was computed from the bulk cell-to-cell distance distribution divided by a random probability distribution obtained from a Monte Carlo simulation. The RDF was then used to calculate the chemical potential of cell–cell interactions  by taking the natural logarithm of the RDF (19) (Fig. 3C and SI Text, Cell–Cell Distance Distribution Measurements and Calculations of u(r) Function). The main finding of Fig. 3 A and C is that the minimum of the DPE function (extracted from the SCBC cell pair data analysis) corresponds to the minimum of the
  function. The low chemical potential arising from cell–cell interactions (meaning a minimal deviation from the steady state) at 80–100 μm (Fig. 3A) predicts a higher probability for finding U87EGFRvIII cells at this distance range in bulk culture. U87EGFRvIII cells seeded at a lower initial density achieved a similar distance distribution after 72 h (Fig. S4C). Even after long culture times, U87EGFRvIII cells do not form dense 3D colonies (Fig. S3, Upper Right); we hypothesize that this is attributable to the higher stability of these cells when they are interacting with other cells at larger separations.
Bulk Distributions Indicate Pairwise Interactions in U87PTEN Cells.
We hypothesized that a measured RDF in cultured cells could be used to predict a cellular separation with the most stable signaling. As a test, we used U87PTEN GBM cells, which have WT expression of EGFR and PTEN, and subsequently decreased activity of EGFR downstream proteins (20, 21). We measured the RDF of U87PTEN cells within bulk cultures, using similar considerations as for U87EGFRvIII. That data were converted into potential energy [ ] as a function of distance (Fig. 4A), and suggests that the EGFR signaling activity in U87PTEN cells would have the smallest deviation from the steady state at small (20–30 μm) intercellular separations.
Fig. 4.

Bulk distributions indicate pairwise interactions in U87PTEN cells. (A) The potential energy ( ) describing U87PTEN cell–cell interactions was calculated from the measured RDF from the cells in bulk cell culture, at a cell density similar to that of an SCBC two-cell assay. Values are mean ± SEM (n = 5). Every biological replicate included
  cell–cell distances. (B) The DPE function for the U87PTEN cells, as estimated from analysis of SCBC data.
We next performed two-cell SCBC experiments, assaying for the same proteins. The SCBC data were divided into nine distance ranges (Fig. S5E). Using surprisal analysis (Table S4 and Fig. S5 C and D), the DPE function was calculated (Fig. 4B) similar to the case for the U87EGFRvIII cells. This function confirmed that deviation of EGFR signaling activity from the steady state at small cell–cell separation distances was essentially zero; this is reflected in the 3D dense colonies that form within cultures of these cells following 144-h incubation (Fig. S3, Lower). The DPE calculation detects relatively smaller deviations from the steady state at larger intercellular separations that are not reflected in the  plot. As a general rule, deviations from the U87PTEN steady state are significantly lower in amplitude than for the more aggressive U87EGFRvIII cells.
The SCBC permits two interesting additional comparisons. First, the levels of the proteins that were assayed from isolated U87EGFRvIII single cells (Fig. 5A, red boxes) were comparable to those levels observed near the steady-state distance range for the two-cell experiments; this is indicated by the overlap between the red box and the steady-state expression levels (Fig. 5A). In addition, the EGFR signaling pathway coordination, as estimated from protein–protein correlation networks extracted from the one- and two-cell data (Fig. 5B) (13) were also compared. For those two-cell systems that lay close to the steady state (Fig. 5B, range 60–110 μm), the signaling coordination is at a minimum, and comes closest to matching the one-cell network. These comparisons further suggest that the steady state of two U87EGFRvIII cells is near to that of an isolated single cell.
Fig. 5.

Comparisons of noninteracting U87EGFRvIII single cells with interacting cell pairs. (A) Mean values of protein levels, as measured for U87EGFRvIII single cells (n = 880), are compared against measurement of those same proteins for cell pairs, at cell separation distance ranges close to the steady state (80–100 μm for U87EGFRvIII cells) or deviating significantly (20–30 μm for U87EGFRvIII cells). The red box represents the measured range of copy numbers (multiplied by 2, ± SEM) for single cells. The black box is that range for cell pairs at the steady state, and the blue dots represent average levels for two-cell assays at different intercellular separations. (B) Protein–protein coordination maps were generated using U87EGFRvIII two-cell and single-cell data. To compute protein–protein Pearson correlation coefficients, the data were binned into the three distance ranges to achieve a statistics of more than 100 cells per distance bin. The thickness of the lines encircling the protein names reflects the relative abundance of those proteins. The single-cell data were multiplied by 2 for comparison. The thickness and color of the edges reflect the extent of the protein–protein coordination (P < 0.05) as provided in the key below the networks.
The U87PTEN cells, which exhibited significantly smaller variations in signaling as a function of intercellular separation, did not exhibit such clear trends (Fig. S6).
Discussion
GBM tumors are architecturally heterogeneous, possessing functional subdomains that can differentially express wtEGFR and EGFRvIII receptors (1, 3, 4). Several studies have demonstrated the more tumorigenic nature of the ERFRvIII protein, resulting in increased downstream signaling (21) and enhanced invasiveness and cell motility (2, 7, 22). Recently, a unidirectional cross-talk between EGFRvIII+ and wtEGFR cells was revealed within a heterogeneous GBM tumor; EGFRvIII+ cells were able to induce EGFR signaling through IL-6 in U87wtEGFR cells but not vice versa (1). It was shown that the minor subpopulation of EGFRvIII+ cells provided a positive environment for the wtEGFR and EGFRvIII+ cells to survive and proliferate, thereby promoting and maintaining a heterogeneous nature of the GBM tumor (1, 3). We hypothesize that such interactions might provide the driving forces that lead to spatially scattered distribution of EGFRvIII+ cells within the tumor. The work reported here represents a first step toward quantitatively understanding those interactions at a level that enables detailed predictions.
The developed approach is based on the assumption that biological systems can be described with the same thermodynamic-like considerations as nonequilibrium chemical or physical systems, which means that a biological system tends to maximize its entropy under the operative constraints. This assumption leads to Eq. 1 that enables the surprisal analysis of two-cell data, and the identification of the most stable state of EGFR signaling. This stable state is reflected in arrangements of GBM cells in bulk culture. The cells in the microchamber, as well as those in bulk culture, apparently share a common steady state. That homeostasis is reflected in a balance of cellular inputs, such as growth factor signaling, and outputs, such as cell division. The local cellular architecture influences those inputs and outputs, via physical contact or soluble factor signaling. When cells are in a microchamber, they are effectively fixed. If two cells are not at the steady-state separation, the only biological response is thus to alter the input/output balance—this is done by changing the levels of secreted growth factors (and perhaps other molecules). For our experiment, this is read out as a degree of activation of the EGFR signaling pathway. In bulk culture where the pairwise cellular interactions are additive, the cells can self-organize so as to achieve the steady-state separation.
Our findings indicate that U87EGFRvIII cells will exhibit a scattered distribution, whereas U87PTEN cells will closely pack. Although appropriate caution should be taken in comparing results from model cell lines with those of primary cells within tumors, recent experiments of tumor models do warrant comparisons. Our results are consistent with the scattered distributions of U87EGFRvIII cells within U87wtEGFR cell populations within a tumor seeded from a mixture of both cell types (1). We also find that single U87EGFRvIII cells have an EGFR signaling level close to that of the steady state in the two-cell system. The U87PTEN cells, however, appear to exhibit more stable EGFR signaling when they are closely packed, which again may help explain the more invasive nature of the U87EGFRvIII cells (2).
This work points toward the role that pairwise cell–cell interactions can play in determining cellular superstructures, as seen in both tissue culture and in model tumor systems. The approach explored here is conceptually simple, draws heavily from fundamental physicochemical principals, and appears to shed light on what is otherwise considered a complex biological problem (3). We anticipate that, by proceeding in a step-wise fashion, this type of approach may eventually permit the establishment of quantitative relationships between tissue architectures (traditional pathology) and cellular signaling activity molecular biomarkers.
Methods
Theory.
Determination of the steady state and deviations from the steady state.
For more details, see SI Text, Theory, and ref. 11. We assume that at any intercellular separation distance, the nonequilibrium biological system is in a state of minimal free energy subject to constraints. Measured protein expression levels as a function of that distance serve to define the mean levels of the steady-state protein distributions of the two-cell system, and the constraints that prevent the intercellular entropy from reaching its maximum. We seek to define distance ranges with minimal deviations from the steady state, because these are the most stable states of the two-cell system and thus are the most probable. To determine the values of the constraints and to identify the steady state, we use surprisal analysis. This analysis equates a representation of the data as a sum of terms (right-hand side of Eq. 1) to the logarithm of the measured expression level of protein i at the given distance r; this is repeated for every distance range. SVD is then used as a mathematical tool to determine the two sets of parameters that are needed in surprisal analysis: the distance-dependent weights of the constraints  (also called Lagrange multipliers), and the participation of each individual protein i in the specific constraint
  (
( ).
).
DPE function.
The DPE is a deviation in the free energy per protein molecule from the steady state due to the biological constraints (SI Text, DPE Function). The DPE function was calculated using the experimental levels (copy numbers),  of the proteins in the EGFR network, and the calculated protein levels at the steady state
  . We seek that distance range r for which this function is the minimum to identify the most stable state of the two-cell system.
The  function.
The  is the effective potential energy of the cell–cell interaction in bulk cultures mediated by the surrounding cells and is calculated from the measured RDF (19). In a low-density limit such as the bulk U87EGFRvIII system, the effect of the three and higher body interactions is small. The RDF is a measure of the probability of finding a cell at a distance of r from another cell. Using light microscopy imaging of U87EGFRvIII or U87PTEN cells in bulk cultures, along with custom image-processing algorithms, the centers of the cells were detected and the center-to-center separation distances between the cells were computed (SI Text, Cell–Cell Distance Distribution Measurements and Calculations of u(r) Function). All cell pairs separated by ≤200 μm were included, and binned into histograms to calculate the probability for finding a pair of cells at a specific distance. To calculate
  function, the obtained probability was divided by a random probability of cell–cell distance distributions computed using a Monte Carlo simulation, in which cells were randomly placed with a cell–cell separation of 20–200 μm at a density comparable to the SCBC microchambers and cell culture environments (SI Text, Cell–Cell Distance Distribution Measurements and Calculations of u(r) Function). The minimum of the function represents the most probable distance range in the bulk cultures.
Cell culture and reagents.
U87 EGFRvIII and U87PTEN were constructed as reported (21) and were kindly provided by Paul Mischel’s laboratory (University of California, San Diego, La Jolla, CA). Cell lines were routinely maintained in DMEM (American Type Culture Collection) containing 10% (vol/vol) FBS in a humidified atmosphere of 5% (vol/vol) CO2, 95% (vol/vol) air at 37 °C. See Table S1 for the antibodies and reagents used in the study.
SCBC design and fabrication.
The SCBC is composed of a single elastomer microfluidics layer bonded on top of a barcode-patterned glass slide. Details of microchip design and fabrication can be found in ref. 12. In brief, standard photolithographic techniques were used to generate hard molds with 3D features. These molds were used to mold PDMS elastomer layers to contain the 8,700 microchambers and associated microchannels. For on-chip experiments, cells are randomly loaded to microchambers and the cell numbers and cell positions are recorded using light microscopy imaging through the transparent microchip. With a cell concentration at 1 × 10⁶/mL for loading, we achieve ∼2,000 single-cell measurements and >500 two-cell measurements.
Antibody microarray.
The antibody microarray is initially an array of distinct ssDNA oligomers; it is converted into an antibody array using antibody–ssDNA conjugates just before assay execution. The microarray has the capacity of multiplexed measurement up to eight different proteins. The detailed procedure of manufacturing the microarrays can be found in SI Text. The microarray repeats across the glass slide surface at a density that ensures that each of the 8,700 microchambers contains a full microarray.
On-chip assay.
The molded PDMS elastomer containing the microchambers and microchannels is mated onto a barcoded microarray for the single-cell assays. All microchambers and microchannels were blocked with 3% (vol/vol) BSA in pH 7.4 PBS for 1 h to minimize any nonspecific binding. A mixture of 10 µg/mL antibody–DNA conjugates was flowed into the chip to convert the ssDNA microarray into an antibody microarray, followed by incubation for 1 h at 37 °C. After removal of unbound conjugates, cells were loaded onto the SCBC chip, the microchambers were isolated from each other by applying pressure with the clamp (12), and the whole chip was incubated at 37 °C in a 5% (vol/vol) CO2 incubator. Cells in chambers were imaged using an epifluorescence microscope Olympus IX81. See SI Text for more details about protein detection and quantification in one- or two-cell systems.
Data analysis.
The microarray slide was scanned by an Axon GenePix 4400A (Molecular Devices) with the following settings: laser power 80% (635 nm) and 10% (532 nm); optical gain 600 (635 nm) and 400 (532 nm). The resultant images were digitized at 16 bits. A custom algorithm, written in MatLab (MathWorks, Inc.), was used to export the digitized fluorescence image and associate the individual array spots with microchamber address labels and protein identification tags. The digitized microarray fluorescence data were converted into protein copy numbers using a calibration curve (13).
Supplementary Material
Acknowledgments
We thank Alexander Levitzki and Ayelet Lesman for valuable discussions. Financial support was provided by National Cancer Institute Grant 5U54 CA119347 (to J.R.H.), the Jean Perkins Foundation, the Ben and Catherine Ivy Foundation, and European Commission FP7 Future and Emerging Technologies-Open Project BAMBI 618024 (to F.R. and R.D.L.). N.K.-B. is the recipient of a European Molecular Biology Organization Long-Term Fellowship. F.R. is Director of Fonds National de la Recherche Scientifique, Belgium.
Footnotes
The authors declare no conflict of interest.
This article contains supporting information online at www.pnas.org/lookup/suppl/doi:10.1073/pnas.1404462111/-/DCSupplemental.
References
- 1.Inda MM, et al. Tumor heterogeneity is an active process maintained by a mutant EGFR-induced cytokine circuit in glioblastoma. Genes Dev. 2010;24(16):1731–1745. doi: 10.1101/gad.1890510. [DOI] [PMC free article] [PubMed] [Google Scholar]
- 2.Lal A, et al. Mutant epidermal growth factor receptor up-regulates molecular effectors of tumor invasion. Cancer Res. 2002;62(12):3335–3339. [PubMed] [Google Scholar]
- 3.Bonavia R, Inda MM, Cavenee WK, Furnari FB. Heterogeneity maintenance in glioblastoma: A social network. Cancer Res. 2011;71(12):4055–4060. doi: 10.1158/0008-5472.CAN-11-0153. [DOI] [PMC free article] [PubMed] [Google Scholar]
- 4.Nishikawa R, et al. Immunohistochemical analysis of the mutant epidermal growth factor, deltaEGFR, in glioblastoma. Brain Tumor Pathol. 2004;21(2):53–56. doi: 10.1007/BF02484510. [DOI] [PubMed] [Google Scholar]
- 5.da Fonseca AC, Badie B. Microglia and macrophages in malignant gliomas: Recent discoveries and implications for promising therapies. Clin Dev Immunol. 2013;2013:264124. doi: 10.1155/2013/264124. [DOI] [PMC free article] [PubMed] [Google Scholar]
- 6.Huang J, et al. Transactivation of the epidermal growth factor receptor by formylpeptide receptor exacerbates the malignant behavior of human glioblastoma cells. Cancer Res. 2007;67(12):5906–5913. doi: 10.1158/0008-5472.CAN-07-0691. [DOI] [PubMed] [Google Scholar]
- 7.Mukherjee J, et al. Loss of collapsin response mediator Protein1, as detected by iTRAQ analysis, promotes invasion of human gliomas expressing mutant EGFRvIII. Cancer Res. 2009;69(22):8545–8554. doi: 10.1158/0008-5472.CAN-09-1778. [DOI] [PubMed] [Google Scholar]
- 8.Sciaccaluga M, et al. CXCL12-induced glioblastoma cell migration requires intermediate conductance Ca2+-activated K+ channel activity. Am J Physiol Cell Physiol. 2010;299(1):C175–C184. doi: 10.1152/ajpcell.00344.2009. [DOI] [PubMed] [Google Scholar]
- 9.Laidler K. A glossary of terms used in chemical kinetics, including reaction dynamics (IUPAC Recommendations 1996) Pure Appl Chem. 1996;68(1):149–192. [Google Scholar]
- 10.Levine RD, Bernstein RB. Energy disposal and energy consumption in elementary chemical reactions. Information theoretic approach. Acc Chem Res. 1974;7(12):393–400. [Google Scholar]
- 11.Remacle F, Kravchenko-Balasha N, Levitzki A, Levine RD. Information-theoretic analysis of phenotype changes in early stages of carcinogenesis. Proc Natl Acad Sci USA. 2010;107(22):10324–10329. doi: 10.1073/pnas.1005283107. [DOI] [PMC free article] [PubMed] [Google Scholar]
- 12.Wang J, et al. Quantitating cell–cell interaction functions with applications to glioblastoma multiforme cancer cells. Nano Lett. 2012;12(12):6101–6106. doi: 10.1021/nl302748q. [DOI] [PMC free article] [PubMed] [Google Scholar]
- 13.Shi Q, et al. Single-cell proteomic chip for profiling intracellular signaling pathways in single tumor cells. Proc Natl Acad Sci USA. 2012;109(2):419–424. doi: 10.1073/pnas.1110865109. [DOI] [PMC free article] [PubMed] [Google Scholar]
- 14.Kravchenko-Balasha N, et al. On a fundamental structure of gene networks in living cells. Proc Natl Acad Sci USA. 2012;109(12):4702–4707. doi: 10.1073/pnas.1200790109. [DOI] [PMC free article] [PubMed] [Google Scholar]
- 15.Levine RD. Molecular Reaction Dynamics. Cambridge, UK: Cambridge Univ Press; 2005. [Google Scholar]
- 16.Kravchenko-Balasha N, et al. Convergence of logic of cellular regulation in different premalignant cells by an information theoretic approach. BMC Syst Biol. 2011;5:42. doi: 10.1186/1752-0509-5-42. [DOI] [PMC free article] [PubMed] [Google Scholar]
- 17.Xie Q, et al. A highly invasive human glioblastoma pre-clinical model for testing therapeutics. J Transl Med. 2008;6:77. doi: 10.1186/1479-5876-6-77. [DOI] [PMC free article] [PubMed] [Google Scholar]
- 18.Sun S, et al. Knockdown of CypA inhibits interleukin-8 (IL-8) and IL-8-mediated proliferation and tumor growth of glioblastoma cells through down-regulated NF-κB. J Neurooncol. 2011;101(1):1–14. doi: 10.1007/s11060-010-0220-y. [DOI] [PMC free article] [PubMed] [Google Scholar]
- 19. McQuarrie DA (2000) Statistical Mechanics (University Science Books, Sausalito, CA)
- 20.Parsa AT, et al. Loss of tumor suppressor PTEN function increases B7-H1 expression and immunoresistance in glioma. Nat Med. 2007;13(1):84–88. doi: 10.1038/nm1517. [DOI] [PubMed] [Google Scholar]
- 21.Wang MY, et al. Mammalian target of rapamycin inhibition promotes response to epidermal growth factor receptor kinase inhibitors in PTEN-deficient and PTEN-intact glioblastoma cells. Cancer Res. 2006;66(16):7864–7869. doi: 10.1158/0008-5472.CAN-04-4392. [DOI] [PubMed] [Google Scholar]
- 22.Hatanpaa KJ, Burma S, Zhao D, Habib AA. Epidermal growth factor receptor in glioma: Signal transduction, neuropathology, imaging, and radioresistance. Neoplasia. 2010;12(9):675–684. doi: 10.1593/neo.10688. [DOI] [PMC free article] [PubMed] [Google Scholar]
Associated Data
This section collects any data citations, data availability statements, or supplementary materials included in this article.