Abstract
The aberrantly vascularized peripheral retina in retinopathy of prematurity (ROP) may be associated with visual field constriction, retinal dysfunction, and abnormalities in retinal thickness, commonly assessed by spectral domain optical coherence tomography (SDOCT). However, due to the limitation of SDOCT for peripheral retinal imaging, retinal thickness in avascular peripheral retina in ROP has not been evaluated. Oxygen induced retinopathy (OIR) in mice has features of vasculopathy similar to those in human ROP. These features occur in the posterior retina and thereby are accessible by standard imaging methods. The purpose of the current study was to determine the correspondence between abnormalities in retinal thickness and vasculopathy in neonatal OIR mice by simultaneous SDOCT imaging and fluorescein angiography (FA). Newborn mice (N = 19; C57BL/6J strain) were exposed to 77% oxygen from postnatal day 7 (P7) to P12. Age-matched control mice (N = 12) were raised in room air. FA and SDOCT were performed in mice between P17 and P19 to visualize retinal vasculature and measure retinal thickness, respectively. Retinal thickness measurements in vascular regions of interest (ROIs) of control mice, and in hypovascular and avascular ROIs of OIR mice were compared. In control mice, FA showed uniformly dense retinal capillary networks between major retinal vessels and retinal thickness of vascular ROIs was 260 ± 7 μm (N = 12). In OIR mice, FA displayed hypovascular regions with less dense and fewer capillaries and avascular regions devoid of visible capillaries. Retinal thickness measurements of hypovascular and avascular ROIs were 243 ± 21 μm and 209 ± 11 μm (N = 19), respectively. Retinal thickness in hypovascular and avascular ROIs of OIR mice was significantly lower than in vascular ROIs of control mice (p ≤ 0.01). Likewise, retinal thickness in avascular ROIs was significantly lower than in hypovascular ROIs (p < 0.001). Retinal thinning in hypovascular and avascular regions may be due to arrested retinal development and/or ischemia induced apoptosis.
Keywords: Oxygen Induced Retinopathy, Retinal Thickness, Vasculopathy, Retinopathy of Prematurity, Mice
1. Introduction
Retinopathy of prematurity (ROP) can be associated with visual deficits related to abnormal vascular development. Compared to normal preterm eyes, eyes with ROP have visual field constriction with or without treatment of the peripheral, aberrantly vascularized retina (Quinn et al., 1996). Reduction in visual field extent may be caused by ROP or cryotherapy and laser treatments of avascular peripheral retina (O’Connor et al., 2007, Quinn et al., 2011), but it is not well understood how visual field constrictions may decrease patient functional ability. Patients with mild and severe ROP have deficits in rod photoreceptor and post-receptor sensitivity as demonstrated by electroretinogram studies (Harris et al., 2011). While post-receptor rod retinal sensitivity improves in mild ROP, post-receptor recovery is reduced in retinas with severe ROP, likely due to abnormalities in the post-receptor neural retina and its vascular supply (Harris et al., 2011). Related to ROP severity, the peripheral avascular retina in the acute phase of ROP may develop abnormal visual function even if later vascularized during ROP regression. This vulnerable, aberrant vascularized peripheral retina has been well studied with fluorescein angiography (FA) but has not been adequately imaged with spectral domain optical coherence tomography (SDOCT) due to limitations in imaging the peripheral retina beyond Zone 1 (Maldonado et al., 2012). Improved understanding of retinal vasculature and layer morphology in ROP is critical for determining the effects of ROP and possible treatments on retinal structure, function, and visual prognosis (Fulton et al., 2009, Harris et al., 2011).
Oxygen induced retinopathy (OIR) in the mouse has been used to model human ROP and has demonstrated ROP-related features including avascularity, vessel dilation and tortuosity, and neovascularization more centrally compared to the same features in the peripheral retina of human ROP (Smith et al., 1994). OIR studies have traditionally used retinal flat mounts to determine vascular patterns and histologic sections for evaluation of retinal morphology in different enucleated eyes (Smith et al., 1994). This separate assessment of retinal vasculature and morphology has not hindered research progress, but it has made it impossible to directly relate spatial variations of retinal layer architecture to en face vascular abnormalities. Accordingly, in prior OIR studies, any change in histology related to abnormal vasculature has often only been assumed by inference among different eyes rather than direct evidence from the same eyes.
More recently, FA in living OIR mice has confirmed prior retinal flat mount findings of vascular changes (Mezu-Ndubuisi et al., 2013, Nakao et al., 2013). Furthermore, the posterior location of retinal pathology in OIR, unlike human ROP, may be imaged simultaneously with FA and SDOCT. In the present study, FA and SDOCT imaging techniques were utilized to provide correspondence of retinal vascular and thickness abnormalities in the same locations of the same eyes of living OIR mice.
2. Experimental Procedures
2.1. Animals
All experimental procedures were approved by the Animal Care Committee of the University of Illinois at Chicago and were in accordance with the ARVO Statement for the Use of Animals in Ophthalmic and Visual Research. The procedures have been previously reported (Mezu-Ndubuisi et al., 2013). Neonatal wild type mice (C57BL/6J) were separated into two experimental groups (OIR and control). Control mice were raised in room air throughout the experiment. Using an established model (Smith et al., 1994), the OIR mice were exposed to 77% oxygen in a hyperoxia chamber (Biospherix Ltd., Redfield, NY) for 5 days starting from postnatal day 7 (P7) which induced vaso-obliteration. At P12, the mice were returned to room air which triggered vascular regrowth due to the relative hypoxia. Imaging was performed in control and OIR mice at P17, P18, or P19, when pronounced vasculopathy features were present. The body weights of the control and OIR mice were 8.2 ± 2.6 g (mean ± SD; N = 12) and 6.1 ± 1.3 g (N = 19), respectively. Prior to imaging, mice were anesthetized with an intraperitoneal injection of ketamine (100 mg/kg) and xylazine (5 mg/kg) and pupils were dilated. For FA, an intraperitoneal injection of 10% fluorescein sodium (AK-FLUOR®, Akorn, Decatur, IL) was administered at a dose of 100 mg/kg.
Imaging and Image Analysis
FA and SD-OCT imaging were performed simultaneously with a commercially available instrument (Spectralis, Heidelberg Engineering, Heidelberg, Germany) in one eye of each mouse. FA images were acquired with a field of view of approximately 5 optic disk (OD) diameters. Images were obtained nasal or temporal to the OD because the instrument’s range of motion was greater horizontally (nasal and temporal) than vertically (superior and inferior). In the same imaged area, SD-OCT volume data were acquired consisting of 31 raster B-scans (1536 × 496 pixels).
FA images in control mice showed a uniformly dense capillary network (vascular), while in OIR mice, the capillary network was less dense and vascularized (hypovascular), and in some regions, no capillary network was visible (avascular). Based on visualization of the vasculature in FA images, in each control mouse, one region of interest (ROI) was selected between major retinal blood vessels that displayed a uniformly dense capillary network (vascular). In each OIR mouse, two ROIs (hypovascular and avascular) were selected. Hypovascular ROIs had fewer visible and often enlarged capillaries compared to the capillary network of control mice, and avascular ROIs were devoid of visible capillaries. In 19 of 25 OIR mice that were imaged, both avascular and hypovascular ROIs were clearly discerned and therefore data from these mice were selected to permit paired comparisons. In each of 12 control mice, one vascular ROI was selected. The number of control mice imaged at P17, P18, and P19 was 6, 3, and 3, respectively, while the number of OIR mice imaged at P17, P18, and P19 was 7, 5, and 7, respectively.
Retinal thickness maps were generated automatically using the instrument’s software by measuring the distance between the internal limiting membrane (ILM) and retinal pigment epithelium (RPE) in each SD-OCT B-Scan. Retinal thickness maps were visually inspected for regions of abrupt change in thickness due to segmentation errors by the software. B-scans that traversed these regions were examined for ILM or RPE segmentation errors, which were corrected manually. An average retinal thickness was obtained in the central subfield (approximately one disk area in mice) of the Early Treatment Diabetic Retinopathy Study target, manually placed on each ROI.
Twelve vascular ROIs (6 nasal and 6 temporal) were identified in 12 control mice and 19 hypovascular and 19 avascular ROIs (9 nasal and 10 temporal) were identified in 19 OIR mice. In OIR mice, hypovascular and avascular ROIs were on the same side of the OD. Since normal spatial variations in retinal thickness may be present, to ensure thickness measurements were obtained from similar retinal regions of control and OIR mice, distances of vascular, hypovascular, and avascular ROIs from the OD center were calculated and statistically compared. Furthermore, similarity of normal retinal thickness between nasal and temporal vascular ROIs at equivalent distances from the OD was statistically verified.
2.2. Data Analysis
Mean retinal thickness measurements obtained at different post natal ages (P17, P18, and P19) were compared using one-way analysis of variance (ANOVA). Mean distances from the OD and retinal thickness between hypovascular (or avascular) and vascular ROIs were compared using unpaired Students t-test. Mean distances from the OD and retinal thickness between hypovascular and avascular ROIs were compared using paired Students t-test. Mean distances from OD and retinal thickness between nasal and temporal vascular ROIs were compared using unpaired Students t-test. Statistical significance was accepted at p < 0.05.
Results
An example of an FA image acquired in a control mouse in a region nasal to the OD is shown in Fig 1A. The FA image revealed a uniformly dense capillary network and normal major retinal blood vessels. The retinal thickness map generated in the same control mouse and overlaid on the FA image is displayed in Fig 1B. The thickness map was relatively uniform with minor variations near the OD. Retinal thickness in one selected vascular ROI in this control mouse was 266 μm.
Figure 1.
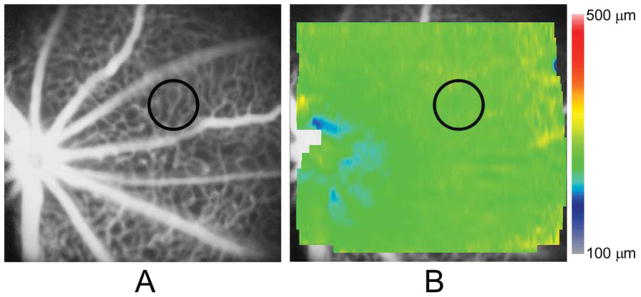
(A) An example of a fluorescein angiogram (FA) image obtained in a control mouse displaying major retinal vessels and a uniformly dense capillary network. A vascular region of interest (ROI) is denoted by a black circle; (B) A retinal thickness map generated in the same mouse and overlaid on the FA image, displaying essentially uniform thickness. Color bar displays retinal thickness in microns. Retinal thickness in the vascular ROI (black circle) was 266 μm.
An example of an FA image obtained in an OIR mouse nasal to the OD is shown in Fig 2A. The FA image displayed hypovascular and avascular ROIs between major retinal vessels. Other retinal vascular abnormalities, including dilated veins and increased tortuosity in arteries, were also observed. The retinal thickness map obtained in the same OIR mouse is shown overlaid on the FA image in Fig 2B. The retinal thickness map was non-uniform, with reduced thickness in the avascular ROI (195 μm) as compared to the hypovascular ROI (227 μm).
Figure 2.
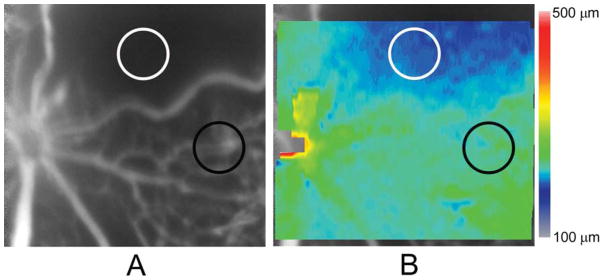
(A) An example of a fluorescein angiogram (FA) image obtained in an oxygen induced retinopathy mouse displaying a hypovascular region with a paucity of capillaries and an avascular region without any visible capillaries, between major retinal blood vessels with irregular caliber and tortuosity. Hypovascular and avascular regions of interest (ROIs) are denoted by black and white circles, respectively. (B) A retinal thickness map generated in the same mouse and overlaid on the FA image, displaying thickness variations. Color bar displays retinal thickness in microns. Retinal thickness in the hypovascular (black circle) and avascular (white circle) ROIs were 227 μm and 195 μm, respectively.
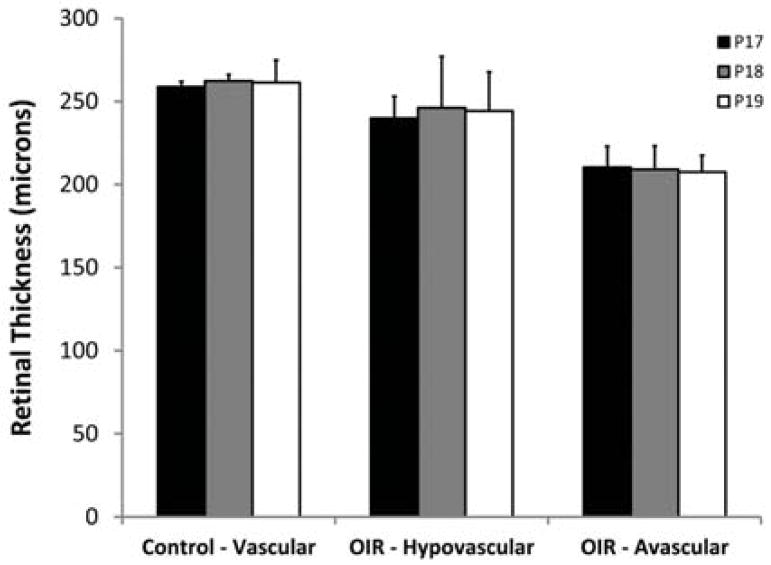
Mean retinal thickness in vascular ROIs of control mice and in hypovascular and avascular ROIs of OIR mice, stratified by post-natal age, are shown in Fig 3. There was no significant effect of age on retinal thickness in vascular ROIs of control mice (p = 0.76) or in hypovascular and avascular ROIs of OIR mice (p ≥ 0.89). Accordingly, data obtained at P17, P18, and P19 were combined in each group of mice.
Figure 3.
Mean retinal thickness in vascular regions of interest (ROIs) of control mice and in hypovascular and avascular ROIs of oxygen induced retinopathy mice, stratified by postnatal age. Error bars represent standard deviation.
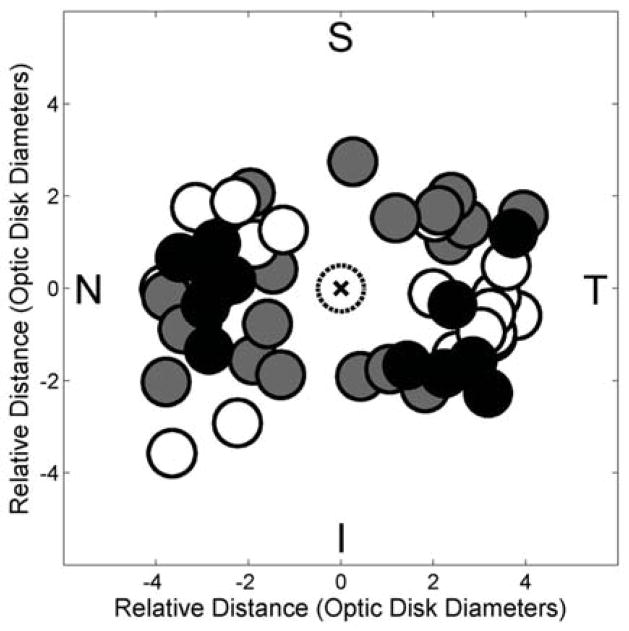
The locations of vascular ROIs in control mice, and avascular and hypovascular ROIs in OIR mice are plotted in Fig 4. Mean distances of vascular, hypovascular, and avascular ROIs from the OD center were 3.0 ± 0.6, 2.8 ± 0.8, and 3.2 ± 0.8 OD diameters, respectively. There was no statistically significant difference in distances between hypovascular (or avascular) ROIs of OIR mice and those in vascular ROIs of control mice (p > 0.37). Similarly, there was no statistically significant difference in distances between hypovascular and avascular ROIs of OIR mice (p = 0.07). In control mice, distances of nasal and temporal vascular ROIs from the OD were similar (p = 0.64).
Figure 4.
Compiled locations of vascular regions of interest (ROIs) (black circles) of control mice, and hypovascular ROIs (gray circles) and avascular ROIs (white circles) of oxygen induced retinopathy mice plotted relative to the optic disk (dotted circle marked with an x). Nasal, temporal, superior, and inferior quadrants are denoted by N, T, S, and I, respectively.
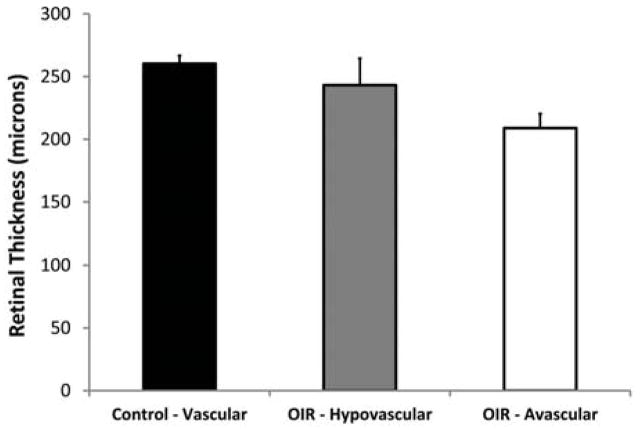
Mean retinal thickness in vascular ROIs of control mice and in hypovascular and avascular ROIs of OIR mice are shown in Figure 5. In control mice, retinal thickness measurements in nasal (261 ± 4 μm, N = 6) and temporal (260 ± 9 μm, N = 6) vascular ROIs were similar (p = 0.87). Mean retinal thickness of all vascular ROIs was 260 ± 7 μm (N = 12), yielding a coefficient of variation of 3%, which is indicative of minimal variations in retinal thickness measured at different meridians and distances from the OD. In OIR mice, mean retinal thickness measurements in hypovascular and avascular ROIs were 243 ± 21 μm and 209 ± 11 μm (N = 19), respectively. Retinal thickness in OIR mice was significantly lower in hypovascular ROIs (p = 0.01) and in avascular ROIs (p < 0.001) as compared to retinal thickness in vascular ROIs of control mice. Furthermore, avascular ROIs had significantly thinner retinas as compared to hypovascular ROIs (p < 0.001).
Figure 5.
Mean retinal thickness in vascular regions of interest (ROIs) of control mice and in hypovascular and avascular ROIs of oxygen induced retinopathy mice. Error bars represent standard deviation. Each mean retinal thickness differed significantly from the other two (p ≤ 0.01).
3. Discussion
The aberrantly vascularized posterior retina in OIR mice bears similarities to the initially avascular peripheral retina in human ROP. In the current study, the posterior location of vasculopathy in OIR mice enabled investigation of the relationship between retinal thinning and aberrant vascularization with standard FA and SDOCT imaging techniques. Similar retinal changes likely occur in human ROP in the periphery, which has not been imaged simultaneously with current SDOCT and FA technologies (Maldonado et al., 2012).
The present study demonstrates that retinal thickness changes, as visualized as an en face map, are directly related to retinal vascularization patterns seen at the same locations in the same eyes of living OIR mice. This direct spatial correspondence of vasculature and thickness changes was previously impossible to demonstrate in prior OIR studies that used flat mounts of retinal vasculature and histologic retinal cross sections in different enucleated eyes. Furthermore, histologic sections in regions of OIR pathology have never been assembled into en face maps of retinal thickness to demonstrate how variations in thickness relate to vascular aberrations.
In the current study, retinal thickness was reduced in aberrantly vascularized regions of OIR mice as compared to regions of normal vascularization in control mice. In OIR, hyperoxia causes vaso-obliteration and avascularity in some regions of the retina, while upon return to room air, relative hypoxia resumes vascularization resulting in regions of hypovascularity. Our finding of retinal thinning may be attributed to arrested retinal development and/or apoptotic retinal cell loss due to ischemia, in agreement with the previously reported loss of amacrine cells and thinning of the rod outer segment layer in OIR rats (Downie et al., 2010, Fulton et al., 1999). The finding of less retinal thinning in hypovascular regions as compared to avascular regions suggests increased vascularization and perfusion may resume retinal structural development. Future longitudinal studies are needed to determine if normal retinal thickness will develop with completion of vascularization in OIR mice.
Normal spatial variations and OIR-induced abnormalities in retinal thickness may be confounded, unless data were obtained from exactly the same retinal regions in control and OIR mice. However, selection of ROIs that precisely overlapped was precluded because locations of major retinal vessels and regions of vasculopathy varied among mice. In the current study, the proximity of ROI locations to the optic disk was comparable among all mice and minimal thickness variations (3%) were found among vascular ROIs of control mice. Therefore, spatial variations in retinal thickness did not likely affect the results of the study. Differences in body weight between control and OIR mice may have been a factor in the observed retinal thinning. Since OIR and control mice were age-matched, as a consequence, the OIR mice had lower body weights. Nevertheless, the finding of less retinal thinning in hypovascular regions as compared to avascular regions of the same OIR mice was not influenced by this difference.
In summary, this study demonstrates that retinal thickness changes are directly related to retinal vascularization patterns in the same locations of the same eyes of living OIR mice. This spatial relationship between changes in retinal vasculature and thickness was impossible to establish previously in OIR studies that used flat mounts of retinal vasculature and histologic retinal cross sections in different enucleated eyes. These abnormalities in retinal thickness may also occur in the vulnerable, peripheral avascular retina in human ROP.
4. Conclusions
In conclusion, retinal thinning in both hypovascular and avascular regions of OIR mice was demonstrated. We hypothesize that this phenotypic feature results from arrested retinal development and/or apoptosis due to ischemia. Better understanding of the relationship between retinal vasculature and retinal structure in these vulnerable regions is needed to determine the long term effects of ROP and possible treatments on final visual function and prognosis. Simultaneous and longitudinal assessment of alterations in retinal thickness and vascularization due to OIR may improve understanding of ROP and other retinal vascular diseases.
Highlights.
Retinal thickness and vascularization were imaged simultaneously in living OIR mice
Retinal thickness was reduced in aberrantly vascularized regions of OIR mice
Avascular regions had lower retinal thicknesses than hypovascular regions
Assessing thickness in aberrantly vascularized retina may improve knowledge of ROP
Acknowledgments
NIH grants: R01 EY017918, P30 EY001792, R01 HL066109, R01 ES011863, Research to Prevent Blindness
Footnotes
Publisher's Disclaimer: This is a PDF file of an unedited manuscript that has been accepted for publication. As a service to our customers we are providing this early version of the manuscript. The manuscript will undergo copyediting, typesetting, and review of the resulting proof before it is published in its final citable form. Please note that during the production process errors may be discovered which could affect the content, and all legal disclaimers that apply to the journal pertain.
References
- Downie LE, Hatzopoulos KM, Pianta MJ, Vingrys AJ, Wilkinson-Berka JL, Kalloniatis M, Fletcher EL. Angiotensin type-1 receptor inhibition is neuroprotective to amacrine cells in a rat model of retinopathy of prematurity. J Comp Neurol. 2010;518:41–63. doi: 10.1002/cne.22205. [DOI] [PubMed] [Google Scholar]
- Fulton AB, Hansen RM, Moskowitz A, Akula JD. The neurovascular retina in retinopathy of prematurity. Progress in retinal and eye research. 2009;28:452–482. doi: 10.1016/j.preteyeres.2009.06.003. [DOI] [PMC free article] [PubMed] [Google Scholar]
- Fulton AB, Reynaud X, Hansen RM, Lemere CA, Parker C, Williams TP. Rod photoreceptors in infant rats with a history of oxygen exposure. Investigative ophthalmology & visual science. 1999;40:168–174. [PubMed] [Google Scholar]
- Harris ME, Moskowitz A, Fulton AB, Hansen RM. Long-term effects of retinopathy of prematurity (ROP) on rod and rod-driven function. Documenta ophthalmologica. Advances in ophthalmology. 2011;122:19–27. doi: 10.1007/s10633-010-9251-0. [DOI] [PMC free article] [PubMed] [Google Scholar]
- Maldonado RS, O’Connell R, Ascher SB, Sarin N, Freedman SF, Wallace DK, Chiu SJ, Farsiu S, Cotten M, Toth CA. Spectral-domain optical coherence tomographic assessment of severity of cystoid macular edema in retinopathy of prematurity. Archives of ophthalmology. 2012;130:569–578. doi: 10.1001/archopthalmol.2011.1846. [DOI] [PMC free article] [PubMed] [Google Scholar]
- Mezu-Ndubuisi OJ, Teng PY, Wanek J, Blair NP, Chau FY, Reddy NM, Raj JU, Reddy SP, Shahidi M. In vivo retinal vascular oxygen tension imaging and fluorescein angiography in the mouse model of oxygen-induced retinopathy. Investigative ophthalmology & visual science. 2013;54:6968–6972. doi: 10.1167/iovs.13-12126. [DOI] [PMC free article] [PubMed] [Google Scholar]
- Nakao S, Arita R, Nakama T, Yoshikawa H, Yoshida S, Enaida H, Hafezi-Moghadam A, Matsui T, Ishibashi T. Wide-field laser ophthalmoscopy for mice: a novel evaluation system for retinal/choroidal angiogenesis in mice. Investigative ophthalmology & visual science. 2013;54:5288–5293. doi: 10.1167/iovs.13-11946. [DOI] [PubMed] [Google Scholar]
- O’Connor AR, Wilson CM, Fielder AR. Ophthalmological problems associated with preterm birth. Eye (Lond) 2007;21:1254–1260. doi: 10.1038/sj.eye.6702838. [DOI] [PubMed] [Google Scholar]
- Quinn GE, Dobson V, Hardy RJ, Tung B, Palmer EA, Good WV Early Treatment for Retinopathy of Prematurity Cooperative G. Visual field extent at 6 years of age in children who had high-risk prethreshold retinopathy of prematurity. Archives of ophthalmology. 2011;129:127–132. doi: 10.1001/archophthalmol.2010.360. [DOI] [PubMed] [Google Scholar]
- Quinn GE, Dobson V, Hardy RJ, Tung B, Phelps DL, Palmer EA. Visual fields measured with double-arc perimetry in eyes with threshold retinopathy of prematurity from the cryotherapy for retinopathy of prematurity trial. The CRYO-Retinopathy of Prematurity Cooperative Group. Ophthalmology. 1996;103:1432–1437. doi: 10.1016/s0161-6420(96)30487-9. [DOI] [PubMed] [Google Scholar]
- Smith LE, Wesolowski E, McLellan A, Kostyk SK, D’Amato R, Sullivan R, D’Amore PA. Oxygen-induced retinopathy in the mouse. Investigative ophthalmology & visual science. 1994;35:101–111. [PubMed] [Google Scholar]


