

Background: Cytochrome P450 (P450, CYP) 2U1 is an “orphan” enzyme, only reported to catalyze some fatty acid oxidations.
Results: Metabolomic screening led to the identification of N-arachidonoylserotonin as a substrate.
Conclusion: P450 2U1 catalyzes oxygenation at C-2 of the indole ring.
Significance: The localization of P450 2U1 and its metabolism of an inhibitor of fatty acid amide hydrolase may indicate a function in brain.
Keywords: Arachidonic Acid, Cytochrome P450, Eicosanoid, Lipid Oxidation, Mass Spectrometry (MS)
Abstract
Cytochrome P450 (P450) 2U1 has been shown to be expressed, at the mRNA level, in human thymus, brain, and several other tissues. Recombinant P450 2U1 was purified and used as a reagent in a metabolomic search for substrates in bovine brain. In addition to fatty acid oxidation reactions, an oxidation of endogenous N-arachidonoylserotonin was characterized. Subsequent NMR and mass spectrometry and chemical synthesis showed that the main product was the result of C-2 oxidation of the indole ring, in contrast to other human P450s that generated different products. N-Arachidonoylserotonin, first synthesized chemically and described as an inhibitor of fatty acid amide hydrolase, had previously been found in porcine and mouse intestine; we demonstrated its presence in bovine and human brain samples. The product (2-oxo) was 4-fold less active than N-arachidonoylserotonin in inhibiting fatty acid amide hydrolase. The rate of oxidation of N-arachidonoylserotonin was similar to that of arachidonic acid, one of the previously identified fatty acid substrates of P450 2U1. The demonstration of the oxidation of N-arachidonoylserotonin by P450 2U1 suggests a possible role in human brain and possibly other sites.
Introduction
Cytochrome P450 (P450) enzymes play important roles in the metabolism of steroids, drugs, carcinogens, and numerous other compounds in mammals (1). Included among the substrates are compounds of both endogenous and exogenous (xenobiotic) origin (2). Some of the human P450 enzymes can rather clearly be defined as using only certain endogenous substrates (e.g. steroids, prostanoids), whereas others only use xenobiotic substrates. Some P450s use both, e.g. P450 1B1 and P450 46A1 (3–5). Of the 57 human P450 genes, approximately one-fourth can still be classified as “orphans” in that these were, in general, discovered through the Human Genome Project, and our understanding of their biological functions is still rather limited (6).
The functional annotation of gene products is a central problem in biology today (7, 8). Several approaches can be applied to the issue. One involves prediction from a crystal structure, but this is problematic with P450s because their conformations usually change upon ligand binding (9). Another is a biased (i.e. trial and error) approach, sometimes guided by similarities to enzymes of known function. A third approach is the use of limited libraries of compounds to find leads, which can be explored in further chemical space (10). Sequence similarity may be useful in identifying function, e.g. as in the case of bacterial operons. However, that approach has had limited value in the assignment of functions (and redox partners) with the Streptomyces coelicolor P450s (11). There is considerable substrate diversity in the human P450 2C subfamily, even among these four proteins with >80% sequence identity (3). Still another approach is a “metabolomics” one, involving an “unbiased” search in an extract of a tissue in which the enzyme is normally found (12, 13). Some results with the human P450s have been compiled (14, 15). It is also possible that a particular P450 may not have true endogenous substrates, e.g. have a role in a general protective mechanism against the toxic effects of xenobiotics (16).
One of the human P450s generally grouped under the heading of orphans is P450 2U1 (3, 15). In several reports the mRNA has been found to be preferentially expressed in thymus, brain, and several other tissues (17–19). Recently the expression of P450 2U1 (mRNA and protein) has also been reported in human platelets (20). Although the expression profiles are known in mice, rats, and humans, relatively little is known about any biological function of P450 2U1. A recombinant (baculovirus-infected insect cells) protein was demonstrated to catalyze ω- and ω-1 hydroxylation of several fatty acids (18).
In this report we expressed human P450 2U1 in Escherichia coli and utilized the purified enzyme in unbiased metabolomic searches with bovine brain extract. In addition to some fatty acids, we identified N-arachidonoylserotonin as a substrate (Fig. 1). N-Arachidonoylserotonin was originally studied as a synthetic molecule (21) designed to inhibit fatty acid amide hydrolase, an enzyme that hydrolyzes anandamide ligands of cannabinoid receptors (22). In 2011 N-arachidonoylserotonin was identified in hog and mouse intestine (23). We characterized the site of oxidation by P450 2U1 on the indole moiety of N-arachidonoylserotonin (Fig. 1) and found that this oxidation attenuated the fatty acid amide hydrolase inhibitory activity 4-fold. N-Arachidonoylserotonin was also identified in human brain. The localization of P450 2U1 in brain and the loss of the inhibitory function of N-arachidonoylserotonin following oxidation suggest possible roles in mammalian brain function.
FIGURE 1.
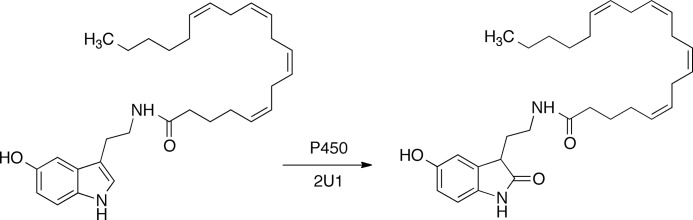
Structures of N-arachidonoylserotonin and 2-oxo-N-arachidonoylserotonin.
EXPERIMENTAL PROCEDURES
Chemicals
Arachidonic acid, N-arachidonoylserotonin, serotonin-HCl, and a fluorescence-based (coumarin derivative) fatty acid amide hydrolase inhibitor screening assay kit were purchased from Cayman Chemicals (Ann Arbor, MI). tert-Butyldimethylsilyl chloride was purchased from Oakwood Chemicals (West Columbia, SC). Tetrahydrofuran with butylated hydroxytoluene, added as stabilizer, was purchased from Sigma-Aldrich. l-α-1,2-Dilauroyl-sn-glycero-3-phosphocholine and serotonin-C were purchased from Sigma-Aldrich. Organic solvents for chromatographic and mass spectrometric methods were from Fisher.
Enzymes and Tissue Samples
Catalase (bovine liver), superoxide dismutase (bovine erythrocyte), and other reagents were purchased from Sigma-Aldrich. Catalase was dialyzed before use to remove the inhibitor thymol. Rat NADPH-P450 reductase was expressed in E. coli and purified as previously described (24). Cytochrome b5 (human) was expressed in E. coli and purified (25, 26).
Human liver samples (from organ donors) were obtained from Tennessee Donor Services and stored at −70 °C. Human brain samples were obtained through the Vanderbilt Ingram Cancer Center/Cooperative Human Tissue Network. Bovine brains (trimmed of meninges) were purchased from Pel-Freez (Rogers, AR).
Instrumentation
LC-MS separations (in untargeted metabolomics and stable isotope experiments) were performed with a Waters Acquity UPLC system in tandem with a Thermo LTQ XL mass spectrometer (Thermo Fisher). A Waters SYNAPT Q-TOF high resolution mass spectrometer was used for determination of accurate masses. A Bruker NMR spectrometer (600 MHz for 1H) with a 5-mm Z-gradient TCI cryo-probe was used to acquire spectra, and Topspin software was used to analyze the data.
Optimization of the P450 2U1 Nucleotide Sequence for Heterologous Expression and PCR-based Gene Synthesis
Codon optimization was performed for the whole coding sequence to improve the expression level in E. coli, and oligonucleotides were designed for PCR-based gene synthesis with DNAWorks 2.4 (27) as described previously (28, 29). A His6 tag was added to the C-terminal of the synthesized gene to facilitate purification. The optimized coding sequence was cloned into a “monocistronic” pCW vector (not coding for NADPH-cytochrome P450 reductase (30)) for expression.
Bacterial Expression of Human P450 2U1
The constructed plasmid and a plasmid containing the gene for the E. coli molecular chaperone GroEL/ES (31) were transformed into E. coli Top10 competent cells. Competent cells were incubated in super optimal broth medium with catabolite repression in a gyrorotary shaker (INFORS Multitron) for 1 h at 37 °C and 225 rpm and then transferred onto LB medium plates enriched with ampicillin (100 μg/ml) and kanamycin (50 μg/ml). Cells were grown overnight at 37 °C, and subsequently single colonies were used for preparing starting cultures in LB medium containing ampicillin and kanamycin.
Starting cultures were incubated overnight at 37 °C and 220 rpm in a gyrorotary shaker. For long term storage, 600 μl of bacterial starting culture was mixed with 300 μl of 50% glycerol (v/v) and stored at −80 °C. For preparation of a fresh overnight culture, 60 μl of a glycerol stock of E. coli cells was added into 300 ml of LB medium containing ampicillin (100 μg/ml) and kanamycin (50 μg/ml) that was incubated overnight in a gyrorotary shaker (see above) at 37 °C and 220 rpm. Large scale expression was done with 9 liters of Terrific Broth medium enriched with the previously mentioned antibiotics. Cultures were incubated at least for 4 h with gyrorotary shaking at 37 °C and 220 rpm, checked by measuring OD600. Expression of P450 2U1 was initiated by the addition of 1 mm isopropyl β-d-1-thiogalactopyranoside, 1 mm 5-aminolevulinic acid, and 6 mm arabinose (all added at OD600 0.8). Cultures were incubated for 24 h at 28 °C and 190 rpm, followed by determination of P450 concentration (32).
Purification of P450 2U1
Cells were harvested by centrifugation at 3,500 rpm (Sorvall RC3B centrifuge, H-6000A/HBB-6 rotor) for 10 min and recovered in 1 liter of TES buffer (0.10 m Tris acetate buffer, pH 7.4, containing 0.5 m sucrose, and 0.5 mm EDTA). Lysozyme was added (1.0 ml of a 1.0 mg/ml solution per 500-ml bottle), and the suspension of cells was incubated on ice for 30 min. The resulting spheroplasts were recovered by centrifugation at 3,500 rpm for 10 min (see above), and the pellet from each (1-liter) bottle was resuspended in 50 ml of sonication buffer (0.10 m potassium phosphate buffer, pH 7.4, 16% glycerol (v/v), 9 mm magnesium acetate, and 100 μm dithiothreitol (from a freshly dissolved stock)). Membranes containing P450 2U1 were solubilized with 25 mm CHAPS, with subsequent purification of enzyme using a Ni2+-nitrilotriacetic acid column (elution of enzyme with 200 mm imidazole). A typical yield of P450 2U1 enzyme was 350 nmol (from 9 liters of culture). P450 concentrations were estimated spectrally using the method of Omura and Sato (32) (Fig. 2).
FIGURE 2.
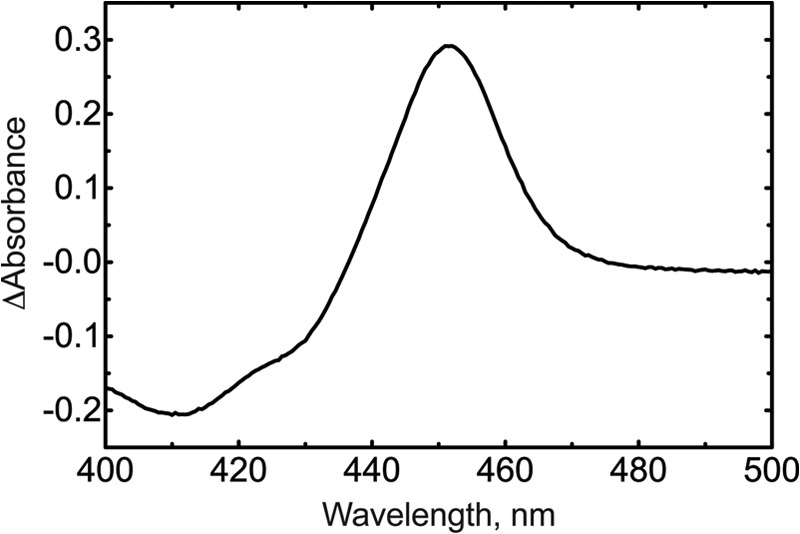
Reduced ferrous-CO versus ferrous difference spectrum of purified recombinant P450 2U1. The calculated P450 concentration was 3.0 μm (32).
Proteomic Analysis of Purified P450 2U1
Purified P450 2U1 samples (1 μg of protein loaded onto gel) were separated by SDS-polyacrylamide gel electrophoresis (7.5%, w/v) (33). The gel was stained using a sensitive Blue Silver staining protocol (34), and the two major gel bands (Fig. 3) were subjected to proteomic analysis in the Vanderbilt facility. Fragments of peptides obtained with tandem mass spectrometry proteomic techniques were compared with those peptides for P450 2U1 included in the SEQUEST database (Fig. 4). Edman N-terminal analysis was done by Jodie Franklin in the Synthesis and Sequence Facility at Johns Hopkins University (Baltimore, MD) (see Table 1 and Fig. 2B).
FIGURE 3.

P450 2U1 N-terminal peptides identified by Edman degradation. A, preparative SDS-polyacrylamide gel of P450 2U1 protein. Electrophoresis consistently showed two protein bands, marked with arrows on the right side (direction of migration, top to bottom). Colloidal Coomassie Blue staining (1 μg of protein applied to gel) was used, and the indicated bands were excised and submitted to proteomic analysis. B, repetitive yields of amino acids recovered in Edman degradation cycles. The yields were fit to semilogarithmic plots. C, assignments. Residues 2–10 are from the upper SDS gel band. Peptides 34–44, 36–46, and 43–53 are from the lower SDS gel band.
FIGURE 4.
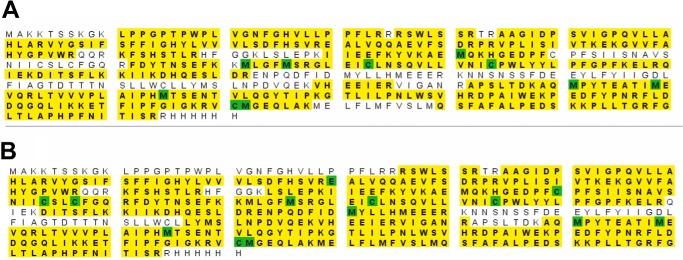
Proteomic analysis of upper and lower protein bands of the P450 2U1. The yellow shading shows the peptides that were identified in each protein band (Fig. 3A). The Cys and Met residues are shaded green to indicate that these residues were purposely oxidized in the protein workup. A, from upper band. B, from lower band.
TABLE 1.
Edman degradation of the upper and lower bands of a P450 2U1 preparation
The values in parentheses indicate that a residue was assigned to two peptides. For the upper band (Fig. 3), the expected N-terminal Met is shown but was not observed in cycle 1; however, Ala was observed.
| Recovered (pmol) |
||||||
|---|---|---|---|---|---|---|
| Upper band | Lower band (three peptides) |
|||||
| 1 | 2 | 3 | ||||
| (Met) | Cycle 1 | Arg 13.7 | Ala 11.3 | Ser 9.8 | ||
| Cycle 1 | Ala | 14.5 | Cycle 2 | Arg 15.6 | Ala 11.7 | Trp 7.4 |
| Cycle 2 | Lys | 19.3 | Cycle 3 | Ser 11.4 | Gly 10.7 | Leu 10.9 |
| Cycle 3 | Lys | 19.3 | Cycle 4 | Trp 9.4 | Ile 13.0 | Ser 9.5 |
| Cycle 4 | Thr | 12.2 | Cycle 5 | Leu 14.5 | Asp 6.7 | Ser 9.6 |
| Cycle 5 | Ser | 9.1 | Cycle 6 | Ser 10.7 | Pro 12.2 | Arg 10.4 |
| Cycle 6 | Ser | 9.1 | Cycle 7 | Ser (11.9) | Ser (11.9) | Thr 9.8 |
| Cycle 7 | Lys | 10.6 | Cycle 8 | Arg (11.6) | Val 10.3 | Arg (11.6) |
| Cycle 8 | Gly | 10.3 | Cycle 9 | Thr 11.4 | Ile 12.2 | Ala 9.1 |
| Cycle 9 | Lys | 9.6 | Cycle 10 | Arg 11.1 | Gly 10.5 | Ala 9.8 |
| Cycle 11 | Ala 11.2 | Pro 11.3 | Gly 10.3 | |||
Tissue Extracts Preparation
Human liver extracts were prepared as previously described (35). Human brain tissue samples (0.6 g) from four different donors were homogenized in 12 ml of a CHCl3/CH3OH mixture (2:1, v/v), stirred for 30 min at 23 °C, and filtered through filter paper. The resulting extract was mixed with 0.2 volume of deionized H2O and centrifuged for 20 min at 7,000 × g. The organic layer was collected, evaporated under a stream of nitrogen, and immediately purged with argon and stored at −70 °C. On the day of use, samples were reconstituted in 2 ml of C2H5OH and sonicated 3 × 30 s. The same procedure was used for preparation of bovine brain tissue extracts, on a larger scale.
Oxidation of Arachidonic Acid by P450 2U1
Incubations with arachidonic acid were performed in 100 μl of 100 mm Tris-HCl buffer (pH 7.4) with 0.3 μm purified P450 2U1, 3 μm NADPH-P450 reductase, 75 μm l-α-1,2-dilauroyl-sn-glycero-3-phosphocholine, 10 mm MgCl2, 10 mm isocitrate, 0.2 unit ml−1 isocitrate dehydrogenase, and 50 μm [1-14C]arachidonic acid (58 mCi mmol−1). In some cases E. coli-expressed recombinant human cytochrome b5 (0.3 or 1.0 μm) was included. The enzyme reaction was initialized by the addition of 1 mm NADPH. Samples were then incubated for 30 min at 37 °C in a shaking water bath. Reactions were stopped by the addition of 100 μl of CH3CN containing 0.2% CH3CO2H (v/v) and 0.005% butylated hydroxytoluene (w/v), followed by mixing with a vortex device and centrifugation at 1.5 × 10⁴ × g for 10 min. The supernatant (175 μl) was injected onto a Varian octadecylsilane (C18) column (4.6 mm × 160 mm) at 23 °C, with a flow rate of 0.8 ml min−1. Products were separated with a gradient of mobile phase A (H2O and 0.1% CH3CO2H, v/v) and mobile phase B (CH3CN and 0.1% CH3CO2H, v/v). Gradient conditions were as follows: 50% mobile phase B (v/v), with a linear gradient increasing to 100% mobile phase B over the next 40 min, held for 5 min, and then returned back to initial conditions over 5 min followed by column equilibration for 10 min.
LC-MS Metabolomic Experiments
In vitro incubation of purified P450 2U1 with tissue extracts (human liver or bovine brain) was performed in 1.0 ml of 100 mm potassium phosphate buffer (pH 7.4). Each reaction mixture contained 1 μm purified enzyme, 2 μm NADPH-P450 reductase, 150 μm l-α-1,2-dilauroyl-sn-glycero-3-phosphocholine, and 1% (v/v) ethanolic solution of a tissue extract (equivalent to 10 mg of tissue). For longer incubation times (>20 min), catalase (100 units per reaction mixture) was added to each test tube (to prevent degradation by H2O2) (36). The enzymatic reaction was started by the addition of 100 μl of an NADPH-generating system including 100 μl of 100 mm glucose 6-phosphate, 50 μl of 10 mm NADP+, and 2 μl of a 1 mg ml−1 solution of yeast glucose 6-phosphate dehydrogenase (37). Samples were then incubated for 2 h at 37 °C. Reactions were stopped by the addition of 2 ml of CH2Cl2, followed by mixing for 1 min with a vortex device and centrifugation at 2,000 × g for 10 min. The lower organic layer was carefully removed and evaporated under a stream of nitrogen. Samples were reconstituted in 100 μl of C2H5OH, transferred into vials, and subjected to LC-MS analysis. LC separations were performed with a Waters Acquity UPLC system (Waters, Milford, MA) and an Acquity BEH octadecylsilane (C18) column (1.7 μm, 2.1 mm × 100 mm) at 35 °C with a flow rate of 0.3 ml min−1. Samples (20 μl) were injected into the system in the full-loop mode and were separated with a gradient. For detection of analytes using a linear ion trap mass spectrometer (LTQ XL; Thermo Fisher) with electrospray ionization or atmospheric pressure chemical ionization (APCI),3 both positive and negative modes were used with mobile phase A, consisting of 10 mm NH4CH3CO2 in a 5:95 (v/v) mixture of CH3CN and H2O (v/v), and mobile phase B, consisting of 10 mm NH4CH3CO2 in a 95:5 (v/v) mixture of CH3CN and H2O (v/v). Separation of analytes (in case of the APCI mode) was performed using a gradient of mobile phase A, consisting of 0.1% HCO2H (v/v) in a 5:95 mixture (v/v) of CH3CN and H2O, and mobile phase B, consisting of 0.1% HCO2H (v/v) in a 95:5 mixture of (v/v) of CH3CN and H2O. Gradient conditions were set up as follows: 0–2 min, 5% mobile phase B (v/v), a linear gradient of mobile phase B increasing over 20 min to 100%, held for 5 min, and then returned back to the initial condition with column equilibration for an additional 5 min. MS spectra were obtained in the APCI+ mode with the following tune settings: discharge voltage, 3.9 kV; vaporizer temperature, 450 °C; sheath gas flow rate, 50 arbitrary units; auxiliary gas flow rate, 5 arbitrary units; sweep gas flow rate, 5 arbitrary units; capillary voltage, 22 V; and capillary temperature, 275 °C.
Isotopic Labeling Experiments
A method for 16O2/18O2 isotopic experiments was adapted from previous studies (13, 35). Thunberg tubes including reaction mixtures (as described under “LC-MS Metabolomic Experiments”) were charged (following 10 alternating cycles of vacuum and argon) separately with 100% 16O2 and 97% 18O2, and the two samples were mixed together before extraction. Reaction mixtures charged with 100% 16O2 served as control samples. Samples were analyzed with the same LC-MS methods as in the case of metabolomics experiments with tissue extracts.
Data Analysis
Data obtained from experiments with human liver tissue or bovine brain tissue extracts were evaluated with the metabolomics software XCMS working in R statistical language, which has been previously used for analysis of endogenous and exogenous metabolites in human serum (38). Other metabolomics data mining software was also used, e.g. MZmine (39) and an in-house Matlab program (14) for doublet searches (M, M + 2) in the case of 18O-based isotopic labeling experiments. MZmine2 (40) serves as a high performance tool in differential analysis of data from multiple LC-MS experiments, enabling noise filtering, peak detection, and retention time (tR) alignment for corresponding peaks from different runs (40). After chromatogram construction and deconvolution in the MZmine2 program, the centroid data were displayed as a peak list, which included m/z values, retention time, duration, and peak height of individual peaks. The peak list was copied to an Excel file and exported as a CSV (comma separated values) file. An in-house Matlab program was used to extract peak information from the CSV file and in searches for 18O/16O doublet patterns (14).
Incubation of P450s (2U1, 2W1, and 4A11) with the Substrate N-Arachidonoylserotonin
Reaction mixtures were prepared as described under “LC-MS Metabolomic Experiments” except that bovine superoxide dismutase (100 units/reaction mixture) was added together with bovine erythrocyte catalase (100 units/reaction mixture) to the mixture to remove reactive oxygen species formed during incubations. Samples were incubated for 50 min and then treated as described above. The concentration of N-arachidonoylserotonin in the reaction mixtures was 100 μm. In the case of experiments with P450 4A11, dithiothreitol (1 mm), and (E. coli recombinant) human cytochrome b5 were added to individual samples to support enzymatic activity (41). Potential metabolites of N-arachidonoylserotonin were analyzed in the APCI+ mode.
Purification and Identification of N-Arachidonoylserotonin Oxidation Product: Large Scale Incubation
To elucidate the structure of the N-arachidonoylserotonin oxidation product found in the isotope-labeling experiments, a larger reaction mixture was prepared to obtain more of the product for NMR analysis. Large scale incubation of purified P450 2U1 with N-arachidonoylserotonin was performed in 50 ml of 100 mm potassium phosphate buffer (pH 7.4) containing 100 nmol of purified P450 2U1, 200 nmol of NADPH-P450 reductase, 15 μm l-α-1,2-dilauroyl-sn-glycero-3-phosphocholine, 150 μm N-arachidonoylserotonin, and 100 units each of catalase and superoxide dismutase (to prevent formation of reactive oxygen species). The enzymatic reaction was started by the addition of 15 ml of an NADPH-generating system including 10 ml of 100 mm glucose 6-phosphate, 5 ml of 10 mm NADP+, and 100 μl of a 1 mg ml−1 solution of yeast glucose 6-phosphate. The reaction was run for 1.5 h. The reaction was terminated by the addition of a 2-fold volume of CH2Cl2 (100 ml), the products were extracted an additional three times with an equal volume of CH2Cl2 (50 ml), and the organic layers were combined and concentrated in vacuo. Samples were reconstituted in a small volume of C2H5OH, and fractions containing the main products formed from N-arachidonoylserotonin were collected from HPLC, monitored using UV detection (A254). Fractions containing the N-arachidonoylserotonin product were combined, concentrated under a stream of nitrogen, and stored under argon at −80 °C. Samples were analyzed with use of LC-MS (tR, mass spectra, fragmentation patterns). Frozen samples were redissolved in CD2Cl2 for NMR experiments (Bruker NMR 600 MHz spectrometer).
Targeted Search for N-Arachidonoylserotonin in Human Brain Tissue
Human benign brain tumor tissues were homogenized and followed by Folch extraction (CHCl3/CH3OH, 2:1, v/v), and the resulting extracts were combined, concentrated under a stream of nitrogen, reconstituted in C2H5OH, and analyzed for the presence of N-arachidonoylserotonin using LC-MS (APCI+) under the same conditions described (see above).
Inhibition of Fatty Acid Amide Hydrolase
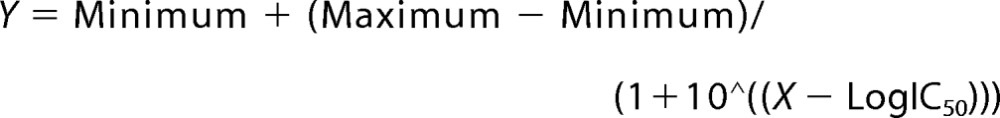
A fatty acid amide hydrolase inhibitor screening assay kit was used with the protocol described by the manufacturer (Cayman). The data were analyzed using GraphPad Prism (version 5.0a), with the IC50 value calculated using the following equation.
 |
RESULTS
Heterologous Expression of E. coli Recombinant P450 2U1 and Purification
An optimal expression level for P450 2U1 (400 nmol liter−1) was achieved with E. coli top 10 cells co-expressed with a chaperone protein. Purified P450 2U1 gave a typical 450-nm band in the usual ferrous-CO versus ferrous difference spectrum (Fig. 2).
SDS-polyacrylamide gel electrophoresis consistently showed two protein bands in the expected Mr migration region (Fig. 3A). Both bands were cut from a gel, subjected to trypsin digestion, and analyzed by LC-MS in the Vanderbilt Proteomics Facility (Fig. 4). The upper band showed 72% coverage of the expected peptides, and the lower band showed 80% (the first residue identified was 36). The upper band showed additional peptides in the N terminus (residues 20–44 of expected protein) that were not present in the lower band. However, the upper band did not show a peptide including the entire N terminus.
To resolve the issue of which of the protein bands contained P450 2U1, both electrophoretic bands were excised and submitted for Edman N-terminal degradation (amino acid sequencing) (Table 1 and Fig. 3B). The upper band clearly confirmed residues 2–10 of the predicted sequence (Table 1, yields varying from 9.6 to 19.3 pmol). The removal of the N-terminal Met is expected in light of the known specificity of bacterial N-terminal processing (42). The lower band was characterized as a mixture of three polypeptides (Fig. 3C) (in all three cases 11 residues could be identified, with yields varying from 7.4 to 15.6 pmol). The proteolytic cleavage occurred even in the presence of protease inhibitors, under conditions in which other mammalian P450s have generally not shown any cleavage (43).
Oxidation of Arachidonic Acid by P450 2U1
P450 2U1 oxidized arachidonic acid to a roughly equimolar mixture of the 19- and 20-hydroxy products (Fig. 5). The rate was 19 (± 5) pmol (total) product formed min−1 (nmol P450 2U1)−1. The rate was not changed in the presence of either an equimolar concentration of or 3.3-fold excess of cytochrome b5.
FIGURE 5.
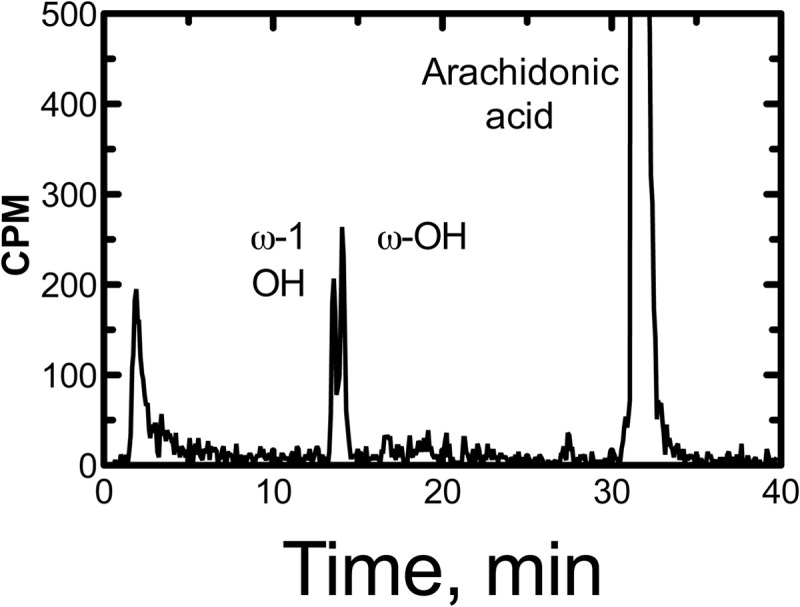
HPLC radiochromatogram for oxidation of [1-14C]arachidonic acid by P450 2U1. The ω- and ω-1 hydroxylation products and the residual substrate are labeled. The nature of the radioactivity eluting at the void volume is unknown.
Metabolomic Searches for P450 2U1 Reactions in Bovine Brain
To search for novel endogenous substrates for the P450 2U1 enzyme, the recombinant enzyme was incubated with a tissue extract of bovine brain because of its higher expression in certain parts (cortex, limbic system, and cerebellum) (17, 18). Untargeted analysis using the program XCMS (44, 45) to compare enzymatic and nonenzymatic incubations only identified fatty acids that had been already reported to be substrates for P450 2U1, including arachidonic acid (mono- and dihydroxylation, m/z 319 and 336) and docosahexaenoic acid (mono- and dihydroxylation, m/z 343 and 359). The same results were obtained with human liver extracts.
On the other hand, the incubation of bovine brain extract and P450 2U1 with 16O2 and 18O2/16O2 (doublet search) (14) resulted in formation of a doublet, with m/z 479/481 (Fig. 6). High resolution mass spectrometry analysis for the sample from the doublet search (m/z 479.3221, tentatively C30H42N2O2, calculated 479.3268) followed by a lipidomics database search (LIPIDMAPS) showed that the doublet could possibly be assigned to an oxygenated product of N-arachidonoylserotonin.
FIGURE 6.

LC-MS chromatograms from a bovine brain doublet search experiment. A, sample derived from brain tissue extract, NADPH-generating system, and inactivated P450 2U1 enzyme. B, sample generated with P450 2U1 incubated in an 16O2 atmosphere. C, sample from two reaction mixtures, incubated either with 16O2 or 18O2, combined together. m/z 479 (1-O atom addition to N-arachidonoylserotonin) was monitored in each case.
In a separate experiment, we identified N-arachidonoylserotonin in bovine brain extract, using LC-MS selective ion monitoring (m/z 463) and coincidence with a commercial sample (tR 9.78 min; data not shown). Incubation of commercial N-arachidonylserotonin with P450 2U1 yielded the same product detected in the brain extract incubation (Fig. 7, tR 16.6 min), and product formation was not attenuated in the presence of catalase and superoxide dismutase (data not presented). In addition, N-arachidonylserotonin was found in human brain samples, utilizing LC-MS selective ion monitoring (data not presented).
FIGURE 7.
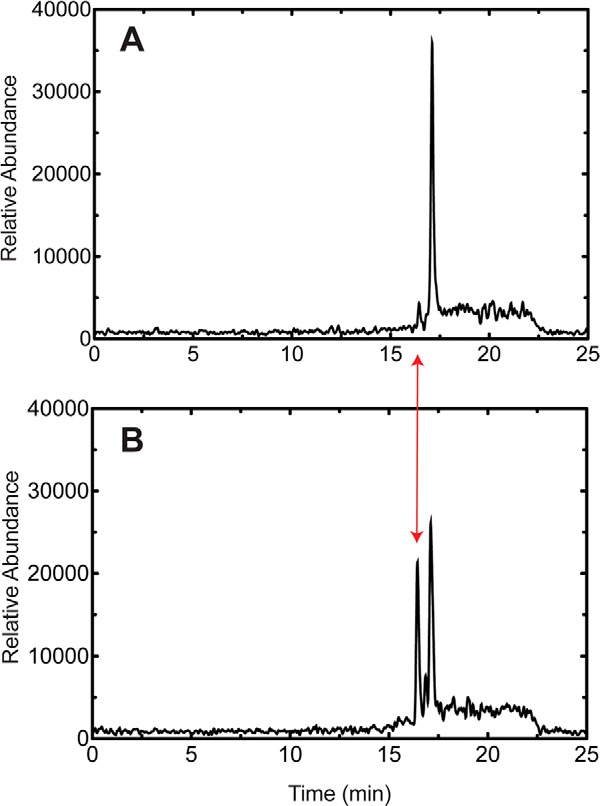
2-Oxygenation of N-arachidonoylserotonin by P450 2U1. A, minus P450 2U1. B, plus P450 2U1. The scales are identical, and the tR of 2-oxo-N-arachidonoylserotonin is marked with the double-headed red arrow. The m/z 479 peak in the blank reaction (A) appeared at the position of N-arachidonoylserotonin and is attributed to a solvent adduct (+16), as revealed by fragmentation. The peak eluted at tR 16.8 min in B was not identified.
P450 2U1, as isolated, appeared to be largely in the low spin iron configuration (Soret λmax at 418 nm; data not presented). The addition of N-arachidonoylserotonin resulted in a “reverse type I” (46) difference spectrum (Fig. 8).
FIGURE 8.
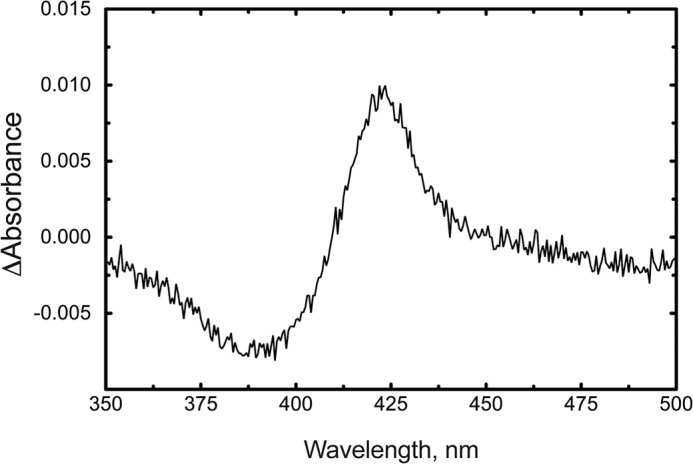
Binding of N-arachidonoylserotonin to P450 2U1. Each of two 1-ml cuvettes contained 3.0 μm P450 2U1. A baseline was recorded, and 6 μm N-arachidonoylserotonin was added to the sample cuvette, prior to rescanning.
P450 2U1 Oxygenation Occurs at the Indole 2-Position
Based on the fragmentation in mass spectral analysis (MS/MS), oxygen addition was suggested to occur on the indole ring (Fig. 9). Fragmentation spectra of the product formed in the presence P450 2U1 showed formation of a unique fragment with m/z 193, which was absent in the fragmentation spectra of the substrate, and the product formed in the presence of P450 2W1 or 4A11. (The major products formed with these latter two P450s also showed shorter tR values, distinct from each other (data not presented). We have not elucidated their identities yet.) More detailed analysis of the MS/MS spectrum of the parent compound and the P450 2W1 and 4A11 products revealed a fragment with m/z 177, which was assigned to the intact serotonin moiety; thus, the m/z 193 (177 + 16 (O)) fragment indicated oxidation in the serotonin part of the product.
FIGURE 9.

LC-MS (APCI+) fragmentation patterns of N-arachidonoylserotonin products formed in the presence of either P450 2U1 or P450 2W1 and comparison with the fragmentation spectrum of the substrate. The fragment with m/z 193 shows the presence of an additional oxygen moiety in the indole moiety of N-arachidonoylserotonin. A, P450 2U1 reaction product; B, P450 2W1 reaction product; C, substrate.
Although the isolated major product purified from the incubation by HPLC did not yield a completely pure compound (because of decomposition; see below), a tentative structure was deduced from one- and two-dimensional proton 1H NMR spectra (Fig. 10). Preliminary 1H NMR data obtained with the isolated major product of N-arachidonoylserotonin suggested oxidation at the 2-position to form 2-oxo-N-arachidonoylserotonin. Because the oxidation had been shown to occur in the indole ring based on the MS fragmentation (see above), the focus of the NMR data analysis of the product was in the aromatic region (δ 6–8 ppm) of the 1H NMR spectrum (CD2Cl2, referenced at 5.32 ppm, was used as the NMR solvent). The splitting pattern in this region indicated a doublet (d) at δH 6.60 ppm (J = 8 Hz), a d at δH 7.28 ppm; J = 2 Hz), and a dd pattern at δH 7.06 ppm (J = 8 and 2 Hz). Another set of distinct protons was observed with splitting patterns of d (δH 7.48 ppm; J = 9 Hz) and a dd (δH 7.16 ppm; J = 9 and 2 Hz) (Fig. 8A). This splitting pattern was indicative of oxygenation at the 2 position. Although there were two sets of these protons in the one-dimensional 1H NMR, the two-dimensional NMR data (1H-1H COSY) confirmed the coupling partners of the d at δH 6.60 ppm and dd at δH 7.06 ppm (the other set of d at δH 7.48 ppm and dd at δH 7.16 ppm showed a COSY correlation as well) (Fig. 10B). The duplicate sets of the protons suggested possible dimerization of the product, presumably because of decomposition during the extraction, purification, or concentration processes used with the compound.
FIGURE 10.

1H NMR spectrum of the aromatic region (δ 6–8 ppm) of the HPLC-purified product from a P450 2U1 incubation with N-arachidonoylserotonin. Proton numbering of the indole ring is indicated. A, one-dimensional spectrum. B, two-dimensional COSY spectrum.
2-Oxo-N-arachidonoylserotonin was synthesized in a six-step chemical reaction sequence and characterized by its NMR and mass spectra (supplemental Figs. S1–S3). This synthetic standard and the product from an enzymatic incubation of P450 2U1 with N-arachidonoylserotonin both eluted at same tR, 16.49 and 16.44 min, respectively (within experimental error), under the same conditions. The collision-induced dissociation fragmentation patterns were compared in MS/MS analysis (Fig. 11), and the product from the enzymatic reaction gave the same fragmentation pattern as the synthetic standard. Further, high resolution mass spectrometry showed the synthetic standard with the parent ion at m/z 479.3257, which matched m/z 479.3256 for the enzymatic product (both Δ 2.3 ppm from 479.3268 calculated for C30H42N2O2). These results clearly showed that P450 2U1 oxidized N-arachidonoylserotonin to 2-oxo-N-arachidonoylserotonin.
FIGURE 11.
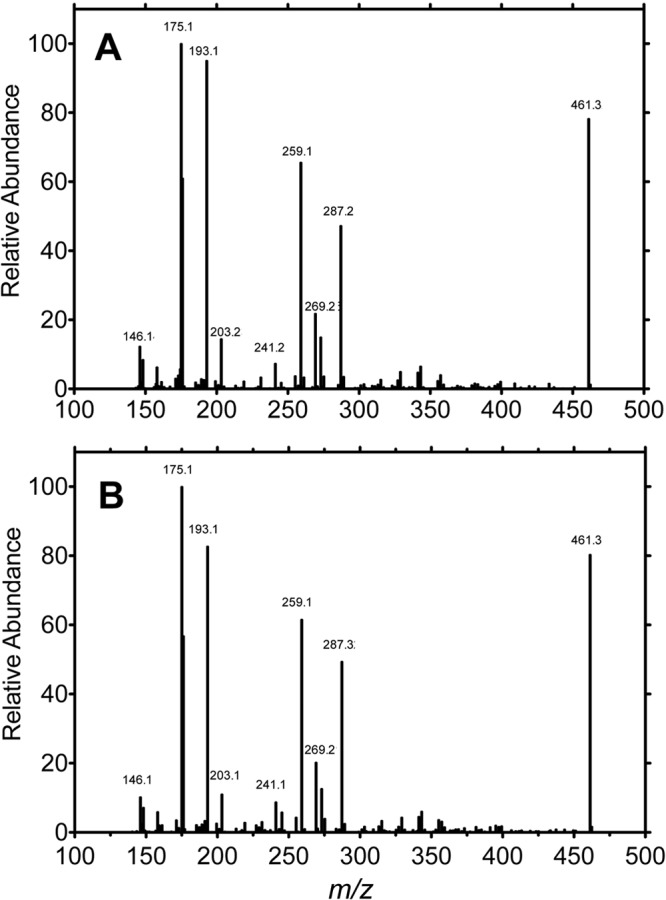
Mass fragmentation patterns A, synthetic 2-oxo-N-arachidonoylserotonin B, product of oxidation of N-arachidonoylserotonin by P450 2U1. An APCI+ source was used.
Rate of P450 2U1 Oxidation of N-Arachidonoylserotonin
P450 2U1 oxidized N-arachidonoylserotonin to the 2-oxo product, and the kinetic parameters were determined using LC-MS with the synthetic material as an external standard (Fig. 12). The kcat was 32 ± 9 pmol product formed min−1 (nmol P450 2U1)−1, and the Km was 82 ± 2 μm.
FIGURE 12.
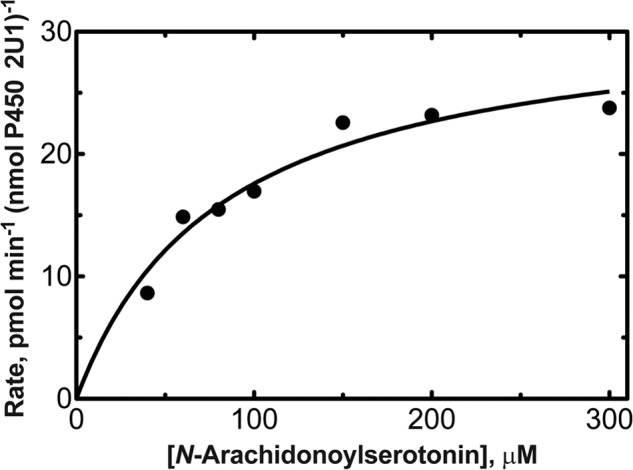
Steady-state kinetic analysis of oxidation of N-arachidonoylserotonin to 2-oxo-N-arachidonoylserotonin by P450 2U1. kcat 32 (± 9) pmol product formed min−1 (nmol P450 2U1)−1; Km = 82 ± 2 μm.
Inhibition of Fatty Acid Amide Hydrolase
An IC50 value of 14 ± 1 μm was measured with N-arachidonoylserotonin (Fig. 13), nearly identical to that reported earlier (21). The IC50 of 2-oxo-N-arachidonoylserotonin in the same system was 47 ± 5 μm.
FIGURE 13.
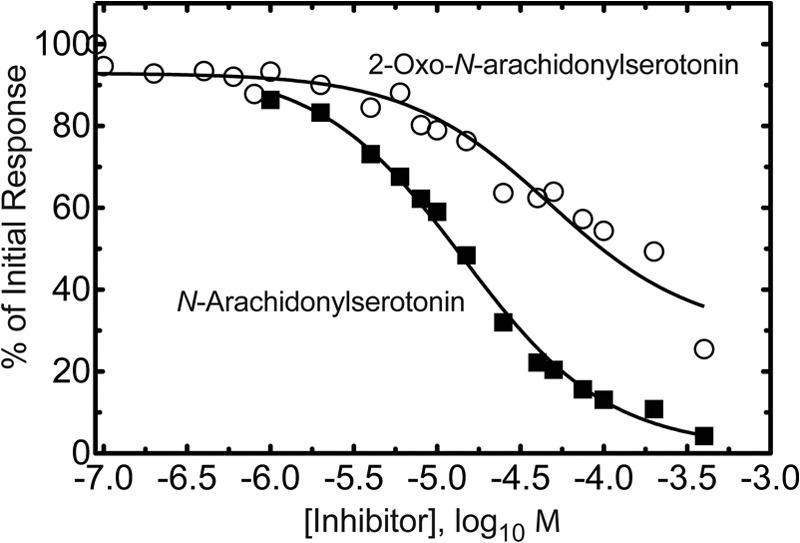
Inhibition of fatty acid amide hydrolase by synthetic N-arachidonoylserotonin and 2-oxo-N-arachidonoylserotonin. The IC50 for N-arachidonoylserotonin was 14 ± 1 μm. The IC50 for 2-oxo-N-arachidonoylserotonin was 47 ± 5 μm.
DISCUSSION
P450 2U1 was first identified in 2004 through searches of the human genome (17). The closest human relatives are P450s 2R1 (37% identity) and 2J2 (36% identity). mRNA studies in humans, mice, and rats consistently show the highest expression in thymus followed by brain and heart (17–19). In rats, the protein is preferentially expressed in the brain (17). In rats, the highest level of immunodetectable P450 2U1 was found in the brain, followed by the thymus (17). However, the level of mRNA was similar in rat thymus and brain (17). In humans, the level of P450 2U1 mRNA was >10-fold higher in thymus compared with brain (18, 19), but protein levels have not been reported. In rat brain, P450 2U1 protein expression was highest in limbic structures and cortex (and also found in cerebellum, olfactory bulbs, and pons and medulla) (17). In human brain a high level of P450 2U1 mRNA has been reported in cerebellum (18). On the basis of work in zebrafish, Goldstone et al. (47) have proposed that P450 2U1 has a pre-vertebrate origin and that P450 2U is the oldest P450 subfamily. Relatively little is known about the regulation of P450 2U1, but in mouse liver, mRNA levels are attenuated by Nrf2 activation (48).
Recombinant P450 2U1 has been expressed in human embryonic kidney (HEK 293) cells (17) and in baculovirus-infected Sf9 insect cells (18), but the only substrates identified were long chain fatty acids (18), hydroxylated at the ω- and ω-1 positions. However, no rates were reported in that work. We also found that E. coli recombinant human P450 2U1 catalyzed these reactions with arachidonic acid, at relatively low but significant rates, yielding these two products (Fig. 5). Indirect evidence has recently suggested that P450 2U1 catalyzes these reactions with arachidonic acid in platelets (20).
Because of the conservation of P450 2U1 in numerous species and expression of the enzyme in brain, we utilized bovine brain extracts in a metabolomic search for substrates and products of human P450 2U1. As expected, fatty acids were found as substrates of P450 2U1 with the use of an untargeted metabolomics approach, confirming the results of Chuang et al. (18). Some other candidates were also identified, and one met several criteria, i.e. reproducibility, correct isotopic signature, and absence in controls (Fig. 6). The substrate was identified as N-arachidonoylserotonin by high resolution mass spectrometry of the product and co-chromatography of the product with that generated from a commercial standard. Although ω- and ω-1 hydroxylation might be have been suggested, based on the fatty acid work (18) (Fig. 5), the oxidation site was judged not to be on the fatty acid chain as judged by MS fragmentation analysis. Subsequent 1H NMR analysis and chemical synthesis confirmed the site of oxidation as C-2 of the indole ring (Figs. 10 and 11). This is a reaction analogous to that of P450 2E1 and some other P450s with indole (49) and can be envisioned as hydroxylation followed by tautomerization. Because of the nature of the reaction, we considered melatonin as a possible substrate (50). However, we did not see consistent oxidation, and when products were observed in some reactions, they were sensitive to the inclusion of catalase in the reaction, supporting the view that they were formed by the action of H2O2 adventitiously produced in the P450 2U1 reaction.
Fatty acids are known to be hydroxylated by P450s at the ω-carbon and the ω-1, -2, and -3 positions (3, 51, 52). However, midchain hydroxylations (14) and α- and β-hydroxylations (53, 54) are also known. We found that P450 2U1 yielded a reverse type I difference spectrum (46), generally considered to indicate a change in the iron spin state (from high to low spin), because of an increase in the occupancy of H2O as the distal ligand. With P450 2U1, the iron was largely in the low spin state in the isolated protein (λmax 418 nm), so the transition must result from a small population of the protein. The difference spectrum (Fig. 8) is not a typical type II spectrum (46) indicative of nitrogen atom binding to iron. We did not observe a type I change when arachidonic acid (50 μm) was added to P450 2U1 (data not presented). The difference between the binding spectra of arachidonic acid and N-arachidonoylserotonin may reflect the different regioselectivity of oxidation of a fatty acid and its amide conjugate.
N-Arachidonoylserotonin was first reported in 1998 as a synthetic inhibitor of fatty acid amide hydrolase, an enzyme that hydrolyzes anandamide agonists of cannabinoid receptors (21), being the most active of a series of compounds (IC50 12 μm). Subsequently N-arachidonoylserotonin has been characterized in terms of its analgesic actions, with antagonistic activity at vanilloid TRPV1 receptors, with an IC50 of 37–40 nm (55). N-Arachidonoylserotonin also inhibited T-type calcium channels with IC50 values between 50 and 250 nm (56). Of a series of arachidonoyl endocannabinoids tested, N-arachidonoylserotonin preferentially inhibited the release of β-hexosaminidase (a marker of degranulation) and tumor necrosis factor-α (a pro-inflammatory cytokine) in immunoglobulin E-activated RBL-243 cells (57). In addition, N-arachidonoylserotonin suppressed the formation of prostaglandin D2 (IC50 1.3 μm) and leukotriene B4 (IC50 1.2 μm). The anti-allergic action of N-arachidonoylserotonin was attributed to suppression of the activation of several factors, including Syk, LAT, p38, JNK, PI3K, and Akt (57). The Km value of P450 2U1 for N-arachidonoylserotonin 2-oxidation is high (Fig. 12), and the contribution to the 2-oxygenation in vivo is unknown. However, many enzymes with high Km values are functional, e.g. catalase (58).
In 2011 N-arachidonoylserotonin was identified in biological systems, i.e. hog and mouse intestine, in the nanomolar range (23). We have now identified this compound in bovine and human brain tissue. The IC50 value for inhibiting fatty acid amide hydrolase increased 4-fold following 2-oxygenation (Fig. 11); we have not determined the effect on the other reported biological activities but suggest that they are probably also attenuated. Thus, a function of P450 2U1 might be to down-regulate the biological activities of endogenous N-arachidonoylserotonin. We are not aware of any information about how this molecule is synthesized; presumably it is formed from the enzymatic reaction of arachidonoyl CoA with serotonin (anandamide (N-arachidonoylethanolamine) arises from degradation of a phosphatidylethanolamine (59)).
We have not determined whether the proteolytic fragments derived from P450 2U1 are catalytically active. The ferrous-CO versus ferrous difference spectra (e.g. Fig. 2) consistently showed little evidence of (inactive) cytochrome P420, so the fragments (Figs. 3 and 4) may well contain spectrally defined P450. We suspect that they are not active but have based all calculations of activity on the total amount of spectrally detectable P450. As indicated earlier, the repeated proteolytic cleavage of a mammalian P450 expressed in E. coli was unexpected (60, 61).
As indicated earlier, we used several metabolomic search modes with P450 2U1 and pursued what was found to be N-arachidonoylserotonin. However, further searches may be of interest, especially using thymus as a source (18).
In conclusion, we have utilized a metabolomics approach to identifying substrates for the orphan P450 2U1. The substrate N-arachidonoylserotonin was found in brain and shown to be converted to the C-2 oxidation product, which was shown to have attenuated biological activity. The significance of these findings remains to be determined in vivo.
Acknowledgments
We thank Dr. D. F. Stec for help with setting up COSY NMR parameters and K. Trisler for assistance in preparation of the manuscript.
This work was partially supported by United States Public Health Service Grants R37 CA090426 and P30 ES000267 and Czech Republic Projects CZ.1.05/2.1.00/01.0030 (Biomedicine for Development and Human Resources) and CZ.1.07/2.4.00/17.0015 (TransMedChem).

This article contains supplemental Figs. S1–S3.
- APCI
- atmospheric pressure chemical ionization
- d
- doublet (1H NMR).
REFERENCES
- 1. Ortiz de Montellano P. R. (ed.) (2005) Cytochrome P450: Structure, Mechanism, and Biochemistry, 3rd Ed., Kluwer Academic/Plenum Publishers, New York [Google Scholar]
- 2. Coon M. J. (2005) Cytochrome P450: nature's most versatile biological catalyst. Annu. Rev. Pharmacol. Toxicol. 45, 1–25 [DOI] [PubMed] [Google Scholar]
- 3. Guengerich F. P. (2005) Human cytochrome P450 enzymes. In Cytochrome P450: Structure, Mechanism, and Biochemistry, 3rd Ed., Ortiz de Montellano P. R. (ed), pp. 377–530, Kluwer Academic/Plenum Publishers, New York [Google Scholar]
- 4. Mast N., Norcross R., Andersson U., Shou M., Nakayama K., Bjorkhem I., Pikuleva I. A. (2003) Broad substrate specificity of human cytochrome P450 46A1 which initiates cholesterol degradation in the brain. Biochemistry 42, 14284–14292 [DOI] [PubMed] [Google Scholar]
- 5. Mast N., Charvet C., Pikuleva I. A., Stout C. D. (2010) Structural basis of drug binding to CYP46A1, an enzyme that controls cholesterol turnover in the brain. J. Biol. Chem. 285, 31783–31795 [DOI] [PMC free article] [PubMed] [Google Scholar]
- 6. Guengerich F. P., Tang Z., Salamanca-Pinzón S. G., Cheng Q. (2010) Characterizing proteins of unknown function: orphan cytochrome P450 enzymes as a paradigm. Mol. Interv. 10, 153–163 [DOI] [PMC free article] [PubMed] [Google Scholar]
- 7. Mangelsdorf D. J., Evans R. M. (1995) The RXR heterodimers and orphan receptors. Cell 83, 841–850 [DOI] [PubMed] [Google Scholar]
- 8. Hanson A. D., Pribat A., Waller J. C., de Crécy-Lagard V. (2010) “Unknown” proteins and “orphan” enzymes: the missing half of the engineering parts list-and how to find it. Biochem. J. 425, 1–11 [DOI] [PMC free article] [PubMed] [Google Scholar]
- 9. Johnson E. F., Stout C. D. (2013) Structural diversity of eukaryotic membrane cytochrome P450s. J. Biol. Chem. 288, 17082–17090 [DOI] [PMC free article] [PubMed] [Google Scholar]
- 10. Gerlt J. A., Babbitt P. C., Jacobson M. P., Almo S. C. (2012) Divergent evolution in enolase superfamily: strategies for assigning functions. J. Biol. Chem. 287, 29–34 [DOI] [PMC free article] [PubMed] [Google Scholar]
- 11. Chun Y. J., Shimada T., Sanchez-Ponce R., Martin M. V., Lei L., Zhao B., Kelly S. L., Waterman M. R., Lamb D. C., Guengerich F. P. (2007) Electron transport pathway for a Streptomyces cytochrome P450: cytochrome P450 105D5-catalyzed fatty acid hydroxylation in Streptomyces coelicolor A3(2). J. Biol. Chem. 282, 17486–17500 [DOI] [PubMed] [Google Scholar]
- 12. Saghatelian A., Trauger S. A., Want E. J., Hawkins E. G., Siuzdak G., Cravatt B. F. (2004) Assignment of endogenous substrates to enzymes by global metabolite profiling. Biochemistry 43, 14332–14339 [DOI] [PubMed] [Google Scholar]
- 13. Sanchez-Ponce R., Guengerich F. P. (2007) Untargeted analysis of mass spectrometry data for elucidation of metabolites and function of enzymes. Anal. Chem. 79, 3355–3362 [DOI] [PMC free article] [PubMed] [Google Scholar]
- 14. Xiao Y., Guengerich F. P. (2012) Metabolomic analysis and identification of a role for the orphan human cytochrome P450 2W1 in selective oxidation of lysophospholipids. J. Lipid Res. 53, 1610–1617 [DOI] [PMC free article] [PubMed] [Google Scholar]
- 15. Guengerich F. P., Cheng Q. (2011) Orphans in the human cytochrome P450 superfamily: approaches to discovering functions and relevance in pharmacology. Pharmacol. Rev. 63, 684–699 [DOI] [PMC free article] [PubMed] [Google Scholar]
- 16. Jakoby W. B. (1980) Detoxication enzymes. In Enzymatic Basis of Detoxication (Jakoby W. B. ed.) Vol. 1, pp. 1–6, Academic Press, New York [Google Scholar]
- 17. Karlgren M., Backlund M., Johansson I., Oscarson M., Ingelman-Sundberg M. (2004) Characterization and tissue distribution of a novel human cytochrome P450-CYP2U1. Biochem. Biophys. Res. Commun. 315, 679–685 [DOI] [PubMed] [Google Scholar]
- 18. Chuang S. S., Helvig C., Taimi M., Ramshaw H. A., Collop A. H., Amad M., White J. A., Petkovich M., Jones G., Korczak B. (2004) CYP2U1, a novel human thymus- and brain-specific cytochrome P450, catalyzes ω- and (ω-1)-hydroxylation of fatty acids. J. Biol. Chem. 279, 6305–6314 [DOI] [PubMed] [Google Scholar]
- 19. Choudhary D., Jansson I., Stoilov I., Sarfarazi M., Schenkman J. B. (2005) Expression patterns of mouse and human CYP orthologs (families 1–4) during development and in different adult tissues. Arch. Biochem. Biophys. 436, 50–61 [DOI] [PubMed] [Google Scholar]
- 20. Jarrar Y. B., Cho S. A., Oh K. S., Kim D. H., Shin J. G., Lee S. J. (2013) Identification of cytochrome P450s involved in the metabolism of arachidonic acid in human platelets. Prostaglandins, Leukot., Essent. Fatty Acids 89, 227–234 [DOI] [PubMed] [Google Scholar]
- 21. Bisogno T., Melck D., De Petrocellis L., Bobrov M., Gretskaya N. M., Bezuglov V. V., Sitachitta N., Gerwick W. H., Di Marzo V. (1998) Arachidonoylserotonin and other novel inhibitors of fatty acid amide hydrolase. Biochem. Biophys. Res. Commun. 248, 515–522 [DOI] [PubMed] [Google Scholar]
- 22. Patricelli M. P., Cravatt B. F. (1999) Fatty acid amide hydrolase competitively degrades bioactive amides and esters through a nonconventional catalytic mechanism. Biochemistry 38, 14125–14130 [DOI] [PubMed] [Google Scholar]
- 23. Verhoeckx K. C., Voortman T., Balvers M. G., Hendriks H. F., Wortelboer H. M., Witkamp R. F. (2011) Presence, formation and putative biological activities of N-acyl serotonins, a novel class of fatty-acid derived mediators, in the intestinal tract. Biochim. Biophys. Acta 1811, 578–586 [DOI] [PubMed] [Google Scholar]
- 24. Hanna I. H., Teiber J. F., Kokones K. L., Hollenberg P. F. (1998) Role of the alanine at position 363 of cytochrome P450 2B2 in influencing the NADPH- and hydroperoxide-supported activities. Arch. Biochem. Biophys. 350, 324–332 [DOI] [PubMed] [Google Scholar]
- 25. Guengerich F. P. (2005) Reduction of cytochrome b5 by NADPH-cytochrome P450 reductase. Arch. Biochem. Biophys. 440, 204–211 [DOI] [PubMed] [Google Scholar]
- 26. Shimada T., Misono K. S., Guengerich F. P. (1986) Human liver microsomal cytochrome P-450 mephenytoin 4-hydroxylase, a prototype of genetic polymorphism in oxidative drug metabolism. Purification and characterization of two similar forms involved in the reaction. J. Biol. Chem. 261, 909–921 [PubMed] [Google Scholar]
- 27. Hoover D. M., Lubkowski J. (2002) DNAWorks: an automated method for designing oligonucleotides for PCR-based gene synthesis. Nucleic Acids Res. 30, e43. [DOI] [PMC free article] [PubMed] [Google Scholar]
- 28. Wu Z. L., Qiao J., Zhang Z. G., Guengerich F. P., Liu Y., Pei X. Q. (2009) Enhanced bacterial expression of several mammalian cytochrome P450s by codon optimization and chaperone coexpression. Biotechnol. Lett. 31, 1589–1593 [DOI] [PMC free article] [PubMed] [Google Scholar]
- 29. Wu Z. L., Sohl C. D., Shimada T., Guengerich F. P. (2006) Recombinant enzymes overexpressed in bacteria show broad catalytic specificity of human cytochrome P450 2W1 and limited activity of human cytochrome P450 2S1. Mol. Pharmacol. 69, 2007–2014 [DOI] [PubMed] [Google Scholar]
- 30. Parikh A., Gillam E. M., Guengerich F. P. (1997) Drug metabolism by Escherichia coli expressing human cytochromes P450. Nat. Biotechnol. 15, 784–788 [DOI] [PubMed] [Google Scholar]
- 31. Nishihara K., Kanemori M., Kitagawa M., Yanagi H., Yura T. (1998) Chaperone coexpression plasmids: differential and synergistic roles of DnaK-DnaJ-GrpE and GroEL-GroES in assisting folding of an allergen of Japanese cedar pollen, Cryj2, in Escherichia coli. Appl. Environ. Microbiol. 64, 1694–1699 [DOI] [PMC free article] [PubMed] [Google Scholar]
- 32. Omura T., Sato R. (1964) The carbon monoxide-binding pigment of liver microsomes. I. Evidence for its hemoprotein nature. J. Biol. Chem. 239, 2370–2378 [PubMed] [Google Scholar]
- 33. Laemmli U. K. (1970) Cleavage of structural proteins during the assembly of the head of bacteriophage T4. Nature 227, 680–685 [DOI] [PubMed] [Google Scholar]
- 34. Candiano G., Bruschi M., Musante L., Santucci L., Ghiggeri G. M., Carnemolla B., Orecchia P., Zardi L., Righetti P. G. (2004) Blue silver: a very sensitive colloidal Coomassie G-250 staining for proteome analysis. Electrophoresis 25, 1327–1333 [DOI] [PubMed] [Google Scholar]
- 35. Tang Z., Martin M. V., Guengerich F. P. (2009) Elucidation of functions of human cytochrome P450 enzymes: identification of endogenous substrates in tissue extracts using metabolomic and isotopic labeling approaches. Anal. Chem. 81, 3071–3078 [DOI] [PMC free article] [PubMed] [Google Scholar]
- 36. Guengerich F. P. (1978) Destruction of heme and hemoproteins mediated by liver microsomal reduced nicotinamide adenine dinucleotide phosphate-cytochrome P-450 reductase. Biochemistry 17, 3633–3639 [DOI] [PubMed] [Google Scholar]
- 37. Guengerich F. P., Bartleson C. J. (2007) Analysis and characterization of enzymes and nucleic acids. in Principles and Methods of Toxicology (Hayes A. W., ed.) 5th Ed., pp. 1981–2048, CRC Press, Boca Raton, FL [Google Scholar]
- 38. Nordström A., O'Maille G., Qin C., Siuzdak G. (2006) Nonlinear data alignment for UPLC-MS and HPLC-MS based metabolomics: quantitative analysis of endogenous and exogenous metabolites in human serum. Anal. Chem. 78, 3289–3295 [DOI] [PMC free article] [PubMed] [Google Scholar]
- 39. Katajamaa M., Miettinen J., Oresic M. (2006) MZmine: toolbox for processing and visualization of mass spectrometry based molecular profile data. Bioinformatics 22, 634–636 [DOI] [PubMed] [Google Scholar]
- 40. Pluskal T., Castillo S., Villar-Briones A., Oresic M. (2010) MZmine 2: modular framework for processing, visualizing, and analyzing mass spectrometry-based molecular profile data. BMC Bioinformatics 11, 395. [DOI] [PMC free article] [PubMed] [Google Scholar]
- 41. Dierks E. A., Zhang Z., Johnson E. F., Ortiz de Montellano P. R. (1998) The catalytic site of cytochrome P4504A11 (CYP4A11) and its L131F mutant. J. Biol. Chem. 273, 23055–23061 [DOI] [PubMed] [Google Scholar]
- 42. Meinnel T., Mechulam Y., Blanquet S. (1993) Methionine as translation start signal: a review of the enzymes of the pathway in Escherichia coli. Biochimie 75, 1061–1075 [DOI] [PubMed] [Google Scholar]
- 43. Dong M. S., Bell L. C., Guo Z., Phillips D. R., Blair I. A., Guengerich F. P. (1996) Identification of retained N-formylmethionine in bacterial recombinant mammalian cytochrome P450 proteins with the N-terminal sequence MALLLAVFL: roles of residues 3–5 in retention and membrane topology. Biochemistry 35, 10031–10040 [DOI] [PubMed] [Google Scholar]
- 44. Smith C. A., Want E. J., O'Maille G., Abagyan R., Siuzdak G. (2006) XCMS: processing mass spectrometry data for metabolite profiling using nonlinear peak alignment, matching, and identification. Anal. Chem. 78, 779–787 [DOI] [PubMed] [Google Scholar]
- 45. Tautenhahn R., Patti G. J., Rinehart D., Siuzdak G. (2012) XCMS online: a web-based platform to process untargeted metabolomic data. Anal. Chem. 84, 5035–5039 [DOI] [PMC free article] [PubMed] [Google Scholar]
- 46. Schenkman J. B., Remmer H., Estabrook R. W. (1967) Spectral studies of drug interaction with hepatic microsomal cytochrome P-450. Mol. Pharmacol. 3, 113–123 [PubMed] [Google Scholar]
- 47. Goldstone J. V., McArthur A. G., Kubota A., Zanette J., Parente T., Jönsson M. E., Nelson D. R., Stegeman J. J. (2010) Identification and developmental expression of the full complement of cytochrome P450 genes in zebrafish. BMC Genomics 11, 643. [DOI] [PMC free article] [PubMed] [Google Scholar]
- 48. Wu K. C., Cui J. Y., Klaassen C. D. (2012) Effect of graded Nrf2 activation on phase-I and -II drug metabolizing enzymes and transporters in mouse liver. PLoS One 7, e39006. [DOI] [PMC free article] [PubMed] [Google Scholar]
- 49. Gillam E. M., Notley L. M., Cai H., De Voss J. J., Guengerich F. P. (2000) Oxidation of indole by cytochrome P450 enzymes. Biochemistry 39, 13817–13824 [DOI] [PubMed] [Google Scholar]
- 50. Ma X., Idle J. R., Krausz K. W., Gonzalez F. J. (2005) Metabolism of melatonin by human cytochromes P450. Drug Metab. Dispos. 33, 489–494 [DOI] [PubMed] [Google Scholar]
- 51. Lu A. Y., Coon M. J. (1968) Role of hemoprotein P-450 in fatty acid ω-hydroxylation in a soluble enzyme system from liver microsomes. J. Biol. Chem. 243, 1331–1332 [PubMed] [Google Scholar]
- 52. Boddupalli S. S., Pramanik B. C., Slaughter C. A., Estabrook R. W., Peterson J. A. (1992) Fatty acid monooxygenation by P450BM-3: product identification and proposed mechanisms for the sequential hydroxylation reactions. Arch. Biochem. Biophys. 292, 20–28 [DOI] [PubMed] [Google Scholar]
- 53. Fujishiro T., Shoji O., Nagano S., Sugimoto H., Shiro Y., Watanabe Y. (2011) Crystal structure of H2O2-dependent cytochrome P450SPα with its bound fatty acid substrate: insight into the regioselective hydroxylation of fatty acids at the alpha position. J. Biol. Chem. 286, 29941–29950 [DOI] [PMC free article] [PubMed] [Google Scholar]
- 54. Lee D. S., Yamada A., Sugimoto H., Matsunaga I., Ogura H., Ichihara K., Adachi S., Park S. Y., Shiro Y. (2003) Substrate recognition and molecular mechanism of fatty acid hydroxylation by cytochrome P450 from Bacillus subtilis: crystallographic, spectroscopic, and mutational studies. J. Biol. Chem. 278, 9761–9767 [DOI] [PubMed] [Google Scholar]
- 55. Maione S., De Petrocellis L., de Novellis V., Moriello A. S., Petrosino S., Palazzo E., Rossi F. S., Woodward D. F., Di Marzo V. (2007) Analgesic actions of N-arachidonoyl-serotonin, a fatty acid amide hydrolase inhibitor with antagonistic activity at vanilloid TRPV1 receptors. Br. J. Pharmacol. 150, 766–781 [DOI] [PMC free article] [PubMed] [Google Scholar]
- 56. Gilmore A. J., Heblinski M., Reynolds A., Kassiou M., Connor M. (2012) Inhibition of human recombinant T-type calcium channels by N-arachidonoyl 5-HT. Br. J. Pharmacol. 167, 1076–1088 [DOI] [PMC free article] [PubMed] [Google Scholar]
- 57. Yoo J. M., Sok D. E., Kim M. R. (2013) Effect of endocannabinoids on IgE-mediated allergic response in RBL-2H3 cells. Int. Immunopharmacol. 17, 123–131 [DOI] [PubMed] [Google Scholar]
- 58. Jones P., Suggett A. (1968) The catalse-hydrogen peroxide system: kinetics of catalatic action at high substrate concentrations. Biochem. J. 110, 617–620 [DOI] [PMC free article] [PubMed] [Google Scholar]
- 59. Leung D., Saghatelian A., Simon G. M., Cravatt B. F. (2006) Inactivation of N-acyl phosphatidylethanolamine phospholipase D reveals multiple mechanisms for the biosynthesis of endocannabinoids. Biochemistry 45, 4720–4726 [DOI] [PMC free article] [PubMed] [Google Scholar]
- 60. Dong M. S., Yamazaki H., Guo Z., Guengerich F. P. (1996) Recombinant human cytochrome P450 1A2 and an N-terminal-truncated form: construction, purification, aggregation properties, and interactions with flavodoxin, ferredoxin, and NADPH-cytochrome P450 reductase. Arch. Biochem. Biophys. 327, 11–19 [DOI] [PubMed] [Google Scholar]
- 61. Guengerich F. P., Gillam E. M., Shimada T. (1996) New applications of bacterial systems to problems in toxicology. Crit. Rev. Toxicol. 26, 551–583 [DOI] [PubMed] [Google Scholar]