

Background: Numerous angiogenic growth factors depend on heparan sulfate for their activity.
Results: Heparan sulfate 6-O-sulfotransferases induce angiogenesis through HB-EGF/EGFR signaling and angiogenic cytokine expression in ovarian cancer cells.
Conclusion: Ovarian cancer cell 6-O-sulfation levels influence angiogenic responses.
Significance: HS6ST inhibitors and HS mimetics should be explored in the development of new anti-angiogenic agents.
Keywords: Angiogenesis, Epidermal Growth Factor Receptor (EGFR), Heparan Sulfate, Sulfotransferase, Tumor Microenvironment, HB-EGF, IL-6, IL-8
Abstract
Heparan sulfate (HS) is a component of cell surface and extracellular matrix proteoglycans that regulates numerous signaling pathways by binding and activating multiple growth factors and chemokines. The amount and pattern of HS sulfation are key determinants for the assembly of the trimolecular, HS-growth factor-receptor, signaling complex. Here we demonstrate that HS 6-O-sulfotransferases 1 and 2 (HS6ST-1 and HS6ST-2), which perform sulfation at 6-O position in glucosamine in HS, impact ovarian cancer angiogenesis through the HS-dependent HB-EGF/EGFR axis that subsequently modulates the expression of multiple angiogenic cytokines. Down-regulation of HS6ST-1 or HS6ST-2 in human ovarian cancer cell lines results in 30–50% reduction in glucosamine 6-O-sulfate levels in HS, impairing HB-EGF-dependent EGFR signaling and diminishing FGF2, IL-6, and IL-8 mRNA and protein levels in cancer cells. These cancer cell-related changes reduce endothelial cell signaling and tubule formation in vitro. In vivo, the development of subcutaneous tumor nodules with reduced 6-O-sulfation is significantly delayed at the initial stages of tumor establishment with further reduction in angiogenesis occurring throughout tumor growth. Our results show that in addition to the critical role that 6-O-sulfate moieties play in angiogenic cytokine activation, HS 6-O-sulfation level, determined by the expression of HS6ST isoforms in ovarian cancer cells, is a major regulator of angiogenic program in ovarian cancer cells impacting HB-EGF signaling and subsequent expression of angiogenic cytokines by cancer cells.
Introduction
Ovarian cancer is the deadliest of all the gynecological malignancies. The majority of patients present with advanced disease, and although response to standard cytotoxic therapy is usually observed, chemotherapy-resistant disease develops in most patients leading to the patient's death. Angiogenesis, as a target for the treatment of ovarian cancer, has been validated in randomized trials, which have shown that VEGF pathway inhibitors, when added to conventional chemotherapy, prolong progression-free survival (1–3). However, despite positive data for VEGF inhibitors in ovarian cancer, resistance to this therapy eventually occurs. One mechanism of resistance is through the redundancy of angiogenic cytokines in ovarian cancer. Therefore, new angiogenesis-associated molecular targets are required to inhibit angiogenesis in ovarian cancer.
A number of angiogenic growth factors, including FGF1 (4),3 FGF2 (5–7), VEGF165 (8), IL-8 (9, 10), SDF-1α (11, 12), and IL-6 (13), depend on HS for binding and signaling through their cognate receptor. The key structural determinants of HS interaction with cytokines and induction of signaling are the amount and pattern of HS sulfation, which includes sulfation at the 2-O-position of iduronate and 6-O-, 3-O-, and N-positions in glucosamine and clustering of sulfated disaccharides along the HS chain, which creates highly sulfated domains interspersed with regions of low sulfation (14, 15). Some growth factors, for example VEGF165 and IL-8, require longer HS sequences organized into domains for their activity (8, 16), whereas others, such as FGF2, require shorter activating sequences with critical 6-O-sulfation moieties along the HS chain (5–7). Conversely, sulfation at 2-O- and N-positions are essential for effective inhibition of FGF2 signaling by HS oligosaccharides that compete with cellular HS for binding to FGF2 (17, 18).
The level and distribution of 6-O-sulfation depends on three isoforms of 6-O-sulfotransferases (HS6ST-1, -2, and -3), which catalyze 6-O-sulfation on N-sulfated or N-acetylated glucosamine, and two isoforms of extracellular 6-O-endosulfatases (Sulfs) that desulfate glucosamine 6S (19–21). Diminished expression of Sulf-1 has been reported in several tumor types, including ovarian and metastatic breast carcinomas (22, 23). Re-expression of exogenous human Sulf-1 was associated with reduced breast tumor xenograft growth and lower microvessel density (24) and reduction of ovarian cancer cell proliferation in vitro (22). This suggests that elevated 6-O-sulfation potentiates signaling through a number of receptors and is a tumor growth promoting factor in breast and ovarian cancer. In contrast, human glioblastoma cell lines with reduced levels of Sulf-2 grew inefficiently (25), suggesting that appropriate HS 6-O-sulfation level is required to prevent tumor growth. These data demonstrate a context-dependent role for Sulfs in regulating tumor growth through distinct cellular mechanisms. For example, glioblastoma cells with down-regulated Sulf-2 expression showed significantly reduced signaling through PDGF receptor α, a major signaling pathway in glioblastoma (25).
In contrast to the studies described above, the role of HS6STs in cancer cells remains largely unknown. Our previous study demonstrated that ovarian high grade serous carcinomas have high levels of 6-O-sulfation in tumor endothelium when compared with the vasculature of normal ovarian tissue (26). We also found through down-regulation of HS6ST-1 or HS6ST-2 in endothelial cells that sulfation at the glucosamine 6-O position was critical for endothelial cell functions in vitro and in vivo (26).
In this study, we explored the role of HS6STs in ovarian cancer cells. We hypothesized that HS may regulate tumor growth through an autocrine and a paracrine mode of action where cancer cell-released HS modulates signaling in tumor cells and in endothelium by binding angiogenic cytokines and supporting their signaling capacity. We discovered that HS6STs in ovarian cancer cells regulate HB-EGF-dependent EGFR signaling, which induces FGF2, IL-6, and IL-8 expression in cancer cells, thereby impacting endothelial cell functions in vitro and in vivo.
EXPERIMENTAL PROCEDURES
Cell Lines and Cell Culture
Ovarian cancer cell lines CAOV3, ES2, OVCAR-3, OVCAR-5, and SKOV3 (American Type Culture Collection) and OAW42, OV-90, and TOV21G (European Collection of Cell Cultures) were cultured in RPMI (Invitrogen) supplemented with 10% FBS (Biosera). Immortalized ovarian surface epithelial cells (IOSE4 and IOSE11; provided by Dr. K. Lawrenson and Prof. S. Gayther) were cultured in a 1:1 mixture of medium 199:MCDB 105 (Sigma-Aldrich) containing insulin (5 μg/ml; Sigma-Aldrich), hydrocortisone (0.5 μg/ml; Sigma-Aldrich), BPE (34 μg protein/ml; Invitrogen), EGF (10 ng/ml; Invitrogen), and 15% FBS. Human umbilical vein endothelial cells (HUVEC; Lonza) were cultured in EBM-2 medium supplemented with SingleQuot growth supplements (Lonza) up to passage 7. Pulmonary artery smooth muscle cells (PaSMC) (Lonza) were maintained in SmBM medium supplemented with SmGM-2 SingleQuot kit supplements (Lonza) up to passage 15. Normal human dermal fibroblasts (NHDF; Lonza) were cultured in DMEM containing F12 nutrient mixture supplemented with l-glutamine (Invitrogen) and 10% FBS up to passage 15. HEK293T cells were cultured in DMEM (Invitrogen) supplemented with l-glutamine and pyruvate (both from Invitrogen) and 10% FBS.
Real Time PCR
Extraction of RNA and generation of cDNA were described in the supplemental data of our previous study (26). Expression of HS6ST-1 and HS6ST-2 in a panel of ovarian cancer cell lines, IOSE cell lines, and TissueScan quantitative PCR array plates (HORT501; Amsbio) containing cDNA from 40 ovarian cancers and 8 normal ovaries was tested using TaqMan Universal PCR Master Mix (Invitrogen), specific probes (Roche), and the following primers: HS6ST-1 forward, 5′-atgcagctgtacgactacgc; HS6ST-1 reverse, 5′-ctgccgcttgtactggtagc; HS6ST-2 forward, 5′-tgcgatcttctccaagattttc; and HS6ST-2 reverse, 5′-cgatcacggcaaataggaag. GAPDH and β-actin served as internal control genes. Real time PCRs were performed on the ABI Prism 7900 HT sequence detection system (Applied Biosystems).
FGF2, IL-6, and IL-8 mRNA levels were tested with RT2 quantitative PCR primer assays (SABiosciences). The reactions contained 5 ng of cDNA (1 ng/μl), 5.5 μl of RT2 SYBR green quantitative PCR Master Mix (Qiagen), and 0.5 μl of forward and reverse primers for FGF2, IL-6, or IL-8, respectively, or 0.25 μl of each primer for 18 S, GAPDH, and tubulin housekeeping genes. The amplification procedures were performed as per primer assay instructions but with the addition of a 2-min step at 50 °C at the beginning of the cycle. Real time PCRs were performed on the ABI Prism 7900 HT sequence detection system.
RT-PCR
Extraction of RNA, generation of cDNA, HS6ST-1, and HS6ST-2 primer sequences and PCR cycling conditions were described in the supplemental data of our previously published study (26). The following primers were used for Sulf1 and Sulf2 genes: Sulf1 forward, 5′-ggatccatccaacagtcaaatcacttgcccaaat; Sulf1 reverse, 5′-ggatccccttccacgctctggccgattg; Sulf2 forward, 5′-ggatcccatcgaggtggacggcagg; and Sulf2 reverse, 5′-ggatccagccacaccttgtccttctc. PCR cycling conditions were as for the HS6ST-1 gene (26).
Generation of Conditioned Medium (CM) and Cell Lysates
Ovarian cancer cells (5 × 10⁶) were plated in 10-cm dishes. Cells were cultured for 24 h in RPMI supplemented with 10% FBS. Media were collected, filtered, and stored at −80 °C. Cells were washed with ice-cold PBS, and 500 μl of cell lysis buffer (Cell Signaling) containing protease inhibitor mixture (Sigma-Aldrich) diluted 1:100, phosphatase inhibitor cocktails I and III (Sigma-Aldrich) diluted 1:100, sodium fluoride (10 mm), and sodium orthovanadate (1 mm) were added to the cells. After incubation on ice, the cells were scraped, the lysates were centrifuged, and supernatants were stored at −80 °C.
Down-regulation of HS6ST-1 or HS6ST-2 in Ovarian Cancer Cells
Nonoverlapping oligonucleotide sequences for generation of shRNAs targeting HS6ST-1 or HS6ST-2 in pSUPER.retro.puro plasmid (Origene) were described in the supplemental data of our previously published study (26). Two rounds of 24-h infection were performed as described (26), after which cells were cultured in the media containing 2 μg/ml puromycin.
Sulforhodamine B Cell Proliferation Assay
Ovarian cancer cells were plated at 2500 cells/well in 24-well plates in 250 μl of RPMI medium containing 10% FBS. The following day, the cell culture medium was changed to RPMI containing 1% FBS. After 5 days, the cells were fixed with 5% TCA for 1 h at +4 °C, washed with water, and allowed to dry. The cells were stained with 4% sulforhodamine B in 1% acetic acid for 30 min, excess stain was removed by washing in 1% acetic acid, and wells were allowed to dry. Stain was solubilized in 200 μl of 10 mm Tris, pH 8.8, and transferred to 96-well plate for reading on a microplate reader at 540 nm.
In Vitro Endothelial Cell Assays
CM from ovarian cancer cells were used in HUVEC migration and three-dimensional tube formation assays as described before (18, 26). The aortic ring assay was performed as previously described (18). For co-culture experiments, HUVECs (5 × 10³ cells/well) were admixed with ovarian cancer cells (2.5 × 10³ cells/well) and PaSMC (1.5 × 10⁴ cells/well) in RPMI medium containing 10% FBS and plated in 96-well plates. Alternatively, HUVEC (0.4 × 10⁴ cells/well) were plated on confluent monolayers of NHDF in RPMI media containing 10% FBS in a 96-well plate in a final volume of 50 μl. Two hundred microliters of CM were added to each well. When required, neutralizing antibodies against FGF2 (5 μg/ml; mouse monoclonal IgG1; Millipore), IL-6, and IL-8 (both at 0.5 μg/ml; polyclonal goat IgG; R&D) were added to the media. Mouse IgG1 (Dako) and normal goat serum (Dako) were used at corresponding concentrations as negative controls.
An endothelial network was allowed to form for 5 days, fixed in 4% paraformaldehyde, permeabilized with TBS containing 0.25% Triton X-100, blocked with 5% FBS in TBS, and incubated with anti-human CD31 antibody (1:100; Dako). Cells were washed and incubated with Alexa Fluor 488-conjugated anti-mouse (1:1000; Invitrogen). After washing, samples were analyzed by fluorescence microscopy using as ×10 magnification lens (Solent Scientific). The endothelial network area was evaluated using ImageJ software.
HS Disaccharide Analysis
Ovarian cancer cells were cultured in the medium containing 10 μCi/ml of [3H]glucosamine hydrochloride for 36 h. HS extracts from cells and conditioned media were pooled, and HS disaccharide analysis was performed as described (26).
HB-EGF Binding to Immobilized HS
96-well heparin-binding plates (Iduron) were coated with HS extracted from OVCAR-3 cells expressing nonspecific shRNAs for 24 h, washed three times with standard assay buffer (SAB; 50 mm sodium acetate, pH 7.3, 150 mm sodium chloride, and 0.2% Tween 20), and incubated with 20 mg/ml BSA in SAB for 2 h. HB-EGF (100 ng/ml; R&D Systems) was mixed with increasing concentrations (0.1–100 ng/ml) of either unmodified or chemically de-6-O-sulfated porcine intestinal mucosal HS (Iduron) for 15 min prior to plating on immobilized HS for 2 h. After washing with SAB, biotin-tagged primary antibody against HB-EGF (R&D Systems) diluted 1:80 in SAB containing 10 mg/ml BSA was added and incubated at room temperature for 1 h. After washing with SAB, streptavidin-HRP (R&D Systems) diluted 1:300 in SAB supplemented with 10 mg/ml BSA was added for 45 min at room temperature. Wells were washed three times with SAB and then incubated for 20 min in TMB (Sigma-Aldrich). The reaction was stopped with 2 m sulfuric acid, and optical density was measured at 450 nm.
Enzyme-linked Immunoassays for FGF2, IL-6, and IL-8
FGF2, IL-6, and IL-8 concentrations in ovarian cancer cell lysates and CM were determined using FGF2-, IL-6-, and IL-8-specific ELISA kits (R&D Systems) following the manufacturer's instructions. The protein concentration of the lysates was determined using the BCA assay (Pierce), and the values are expressed as pg/mg of total protein within that lysate.
Cytokine Antibody Array
OVCAR-3 and OVCAR-5 cells expressing nonspecific shRNAs or shRNAs targeting HS6ST-1 or HS6ST-2 (5 × 10⁶) were plated in 10-cm dishes and cultured for 24 h in RPMI supplemented with 10% FBS. Media was collected and filtered, and 1 ml of medium was applied onto the membranes containing specific cytokine antibodies (RayBio® human cytokine antibody array 3; RayBiotech) following the instructions provided by the manufacturer. The arrays were imaged using Image Reader LAS-1000 (FujiFilm).
Receptor Tyrosine Kinase Phosphorylation Antibody Array
Cell lysates (500 μg/ml) were prepared from OVCAR-3 cells expressing nonspecific shRNAs or shRNAs targeting HS6ST-1 or -2. The phosphorylation status of receptor tyrosine kinases in cell lysates was determined using the RayBio® human RTK phosphorylation antibody array 1 (RayBiotech) following the manufacturer's instructions. The arrays were imaged using Image Reader LAS-1000 (FujiFilm). Densitometric evaluation of images was performed using the Aida Image analyzer.
Western Blotting
HUVECs were plated in 6-well plates at 1 × 10⁵ cell/well in EBM-2 medium lacking SingleQuots growth supplements and containing 0.1% FBS. After 24 h, cells were dosed with CM generated by ovarian cancer cells. After 10 min of exposure to CM, cell lysates were prepared as described above. Ten micrograms of protein were separated by SDS-polyacrylamide gel electrophoreses and blotted to PVDF membranes. The membranes were blocked with 10% nonfat dried milk in PBS supplemented with 0.1% Tween 20 (PBST) for 1 h, followed by incubation with the primary antibodies overnight at 4 °C. The following antibodies were used: anti-phospho-ERK1/2 (Thr202/Tyr204; clone E10; 1:1000), anti-phospho-FRS2α (Tyr196; 1:500), anti-phospho-AKT (Ser473; clone 193H12; 1:1000) from Cell Signaling and anti-phospho-MEK1 (Ser218/Ser222; clone E237; 1:1000), anti-phospho-p38 (Thr180; 1:1000) and anti-GAPDH (1:2000) from Abcam. The membranes were washed with PBST and incubated in horseradish peroxidase-conjugated goat anti-rabbit or anti-mouse IgG (Sigma-Aldrich) diluted 1:2000 in 5% nonfat dried milk in PBST. Bound secondary antibody was detected by chemiluminescence (PerkinElmer Life Sciences).
In Vivo Tumor Studies
Female NOD (non-obese diabetic) scid gamma (NSG) mice (Cancer Research UK Manchester Institute) were housed in an individually ventilated caging system on a 12-h light/dark environment maintained at constant temperature and humidity. The mice were fed a standard diet of irradiated feed (Harlan-Teklad) and allowed water ad libitum. All procedures were carried out in accordance with UKCCCR guidelines 1999 by approved protocol (Home Office Project license no. 40/3609).
OVCAR-3 parental cells and OVCAR-3 cells expressing nonspecific or HS6ST-2 targeting shRNAs (107 cells/mouse) were grown as subcutaneous xenografts in groups of five female NSG mice. Tumor volume, defined as (height × width2)/2, was measured twice a week, and the mice were sacrificed before the tumors reached 1,250 mm3. Tumors were excised at day 110, snap frozen at −70 °C, and embedded in OCT.
CD31 Staining of Tumor Sections
Frozen tumor sections were fixed with 4% paraformaldehyde in TBS for 15 min, washed, blocked in 10% goat serum, and incubated with rat anti-mouse CD31 antibody (BD Pharmingen) diluted 1:100 overnight at 4 °C. Tumor sections were washed and incubated with Alexa Fluor 488-conjugated donkey anti-rat IgG antibody (1:800; Invitrogen), Cy-3-labeled anti-α-SMA antibody (1:500; Sigma-Aldrich), and Hoechst 33342 (1:1000; Invitrogen) for 1 h at room temperature. After washing, tumor sections were mounted using ProLong Gold antifade reagent (Invitrogen). Images were acquired with a 3DHistech Mirax scanner, viewed with Pannoramic Viewer software (3DHistech), and analyzed by ImageJ software to determine the number of vessels that are expressed as a number of fluorescent objects per 10,000 pixels of non-necrotic tissue area as determined by MetaMorph image analysis software (Molecular Devices).
Statistical Analysis
The data are expressed as the means ± S.D. or ± S.E. For comparison of groups, the Student's t test was used. A level of p < 0.05 was considered as statistically significant.
RESULTS
Expression of HS6ST-1 and HS6ST-2 in Ovarian Cancer
Our previous work had shown that cancer cells in ovarian tumors express HS6ST-1 and HS6ST-2, whereas endothelium displays only HS6ST-1 expression when tested by in situ hybridization (27). Here we further characterized expression levels of HS6ST-1 and HS6ST-2 in ovarian tumor cDNA panel generated from 12 serous, 20 papillary serous, 5 endometrioid, 1 mucinous, 1 clear cell and 1 unknown histology adenocarcinomas, and 8 normal ovaries. The expression levels of HS6ST-1 and HS6ST-2 in normal ovaries and ovarian cancer tissue showed that HS6ST-1 expression was elevated by ∼2-fold in 14 of 40 tumors (35%), whereas HS6ST-2 expression was reduced in the majority of the tumors (Fig. 1, A and B). There was no correlation between disease stage or histological subtype and expression of HS6ST-1 and HS6ST-2 (Fig. 1, A and B). Because expression of genes analyzed in the whole tissue does not reflect expression in specific cell types, we compared expression of HS6ST-1 and HS6ST-2 in eight ovarian cancer cell lines and two immortalized cell lines (IOSE4 and IOSE11) derived from normal ovarian surface epithelium, which is one of the sites of origin for serous ovarian carcinoma (28). In keeping with the results from the cDNA array, we observed elevated expression of HS6ST-1 in all ovarian cancer cell lines when compared with IOSE cells (Fig. 1C). Although both IOSE cell lines showed undetectable levels of HS6ST-2, it was present in four of eight ovarian cancer cell lines (Fig. 1D), thus suggesting variability in expression of HS6ST-2 in distinct cell lineages in normal ovary and ovarian tumors.
FIGURE 1.

HS6ST-1 and HS6ST-2 expression in ovarian cancer. A and B, real time PCR analysis of HS6ST-1 (A) and HS6ST-2 (B) gene expression in 40 ovarian tumor samples of serous (32 samples), mucinous (1 sample), endometrioid (5 samples), clear cell (1 sample), and unknown histological type (1 sample) adenocarcinomas of disease stage I–IV and 8 normal (N) ovarian tissue samples. Gene expression in 8 normal ovarian tissue samples is shown as the mean, which is expressed as 1 (± S.E.). HS6ST-1 and HS6ST-2 mRNA levels in each tumor sample is shown as a value relative to the mean of mRNA levels in normal ovaries (n = 8). C and D, mRNA levels of HS6ST-1 (C) and HS6ST-2 (D) in ovarian cancer cell lines and IOSE cells were analyzed by real time PCR. Expression of HS6ST-1 and HS6ST-2 is shown as a ratio between the levels in each cancer cell line and an average expression value in both IOSE cell lines, which is expressed as 1. The numbers in parentheses indicate the number of samples. E, expression of Sulf-1 and Sulf-2 in ovarian cancer cell lines. mRNA levels of Sulf-1 and Sulf-2 were evaluated by RT-PCR. ES2 cell line shows no expression of Sulfs, OVCAR-5 and OVCAR-3 cell lines express both Sulf isoforms, and OAW42 cells express one Sulf isoform (Sulf-2). F and G, expression of HS6ST-1 in ES2 cells (F) and OVCAR-5 cells (G) transduced with nonspecific shRNA (NS) and shRNAs targeting HS6ST-1 (sh6ST1-1 and sh6ST1-2). β-Actin was used as RT-PCR control. H and I, down-regulation of HS6ST-1 or HS6ST-2 in OVCAR-3 (H) and OAW42 (I) cells was tested by RT-PCR. Two retroviral shRNA plasmids were used to down-regulate either HS6ST-1 (sh6ST1-1 and sh6ST1-2) or HS6ST-2 (sh6ST2-1 and sh6ST2-2). β-Actin was used as RT-PCR control.
The Effect of Down-regulation of HS6STs in Ovarian Cancer Cells
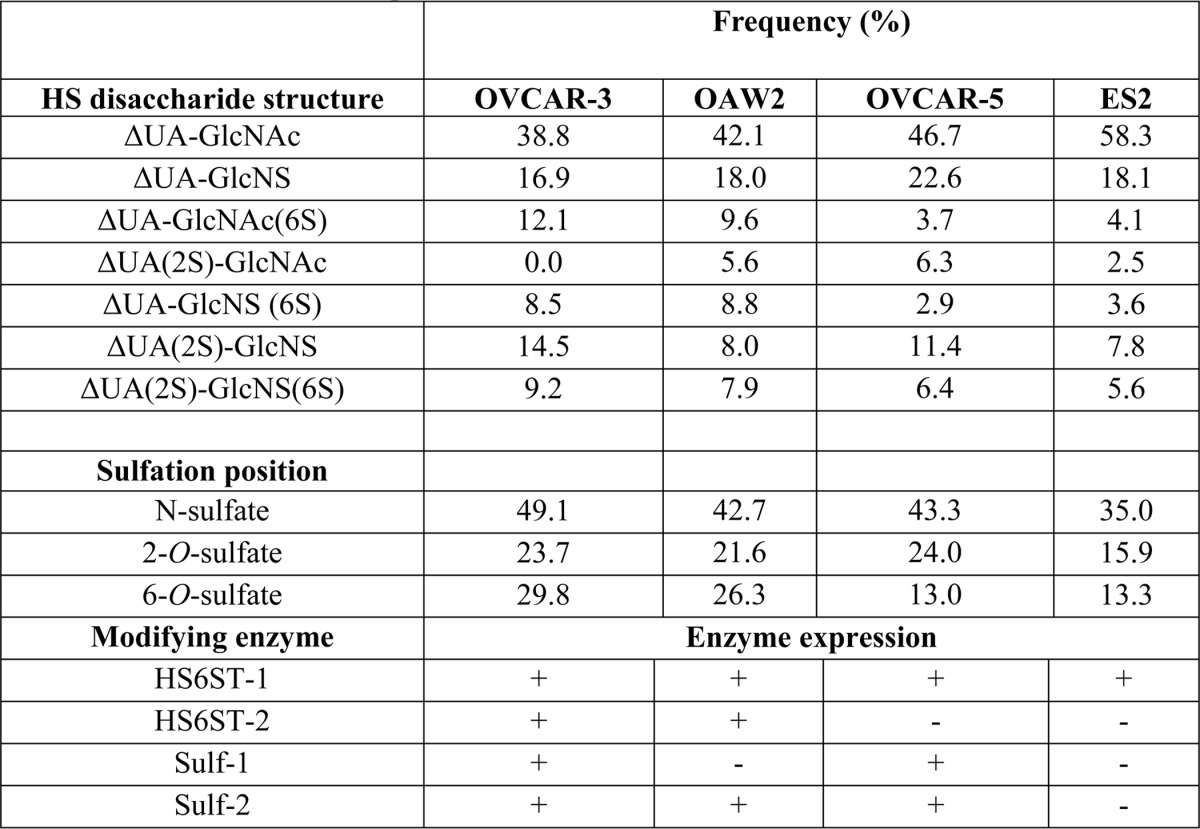
To evaluate specific sulfation levels in ovarian cancer cell lines, we extracted HS from ES2, OAW42, OVCAR-3, and OVCAR-5 cell lines exhibiting differential expression of HS6ST-1, HS6ST-2, Sulf-1, or Sulf-2 (Fig. 1, C–E). In ES2 and OVCAR-5 cells expressing HS6ST-1, but not HS6ST-2, the frequency of 6-O-sulfate containing disaccharides was 13 and 14%, respectively (Table 1). OVCAR-3 and OAW42 cell lines that express both isoforms of HS6ST had higher levels of 6-O-sulfation where the frequency of 6-O-sulfate containing disaccharides was 30 and 27% per 100 disaccharides, respectively (Table 1). There was no apparent correlation between the pattern of disaccharide 6-O-sulfation and expression of Sulfs (Table 1 and Fig. 1E), suggesting that expression of HS6STs in ovarian cancer cells is a major factor in determining the levels of 6-O-sulfation.
TABLE 1.
HS disaccharide composition in ovarian cancer cell lines
To understand the role of HS 6-O-sulfation in ovarian cancer cells, we down-regulated HS6ST-1 in ES2 and OVCAR-5 cells and HS6ST-1 or HS6ST-2 in OAW42 and OVCAR-3 cells using retroviral shRNA vectors targeting either HS6ST-1 (sh6ST1-1 and sh6ST1-2) or HS6ST-2 (sh6ST2-1 and sh6ST2-2) (Fig. 1, F–I). Control cells were transduced with nonspecific shRNA (NS). To test the effect on HS sulfation, we performed HS disaccharide analysis in selected cell lines. Down-regulation of HS6ST-1 and HS6ST-2 in OVCAR-3 cells led to 50 and 44% decreases in 6-O-sulfation, respectively, as shown by reduction in ΔUA-GlcNAc(6S), ΔUA-GlcNS(6S), and ΔUA(2S)-GlcNS(6S) disaccharides, suggesting that there is no compensatory mechanism between the two isoforms (Table 2). Knockdown of HS6ST-1 in ES2 cells led to a reduction in 6-O-sulfate content by 29% compared with ES2 control cells (Table 2). Interestingly, a relatively rare HS disaccharide ΔUA(2S)-GlcNAc, absent in the control OCVAR-3 cells, was detected in cells with down-regulated HS6ST-1 or HS6ST-2. The frequency of this disaccharide was also elevated in ES2 cells with down-regulated HS6ST-1 (Table 2).
TABLE 2.
The effect of down-regulation of HS6ST-1 and HS6ST-2 on HS disaccharide composition
| HS disaccharide structure | Frequency (%)/100 disaccharides |
||||
|---|---|---|---|---|---|
|
OVCAR-3 |
ES2 |
||||
| NS | sh6ST1-1 | sh6ST2-1 | NS | sh6ST1-2 | |
| ΔUA-GlcNAc | 39 | 44 | 45 | 58 | 57 |
| ΔUA-GlcNS | 17 | 22 | 23 | 18 | 21 |
| ΔUA-GlcNAc(6S) | 12 | 4 | 6 | 4 | 3 |
| ΔUA(2S)-GlcNAc | 0 | 5 | 4 | 3 | 4 |
| ΔUA-GlcNS (6S) | 9 | 4 | 4 | 4 | 2 |
| ΔUA(2S)-GlcNS | 15 | 14 | 14 | 8 | 9 |
| ΔUA(2S)-GlcNS(6S) | 9 | 7 | 7 | 6 | 5 |
| Sulfation position | |||||
| N-Sulfates | 50 | 47 | 48 | 36 | 37 |
| 2-O-Sulfates | 24 | 26 | 25 | 17 | 18 |
| 6-O-Sulfates | 30 | 15 | 17 | 14 | 10 |
To examine the effect of down-regulation of HS6STs on cancer cell proliferation rate, we performed cell proliferation assay. Reduction in 6-O-sulfate content did not affect the proliferation rate of ES2, OVCAR-5, and OAW42 cells in low serum medium (Fig. 2A). Minor reduction in proliferation was detected in OVCAR-3 cells with down-regulated HS6ST-1 (23%) and HS6ST-2 (17%) (Fig. 2A).
FIGURE 2.

Reduction of HS6ST-1 or HS6ST-2 expression in ovarian cancer cells impacts endothelial cell migration and tubule formation. A, proliferation of ovarian cancer cell lines. The effect of down-regulation of HS6STs is expressed as a percentage of cell proliferation at day 5 compared with the control cell proliferation (NS), which is expressed as 100%. The data represent the means ± S.D. (n = 2). B, confluent HUVEC monolayers were serum-starved and wounded. CM generated by ES2, OAW42, OVCAR-3, and OVCAR-5 cells expressing nonspecific shRNA (NS) or shRNAs targeting HS6ST-1 (sh6ST1-1 combined with sh6ST1-2) or HS6ST-2 (sh6ST2-1 combined with sh6ST2-2) were added to stimulate cell migration into the wound, which was measured at baseline and after 24 h. Repopulated wound areas are expressed as a percentage of wound area that was repopulated by HUVEC stimulated with control (NS) cell CM (expressed as 100%). Two independent experiments were performed. Each experiment was performed in triplicate. Change in the repopulated area is shown as the mean ± S.D. (n = 2). *, p < 0.01. C, endothelial tubule formation in three-dimensional fibrin gels in the presence of CM generated by OVCAR-3 NS cells and OVCAR-3 cells with down-regulated HS6ST-1 or HS6ST-2. The average number of tubes per carrier bead was quantified in a control experiment where HUVEC were stimulated with NS CM (expressed as 100%). The change in the number of tubes per bead when stimulated with CM from OVCAR-3 cells expressing sh6ST1-1, sh6ST1-2, sh6ST2-1, and sh6ST2-2 is shown as a percentage of the control. Three independent experiments were performed. Each experiment was performed in triplicate. The values are expressed as means ± S.E. (n = 3). *, p < 0.005. D, bright field images of mouse aortic rings embedded in fibrin gels and maintained in ES2 NS and sh6ST1-1/sh6ST1-2 cell CM (upper images) or OAW42 NS, sh6ST1-1/sh6ST1-2, and sh6ST2-1/sh6ST2-2 cell CM (lower images) for 6 days. Scale bars represent 100 μm. E, quantification of the outgrowth of sprouts from the aortic rings was performed using MetaMorph software. Sprouting area when stimulated with ES2 NS or OAW42 NS CM is expressed as 100% (control). The change in the sprouting area when stimulated with CM generated by cells with down-regulated HS6ST-1 or HS6ST-2 is expressed as a percentage of the control area. The means ± S.D. (n = 2) are shown. *, p < 0.005. F, formation of HUVEC endothelial tubule structures in ovarian cancer cell and PaSMC co-cultures. After 5 days in culture, endothelial tubules were visualized by staining with the antibody against human CD31 (green). When cultured with OVCAR-3 cells expressing shRNAs targeting HS6ST-1 (shST1–1) or HS6ST-2 (shST2–1), endothelial tubule formation was absent (lower images). Scale bars, 100 μm. G, endothelial tubule area that was visualized by anti-CD31 staining of HUVEC co-cultures with ES2 NS or sh6ST1-1 cells and PaSMC as shown in F was evaluated using ImageJ software. Control, which is expressed as 100%, represents the tube area formed in the presence of ES2 NS cells. Two independent experiments were performed, and the data are expressed as means ± S.D. *, p < 0.005.
Reduced HS 6-O-Sulfation in Ovarian Cancer Cells Impacts Endothelial Cell Migration and Tubule Formation
Because our previous studies reported no HS staining on cancer cells (26, 27), suggesting that HS fragments may be released from ovarian cancer cell surface by heparanase, we examined the effect of CM generated by control NS cells and cells with down-regulated HS6ST-1 or HS6ST-2 on endothelial cell functions. We first examined HUVEC migration into wounded areas of a confluent monolayer and found that, with the exception of OAW42 HS6ST-2 shRNA-expressing cells, the CM of ovarian cancer cells with reduced expression of HS6ST-1 or HS6ST-2 was significantly less effective (40–80%) in stimulating HUVEC migration than CM generated by control cells (Fig. 2B). This could not be attributed to reduction of HS concentration in CM, because HS levels were similar in control and HS6ST down-regulated cell lines (Table 3), suggesting the significance of 6-O-sulfation.
TABLE 3.
Relative levels of [3H]glucosamine in purified HS from OVCAR-3 and ES2 cells and conditioned medium
| Cell lines | [3H]glucosamine concentrationa |
|---|---|
| cpm/ml/106 cells | |
| OVCAR-3 NS | 23,300 |
| OVCAR-3 sh6ST1-1 | 20,000 |
| OVCAR-3 sh6ST2-1 | 20,000 |
| ES2 NS | 30,000 |
| ES2 sh6ST1-1 | 28,300 |
a [3H]Glucosamine concentration in DEAE-Sephacel chromatography HS peak was normalized to 1 × 10⁶ cells.
We next examined the effect of CM on endothelial tubule formation in fibrin gels. Control OVCAR-3 cells, but not ES2, OVCAR-5, and OAW42 cells, produced CM capable of inducing HUVEC tubule formation in fibrin gels (data not shown). Reduction in 6-O-sulfate content, particularly through the knockdown of HS6ST-1, in OVCAR-3 cells inhibited tubule formation (Fig. 2C). We next discovered that ES2 and OAW42 cell CM induced the outgrowth of endothelial sprouts from mice aortas embedded in fibrin gels (Fig. 2D). CM from cells with down-regulated 6-O-sulfation reduced endothelial cell outgrowth by 70–80% (Fig. 2, D and E).
To determine how cancer cells with reduced 6-O-sulfation affect tubule formation when in close contact with endothelial cells, we admixed cancer cells with HUVEC and PaSMC before placing in culture. After 5 days, ES2 and OVCAR-3 cells induced endothelial tubule formation (Fig. 2F). Knockdown of HS6ST-1 in ES2 cells led to a 40% reduction in the area of endothelial tubes (Fig. 2, F and G), whereas knockdown of HS6ST-1 or HS6ST-2 in OVCAR-3 cells caused a complete inhibition of tubule formation (Fig. 2F). Together these data demonstrate that the level of HS 6-O-sulfation has a major impact on diverse endothelial cell functions.
Down-regulation of HS6STs in Ovarian Cancer Cells Diminishes Activation of FGFR Signaling Pathway in Endothelial Cells
Our data demonstrate that CM generated by cancer cells with down-regulated HS6ST-1 or -2 is less efficient in stimulating angiogenesis in vitro. We therefore hypothesized that reduced 6-O-sulfation in cancer cells would impact endothelial cell signaling. We stimulated endothelial cells with ovarian cancer cell CM collected from the control NS cells or cells with down-regulated HS6ST-1 or -2 and focused on FGFR signaling because it is dependent on HS 6-O-sulfation (5–7). When 6-O-sulfation was reduced, there was a decrease in the phosphorylation of FRS2, ERK1/2, AKT, and MEK1, but not p38 (Fig. 3A), suggesting that the specific signaling pathways downstream of FGFR are affected. Moreover, ES2 cell CM, which was generated in the presence of porcine intestinal mucosal HS, restored ERK1/2 activation (Fig. 3B).
FIGURE 3.

Down-regulation of HS6ST-1 or HS6ST-2 reduces activation of FGF receptor and downstream signaling pathways in endothelial cells. A, serum-starved HUVEC were treated for 10 min with CM generated by ovarian cancer cells expressing NS shRNA or shRNAs targeting HS6ST-1 or HS6ST-2. Phosphorylated FRS2, ERK1/2, AKT, MEK1, and p38 were detected by Western blotting using specific antibodies. Equal protein loading was monitored by probing with the anti-GAPDH antibody. The images shown are representative of three independent experiments. B, CM derived from ES2 cells with down-regulated HS6ST-1 (sh6ST1-2) maintained in the presence of 10 μg/ml of HS for 24 h restored the activation of ERK1/2 in serum-starved HUVEC. C–F, FGF2 levels as determined by ELISA in the cell lysates of ovarian cancer cell lines expressing nonspecific shRNA (NS) or shRNAs targeting HS6ST-1 (sh6ST1-1/sh6ST1-2) or HS6ST-2 (sh6ST2-1). The data represent the means ± S.D. derived from two independent experiments. *, p < 0.0025, ‡, p < 0.05. G, FGF2 protein levels in conditioned media (CM) of ovarian cancer cell lines with down-regulated HS6ST-1 or HS6ST-2. The data are expressed as percentages of FGF2 levels in CM of NS control cells (100%) and represent the means ± S.D. derived from two independent experiments. ‡, p < 0.05.
Having established that HUVEC FGFR signaling is reduced by cancer cell CM containing HS with down-regulated 6-O-sulfation, we determined whether FGF2 protein levels in CM remained unaffected. FGF2 concentration in cell lysates varied in each unmodified cell line (Fig. 3, C–F). Unexpectedly, we found that all cell lines with down-regulated HS6ST-1 or HS6ST-2 had lower FGF2 protein concentrations in cell lysates (Fig. 3, C–F) and CM (Fig. 3G), except CM of ES2 cells with down-regulated HS6ST-1 where FGF2 concentration was up-regulated compared with NS cells (Fig. 3G). Together these data indicate that HS6STs in cancer cells inhibit FGFR signaling in endothelial cells through reduction of secreted FGF2 and through inhibitory HS fragments with diminished 6-O-sulfation (Fig. 3, B–G).
HS6ST-1 and HS6ST-2 Regulate Expression of Angiogenic Cytokines in Ovarian Cancer Cells
To evaluate the levels of a broader spectrum of cytokines, we screened CM from ovarian cancer cells using a cytokine antibody array. There was a significant reduction in the expression of IL-6 protein in OVCAR-3 and OVCAR-5 cell CM and IL-8 protein in OVCAR-5 cell CM (Fig. 4A). We next confirmed that IL-6 and IL-8 protein levels are down-regulated in cell lysates and CM of OVCAR-3 and OVCAR-5 cells (Fig. 4, B and C). Moreover, we detected a reduction in FGF2, IL-6, and IL-8 mRNA in OVCAR-3 cells (Fig. 4D). IL-6 and IL-8 concentrations were unaffected in ES2 and OAW42 cell lines with down-regulated HS6ST expression (data not shown). Expression levels of VEGF165 were unaffected by down-regulation of HS6STs in all cell lines (data not shown).
FIGURE 4.

Down-regulation of HS6ST-1 or HS6ST-2 in ovarian cancer cells causes a reduction in protein and mRNA levels of angiogenic cytokines. A, cytokine levels in OVCAR-3 and OVCAR-5 cell CM without and with HS6ST-1 or HS6ST-2 down-regulation. CM collected from control NS cells and cells expressing shRNAs targeting HS6ST-1 or HS6ST-2 were incubated with RayBio® human cytokine antibody array 3, and the levels of cytokines were visualized by chemiluminescence. B and C, IL-8 (B) and IL-6 (C) protein levels were determined by ELISA in cell lysates (CL) and CM of OVCAR-3 and OVCAR-5 NS, sh6ST1-1, or sh6ST2-1 cells. The data are expressed as pg of IL-8 and IL-6 normalized to 1 mg of total protein and represent the means ± S.D. (n = 2). *, p < 0.0025, ‡, p < 0.05. D, FGF2, IL-6, and IL-8 mRNA levels as determined by real time PCR in OVCAR-3 cells with down-regulated HS6ST-1 or HS6ST-2. The expression in NS cells represents 1. Two independent experiments were performed. Each experiment was performed in triplicate. The data are shown as the means ± S.D.
Next we confirmed the involvement of FGF2, IL-8, and IL-6 in endothelial tubule formation in vitro where HUVEC tubule area when cultured on NHDF monolayer in the presence of control OVCAR-3 CM with or without neutralizing antibodies against FGF2, IL-6, and IL-8 was reduced by 15, 45, and 55%, respectively (Fig. 5, A and B). Combining the neutralizing antibodies against FGF2, IL-8, and IL-6 did not result in the synergistic effect (Fig. 5, A and B). Similar degrees of reduction in tubule area were seen when HUVEC were maintained in CM collected from OVCAR-3 cell lines with down-regulated HS6ST-1 or HS6ST-2 (Fig. 5, A and B), suggesting a correlation between HS 6-O-sulfation, FGF2, IL-8, and IL-6 expression and their effect on endothelial cell functions.
FIGURE 5.

Neutralization of FGF2, IL-6, and IL-8 causes a reduction in HUVEC tubule formation in co-culture with NHDF. A, HUVEC endothelial tube formation as visualized by staining with the antibody recognizing human CD31. The experiment was performed using CM generated by OVCAR-3 nonspecific (NS) cells containing neutralizing antibodies against FGF2 (5 μg/ml), IL-6 (0.5 μg/ml), and IL-8 (0.5 μg/ml) and CM from OVCAR-3 sh6ST1-1 or sh6ST2-1 cells. Normal goat serum was used as a control for antibodies against IL-6 and anti-IL-8 and purified mouse IgG1 as a control for the antibody against FGF2. Scale bars, 100 μm. B, quantification of the tubule area in A. The data are expressed as percentages of the area of anti-CD31 staining per field in NS CM (100%) treatment and represent the means ± S.E. (n = 3). *, p < 0.0025; ‡, p < 0.05.
6-O-Sulfation Levels Regulate EGFR Activation by HB-EGF
We hypothesized that reduced expression of HS6STs and HS 6-O-sulfate content would impact the activity of several receptor tyrosine kinases that are activated by HS-dependent ligands. We used RTK phosphorylation arrays with 71 RTK-specific antibodies to capture the levels of RTK tyrosine phosphorylation. Profiling the RTK phosphorylation in OVCAR-3 control, HS6ST-1 and -2 knockdown cell lines revealed significantly reduced EGFR phosphorylation (Fig. 6A). EGFR can be activated by HB-EGF, and we confirmed that HB-EGF is expressed by OVCAR-3 cells (Fig. 6B). EGF expression was undetectable in all cancer cell lines (data not shown), suggesting that the key activator of EGFR in cancer cells is HB-EGF. EGFR phosphorylation was reduced in cells with reduced HS6ST-2 to the same degree as that produced by the EGFR inhibitor AG1478 or neutralizing anti-HB-EGF antibody (Fig. 6C). None of the treatments or down-regulation of HS6ST-2 had an effect on HB-EGF levels in OVCAR-3 cell CM (Fig. 6B), demonstrating that inhibition of EGFR signaling does not impact HB-EGF transcription and translation. We were interested to investigate whether HB-EGF/EGFR pathway impacted FGF2, IL-8, and IL-6 expression, which was reduced in OVCAR-3 and OVCAR-5 cell lines with down-regulated HS6STs (Fig. 4), thus providing a mechanistic link between reduced 6-O-sulfation, impaired HB-EGF/EGFR signaling, and expression of angiogenic cytokines. Indeed, OVCAR-3 and OVCAR-5 NS cells that were treated with AG1478 or neutralizing anti-HB-EGF antibody showed decreased IL-8 and IL-6 concentrations (Fig. 6, D and E). In addition, the CM collected from OVCAR-3 NS cells treated with AG1478 or HB-EGF neutralizing antibody caused 53 and 46% reduction in the area of HUVEC tubules, respectively, which was comparable with that seen when the assay was performed with OVCAR-3 HS6ST-2 knockdown cell CM (Fig. 6, F and G). In contrast, ES2 and OAW42 cells were independent of HB-EGF/EGFR signaling which, when inhibited, did not affect expression of FGF2, IL-6, and IL-8 in these cells (data not shown). Interestingly, OVCAR-3 and OVCAR-5 cell lines, where HB-EGF/EGFR regulates angiogenic cytokine expression, secreted 2–3-fold higher amounts of HB-EGF (Fig. 6H), suggesting the significance of HB-EGF/EGFR signaling axis in these cells.
FIGURE 6.

Inhibition of HB-EGF/EGFR signaling in ovarian cancer cells reduces IL-8 and IL-6 expression and inhibits endothelial tubule formation. A, levels of phosphorylated EGFR (pEGFR) in OVCAR-3 NS, sh6ST1-1/sh6ST1-2, and sh6ST2-1/sh6ST2-2 cell lysates as demonstrated by receptor tyrosine kinase phosphorylation antibody arrays. Densitometric examination showed a reduction in phosphorylated EGFR in OVCAR-3 cells with down-regulated HS6ST-1 and HS6ST-2 by 26 and 32%, respectively. B, HB-EGF levels in CM generated by OVCAR-3 NS cells, OVCAR-3 NS cells treated with AG1478 (1 μm), OVCAR-3 NS cells treated with neutralizing anti-HB-EGF antibody (1 μg/ml), and OVCAR-3 sh6ST2-1 cells were analyzed by ELISA. HB-EGF levels are expressed as pg/ml and represent the means ± S.D. derived from two independent experiments, each performed in duplicate. *, p < 0.03. C, pEGFR levels were analyzed by immunoprecipitating (IP) EGFR from untreated OVCAR-3 NS cells, OVCAR-3 NS cells treated with EGFR inhibitor AG1478 (1 μm) or neutralizing anti-HB-EGF antibody (1 μg/ml) and OVCAR-3 cells with down-regulated HS6ST-2 (sh6ST2-1). Western blotting was performed using the antibody against phosphorylated EGFR (Y1173). D, IL-8 concentrations in CM generated by OVCAR-3 and OVCAR-5 NS cells treated as in B and C. The data represent the means ± S.D. (n = 2). *, p < 0.006; ‡, p < 0.02. E, IL-6 concentrations in CM generated by OVCAR-3 and OVCAR-5 NS cells treated as in B and C. Each of the two independent experiments was performed in duplicate. The data represent the means ± S.D. (n = 2). ‡, p < 0.05. F, staining for human CD31 shows HUVEC tubule formation in a co-culture assay with NHDF in the presence of CM generated by OVCAR-3 NS cells, OVCAR-3 NS cells treated with AG1478 (1 μg/ml) or anti-HB-EGF antibody (1 μg/ml), and OVCAR-3 sh6ST2-1 cells. Scale bars, 100 μm. G, quantification of the effect of CM treatment shown in F. The area of staining for CD31 per field as determined using ImageJ software is shown. The data show the means (± S.E.) derived from three independent experiments, each performed in duplicate. *, p < 0.006. H, HB-EGF concentrations in CM generated by ovarian cancer cell lines were determined by ELISA. Two independent experiments were performed, each in duplicate. The data are shown as the means ± S.D. (n = 2). I, competition of the binding for HB-EGF to OVCAR-3 NS cell HS with unmodified or de-6-O-sulfated porcine intestinal mucosal HS. The control, which is expressed as 100%, represents HB-EGF binding to OVCAR-3 NS HS in the absence of competitors. The data show the percentages of HB-EGF bound to OVCAR-3 HS in the presence of increasing concentrations of the competitors and represent the means (± S.D.) derived from two independent experiments.
Next we investigated whether reduced 6-O-sulfation affects binding of HB-EGF to OVCAR-3 NS cell HS. As shown in Fig. 6I, competition of HB-EGF binding to OVCAR-3 cell HS was ∼2.5-fold stronger with porcine intestinal mucosa HS than with its de-6-O-sulfated variant, suggesting that 6-O-sulfation is required for optimal binding of HB-EGF. Together our data demonstrate that 6-O-sulfation levels that are determined by the expression of HS6STs are critical for HB-EGF-dependent EGFR activation, which induces expression of angiogenic cytokines in a subset of ovarian cancer cell lines.
Ovarian Cancer Cell HS 6-O-Sulfation Levels Regulate Tumor Growth
Because reduction in expression of HS6STs and 6-O-sulfation levels in ovarian cancer cells inhibited endothelial cell functions in a paracrine manner in vitro, we investigated the growth of OVCAR-3 subcutaneous implants expressing unmodified and modified HS. An approximate 21-day delay in the appearance of tumor nodules was observed when HS6ST-2 was down-regulated (Fig. 7A). Moreover, HS6ST-2 knockdown tumors of initial volume 50 mm3 were 42% smaller after 20 days growth (Fig. 7A). HS6ST-2 knockdown caused a 54% reduction in tumor microvessel density (Fig. 7, B and C) and a 70% reduction in the number of mature vessels positive for staining against α-SMA (Fig. 7, D and E). In this model, up to 20% of vessels lacked mural cell coverage in tumor xenografts where HS6ST-2 expression was down-regulated (Fig. 7, D and E, arrows). IL-6, IL-8, and FGF2 protein concentrations in tumor lysates were reduced by 58, 17, and 40%, respectively (Fig. 7, F–H), showing that the effects on angiogenic cytokine profiles are maintained in vivo. These data show that 6-O-sulfation exerted by HS6STs in a subset of ovarian cancer cell lines is a powerful regulator of angiogenesis through HB-EGF/EGFR signaling, which regulates the levels and activity of angiogenic cytokines.
FIGURE 7.

Down-regulation of HS6ST-2 affects tumor growth through impaired angiogenesis. A, OVCAR-3 parental cells, OVCAR-3 cells expressing NS shRNA (NS), and OVCAR-3 cells with down-regulated HS6ST-2 (sh6ST2-1) were grown as xenografts in NSG mice, and tumor volume was measured for 110 days. The data are expressed as the means ± S.E. (n = 5 xenografts). B, OVCAR-3 xenograft sections were stained for mouse CD31 (green) to visualize the infiltration of host vasculature and Hoechst 33342 (blue) to detect nuclei. Scale bars show 100 μm. C, evaluation of blood vessel density was performed with ImageJ program where the images were analyzed for CD31 staining. The number of vessels per normalized area was calculated and expressed as the means ± S.E. (n = 5 xenografts). *, p < 0.01. D, xenograft sections were stained for mouse α-SMA (red) and CD31 (green) to visualize blood vessel coverage with mural cells. Nuclei were visualized with Hoechst 33342 (blue). White arrows show CD31-positive blood vessels that lack α-SMA staining. Scale bars represent 100 μm. E, average number of vessels positive for mouse α-SMA staining was evaluated using the ImageJ program. The means ± S.E. (n = 5) are shown. *, p < 0.05. F–H, IL-6 (F), IL-8 (G), and FGF2 (H) protein levels in OVCAR-3, OVCAR-3 NS, and OVCAR-3 sh6ST2-1 xenograft lysates as determined by ELISA. Data show pg of cytokine normalized to 1 mg of total protein and represent the means ± S.E. (n = 5). *, p < 0.02.
DISCUSSION
Multiple angiogenic cytokines require HS to enable effective signaling through their cognate receptors. We identified a novel mechanism for governing angiogenesis effected by ovarian cancer cells. This involves HS 6-O-sulfation-dependent HB-EGF-induced signaling through EGFR, which impacts the concentration of angiogenic cytokines. We show that reduced HS 6-O-sulfation impacts FGF2, IL-6, and IL-8 expression in ovarian cancer cells with consequent effects on endothelial signaling and tubule formation in vitro and reduced tumor growth in vivo. Together these findings identify a new paracrine mechanism for tumor cell HS-dependent regulation of angiogenesis (Fig. 8).
FIGURE 8.
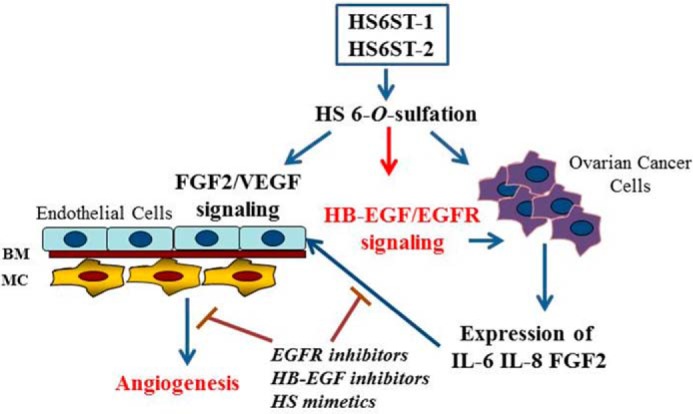
A model of an autocrine and a paracrine regulation of ovarian cancer angiogenesis by HS6STs. The data generated in this study and our previous study (26) show that HS with reduced 6-O-sulfation directly inhibits FGF2 and VEGF165 ability to signal through endothelial cell receptors and negatively impacts HB-EGF/EGFR signaling and expression of angiogenic cytokines in ovarian cancer cells. BM, basement membrane; MC, mural cells.
Our previous study demonstrated that down-regulation of HS6ST-1 or HS6ST-2 in endothelial cells led to a significant impairment in FGF2- and VEGF165-dependent angiogenic functions by cell released inhibitory HS fragments (26), therefore highlighting the significance of a paracrine and an autocrine mechanism through which HS can regulate tumor angiogenesis (Fig. 8). Because in both our studies the reduction of 6-O-sulfates in endothelial and ovarian cancer cells was ∼30–50%, the potential for HS6STs to act as a target for novel anti-angiogenic agents appears significant. The relevance of endothelial cell HS sulfation in tumor angiogenesis has been highlighted in another study where deletion of endothelial N-acetylglucosamine N-deacetylase/N-sulfotransferase 1 (Ndst1) resulted in decreased glucosamine N- and 6-O-sulfation and reduced xenograft tumor growth through defective tumor angiogenesis (29). Because Sulf-1 is diminished or lost in ∼75% of ovarian cancers (22), the increase in 6-O-sulfation is advantageous for the growth of ovarian tumors. Therefore, targeting HS6STs in ovarian cancer would be a good strategy to inhibit tumor-associated angiogenesis.
We found that cell lines expressing a single isoform of HS6ST (ES2 and OVCAR-5) displayed half the level of 6-O-sulfation than that observed in cell lines with both HS6ST isoforms (OVCAR-3 and OAW42). Moreover, 6-O-sulfation levels did not depend on expression of Sulfs, suggesting that HS6ST-1 and -2 act in a synergistic nonredundant manner. This also suggests a complex relationship between the rates of 6-O-sulfation by HS6STs and de-6-O-sulfation by Sulfs and activities of these enzymes in cells. Although expression of Sulfs has not impacted the overall 6-O sulfate levels in cell lines expressing a single isoform of HS6ST, for example ES2 and OVCAR-5 cells, it is possible that HS domain structure in these cell lines is very different because of expression of Sulfs in OVCAR-5, but not ES2, cells.
Our data demonstrate that the level of 6-O-sulfation is an important determinant for HB-EGF signaling through EGFR. We show that HS 6-O-sulfation level regulates HB-EGF activity through two lines of evidence: 1) 6-O-sulfates are required for the effectiveness of HB-EGF binding to HS and 2) reduction of 6-O-sulfate content in cancer cells affects EGFR phosphorylation in the absence of EGF. The structural complexity defined by differential sulfation patterns and domain structure within HS enables growth factors, such as FGF2 and HB-EGF, to bind to a large number of nonspecific sites in HS with low affinity, but more significantly, to a small number of nonoverlapping specific sites with high affinity (30). Although HB-EGF can use diverse HS sequences with variable affinity and selectivity, our data suggest that a level of 6-O-sulfation plays a major role in regulating HB-EGF activity.
EGFR-dependent expression of FGF2 and IL-6 has been reported in other cell lines, suggesting a more universal mechanism for EGFR-dependent regulation of the angiogenic program. For example, HB-EGF induced FGF2 transcription and protein production in aortic smooth muscle cells (31), whereas EGFR signaling was linked to production and release of IL-6 through transcriptional up-regulation in human lung adenocarcinomas (32). Recent study has reported an IL-6-correlated gene signature in epithelial ovarian cancers that among other genes included IL-8 and HB-EGF, thus highlighting the relationship between these cytokines in ovarian cancer (33). IL-6 and IL-8 are also important contributors to ovarian cancer angiogenesis, as demonstrated in preclinical models (34–36). A few preclinical studies demonstrated the efficacy of different HB-EGF inhibitors in the reduction of ovarian tumor growth when administered alone or in combination with paclitaxel (37, 38). Thus modulation of expression of multiple angiogenic cytokines through HB-EGF represents an attractive opportunity to target ovarian tumor angiogenesis.
Despite the significance of HB-EGF/EGFR pathway, other pathways may also impact FGF2, IL-8, and IL-6 expression. The ability of HS to regulate the expression and function of HB-EGF, FGF2, IL-8, and IL-6 presents an opportunity to target these cytokines with HS mimetics. We have developed an efficient chemical synthesis that generates synthetic oligosaccharides with specific sulfation patterns (39–41) and characterized structure-inhibition relationships for FGF2 and VEGF165 (18). Our work has demonstrated a feasibility of designing structurally distinct synthetic HS mimetics that target multiple angiogenic cytokines. This presents a unique opportunity to design HS sequences targeting HB-EGF, FGF2, IL-8, IL-6, and VEGF165. Such a strategy may result in more efficient inhibition of tumor angiogenesis than the targeting a single molecule, such as VEGF165, with anti-angiogenic drugs that are currently used for the treatment of ovarian cancer with limited efficacy.
Acknowledgments
We thank Drs. K. Lawrenson and S. Gayther at the University of Southern California for providing immortalized ovarian surface epithelial cells.
Footnotes
- FGF
- fibroblast growth factor
- HS
- heparan sulfate
- HS6ST
- heparan sulfate 6-O-sulfotransferase
- Sulf
- 6-O-endosulfatase
- HB-EGF
- heparin-binding EGF-like growth factor
- EGFR
- EGF receptor
- VEGFR-2
- VEGF receptor
- FGFR
- FGF receptor
- SDF-1
- stromal cell-derived factor 1
- HUVEC
- human umbilical vein endothelial cells
- NHDF
- normal human dermal fibroblasts
- SMA
- smooth muscle actin
- RTK
- receptor tyrosine kinase
- ΔUA
- uronic acid
- 2S
- 2-O-sulfate
- GlcNS
- N-sulfated glucosamine
- 6S
- 6-O-sulfate
- PaSMC
- pulmonary artery smooth muscle cell
- NHDF
- normal human dermal fibroblast
- CM
- conditioned medium
- SAB
- standard assay buffer
- NSG
- NOD scid gamma
- NOD
- non-obese diabetic
- BM
- basement membrane
- MC
- mural cells.
REFERENCES
- 1. Burger R. A., Brady M. F., Bookman M. A., Fleming G. F., Monk B. J., Huang H., Mannel R. S., Homesley H. D., Fowler J., Greer B. E., Boente M., Birrer M. J., Liang S. X., and Gynecologic Oncology Group (2011) Incorporation of bevacizumab in the primary treatment of ovarian cancer. N. Engl. J. Med. 365, 2473–2483 [DOI] [PubMed] [Google Scholar]
- 2. Perren T. J., Swart A. M., Pfisterer J., Ledermann J. A., Pujade-Lauraine E., Kristensen G., Carey M. S., Beale P., Cervantes A., Kurzeder C., du Bois A., Sehouli J., Kimmig R., Stähle A., Collinson F., Essapen S., Gourley C., Lortholary A., Selle F., Mirza M. R., Leminen A., Plante M., Stark D., Qian W., Parmar M. K., Oza A. M., and ICON7 Investigators (2011) A phase 3 trial of bevacizumab in ovarian cancer. N. Engl. J. Med. 365, 2484–2496 [DOI] [PubMed] [Google Scholar]
- 3. Aghajanian C., Blank S. V., Goff B. A., Judson P. L., Teneriello M. G., Husain A., Sovak M. A., Yi J., Nycum L. R. (2012) OCEANS: a randomized, double-blind, placebo-controlled phase III trial of chemotherapy with or without bevacizumab in patients with platinum-sensitive recurrent epithelial ovarian, primary peritoneal, or fallopian tube cancer. J. Clin. Oncol. 30, 2039–2045 [DOI] [PMC free article] [PubMed] [Google Scholar]
- 4. Pye D. A., Vivès R. R., Hyde P., Gallagher J. T. (2000) Regulation of FGF-1 mitogenic activity by heparan sulfate oligosaccharides is dependent on specific structural features: differential requirements for the modulation of FGF-1 and FGF-2. Glycobiology 10, 1183–1192 [DOI] [PubMed] [Google Scholar]
- 5. Guimond S., Maccarana M., Olwin B. B., Lindahl U., Rapraeger A. C. (1993) Activating and inhibitory heparin sequences for FGF-2 (basic FGF). Distinct requirements for FGF-1, FGF-2, and FGF-4. J. Biol. Chem. 268, 23906–23914 [PubMed] [Google Scholar]
- 6. Pye D. A., Vives R. R., Turnbull J. E., Hyde P., Gallagher J. T. (1998) Heparan sulfate oligosaccharides require 6-O-sulfation for promotion of basic fibroblast growth factor mitogenic activity. J. Biol. Chem. 273, 22936–22942 [DOI] [PubMed] [Google Scholar]
- 7. Jastrebova N., Vanwildemeersch M., Lindahl U., Spillmann D. (2010) Heparan sulfate domain organization and sulfation modulate FGF-induced cell signaling. J. Biol. Chem. 285, 26842–26851 [DOI] [PMC free article] [PubMed] [Google Scholar]
- 8. Robinson C. J., Mulloy B., Gallagher J. T., Stringer S. E. (2006) VEGF165-binding sites within heparan sulfate encompass two highly sulfated domains and can be liberated by K5 lyase. J. Biol. Chem. 281, 1731–1740 [DOI] [PubMed] [Google Scholar]
- 9. Schlorke D., Thomas L., Samsonov S. A., Huster D., Arnhold J., Pichert A. (2012) The influence of glycosaminoglycans on IL-8-mediated functions of neutrophils. Carbohydr. Res. 356, 196–203 [DOI] [PubMed] [Google Scholar]
- 10. Pichert A., Samsonov S. A., Theisgen S., Thomas L., Baumann L., Schiller J., Beck-Sickinger A. G., Huster D., Pisabarro M. T. (2012) Characterization of the interaction of interleukin-8 with hyaluronan, chondroitin sulfate, dermatan sulfate and their sulfated derivatives by spectroscopy and molecular modeling. Glycobiology 22, 134–145 [DOI] [PMC free article] [PubMed] [Google Scholar]
- 11. Amara A., Lorthioir O., Valenzuela A., Magerus A., Thelen M., Montes M., Virelizier J. L., Delepierre M., Baleux F., Lortat-Jacob H., Arenzana-Seisdedos F. (1999) Stromal cell-derived factor-1α associates with heparan sulfates through the first β-strand of the chemokine. J. Biol. Chem. 274, 23916–23925 [DOI] [PubMed] [Google Scholar]
- 12. Uchimura K., Morimoto-Tomita M., Bistrup A., Li J., Lyon M., Gallagher J., Werb Z., Rosen S. D. (2006) HSulf-2, an extracellular endoglucosamine-6-sulfatase, selectively mobilizes heparin-bound growth factors and chemokines: effects on VEGF, FGF-1, and SDF-1. BMC Biochem. 7, 2. [DOI] [PMC free article] [PubMed] [Google Scholar]
- 13. Mummery R. S., Rider C. C. (2000) Characterization of the heparin-binding properties of IL-6. J. Immunol. 165, 5671–5679 [DOI] [PubMed] [Google Scholar]
- 14. Gallagher JT. (2006) Multiprotein signaling complexes: regional assembly on heparan sulfate. Biochem. Soc. Trans. 34, 438–441 [DOI] [PubMed] [Google Scholar]
- 15. Esko J. D., Lindahl U. (2001) Molecular diversity of heparan sulfate. J. Clin. Invest. 108, 169–173 [DOI] [PMC free article] [PubMed] [Google Scholar]
- 16. Spillmann D., Witt D., Lindahl U. (1998) Defining the interleukin-8-binding domain of heparan sulfate. J. Biol. Chem. 273, 15487–15493 [DOI] [PubMed] [Google Scholar]
- 17. Ashikari-Hada S., Habuchi H., Sugaya N., Kobayashi T., Kimata K. (2009) Specific inhibition of FGF-2 signaling with 2-O-sulfated octasaccharides of heparan sulfate. Glycobiology 19, 644–654 [DOI] [PubMed] [Google Scholar]
- 18. Cole C. L., Hansen S. U., Baráth M., Rushton G., Gardiner J. M., Avizienyte E., Jayson G. C. (2010) Synthetic heparan sulfate oligosaccharides inhibit endothelial cell functions essential for angiogenesis. PLoS One 5, e11644. [DOI] [PMC free article] [PubMed] [Google Scholar]
- 19. Sugahara K., Kitagawa H. (2002) Heparin and heparan sulfate biosynthesis. IUBMB Life 54, 163–175 [DOI] [PubMed] [Google Scholar]
- 20. Habuchi H., Tanaka M., Habuchi O., Yoshida K., Suzuki H., Ban K., Kimata K. (2000) The occurrence of three isoforms of heparan sulfate 6-O-sulfotransferase having different specificities for hexuronic acid adjacent to the targeted N-sulfoglucosamine. J. Biol. Chem. 275, 2859–2868 [DOI] [PubMed] [Google Scholar]
- 21. Ai X., Do A. T., Kusche-Gullberg M., Lindahl U., Lu K., Emerson C. P., Jr. (2006) Substrate specificity and domain functions of extracellular heparan sulfate 6-O-endosulfatases, QSulf1 and QSulf2. J. Biol. Chem. 281, 4969–4976 [DOI] [PubMed] [Google Scholar]
- 22. Lai J., Chien J., Staub J., Avula R., Greene E. L., Matthews T. A., Smith D. I., Kaufmann S. H., Roberts L. R., Shridhar V. (2003) Loss of HSulf-1 up-regulates heparin-binding growth factor signaling in cancer. J. Biol. Chem. 278, 23107–23117 [DOI] [PubMed] [Google Scholar]
- 23. Khurana A., Beleford D., He X., Chien J., Shridhar V. (2013) Role of heparan sulfatases in ovarian and breast cancer. Am. J. Cancer Res. 3, 34–45 [PMC free article] [PubMed] [Google Scholar]
- 24. Narita K., Staub J., Chien J., Meyer K., Bauer M., Friedl A., Ramakrishnan S., Shridhar V. (2006) HSulf-1 inhibits angiogenesis and tumorigenesis in vivo. Cancer Res. 66, 6025–6032 [DOI] [PubMed] [Google Scholar]
- 25. Phillips J. J., Huillard E., Robinson A. E., Ward A., Lum D. H., Polley M. Y., Rosen S. D., Rowitch D. H., Werb Z. (2012) Heparan sulfate sulfatase SULF2 regulates PDGFRα signaling and growth in human and mouse malignant glioma. J. Clin. Invest. 122, 911–922 [DOI] [PMC free article] [PubMed] [Google Scholar]
- 26. Ferreras C., Rushton G., Cole C. L., Babur M., Telfer B. A., van Kuppevelt T. H., Gardiner J. M., Williams K. J., Jayson G. C., Avizienyte E. (2012) Endothelial heparan sulfate 6-O-sulfation levels regulate angiogenic responses of endothelial cells to FGF2 and VEGF. J. Biol. Chem. 287, 36132–36146 [DOI] [PMC free article] [PubMed] [Google Scholar]
- 27. Backen A. C., Cole C. L., Lau S. C., Clamp A. R., McVey R., Gallagher J. T., Jayson G. C. (2007) Heparan sulfate synthetic and editing enzymes in ovarian cancer. Br. J. Cancer 96, 1544–1548 [DOI] [PMC free article] [PubMed] [Google Scholar]
- 28. Auersperg N., Wong A. S., Choi K. C., Kang S. K., Leung P. C. (2001) Ovarian surface epithelium: biology, endocrinology, and pathology. Endocr. Rev. 22, 255–288 [DOI] [PubMed] [Google Scholar]
- 29. Fuster M. M., Wang L., Castagnola J., Sikora L., Reddi K., Lee P. H., Radek K. A., Schuksz M., Bishop J. R., Gallo R. L., Sriramarao P., Esko J. D. (2007) Genetic alteration of endothelial heparan sulfate selectively inhibits tumor angiogenesis. J. Cell Biol. 177, 539–549 [DOI] [PMC free article] [PubMed] [Google Scholar]
- 30. Chu C. L., Goerges A. L., Nugent M. A. (2005) Identification of common and specific growth factor binding sites in heparan sulfate proteoglycans. Biochemistry 44, 12203–12213 [DOI] [PubMed] [Google Scholar]
- 31. Peifley K. A., Alberts G. F., Hsu D. K., Feng S. L., Winkles J. A. (1996) Heparin-binding epidermal growth factor-like growth factor regulates fibroblast growth factor-2 expression in aortic smooth muscle cells. Circ. Res. 79, 263–270 [DOI] [PubMed] [Google Scholar]
- 32. Gao S. P., Mark K. G., Leslie K., Pao W., Motoi N., Gerald W. L., Travis W. D., Bornmann W., Veach D., Clarkson B., Bromberg J. F. (2007) Mutations in the EGFR kinase domain mediate STAT3 activation via IL-6 production in human lung adenocarcinomas. J. Clin. Invest. 117, 3846–3856 [DOI] [PMC free article] [PubMed] [Google Scholar]
- 33. Pinciroli P., Alberti C., Sensi M., Canevari S., Tomassetti A. (2013) An IL-6-correlated signature in serous epithelial ovarian cancer associates with growth factor response. BMC Genomics 14, 508–521 [DOI] [PMC free article] [PubMed] [Google Scholar]
- 34. Guo Y., Xu F., Lu T., Duan Z., Zhang Z. (2012) Interleukin-6 signaling pathway in targeted therapy for cancer. Cancer Treat. Rev. 38, 904–910 [DOI] [PubMed] [Google Scholar]
- 35. Kulbe H., Chakravarty P., Leinster D. A., Charles K. A., Kwong J., Thompson R. G., Coward J. I., Schioppa T., Robinson S. C., Gallagher W. M., Galletta L., Australian Ovarian Cancer Study Group, Salako M. A., Smyth J. F., Hagemann T., Brennan D. J., Bowtell D. D., Balkwill F. R. (2012) A dynamic inflammatory cytokine network in the human ovarian cancer microenvironment. Cancer Res. 72, 66–75 [DOI] [PMC free article] [PubMed] [Google Scholar]
- 36. Merritt W. M., Lin Y. G., Spannuth W. A., Fletcher M. S., Kamat A. A., Han L. Y., Landen C. N., Jennings N., De Geest K., Langley R. R., Villares G., Sanguino A., Lutgendorf S. K., Lopez-Berestein G., Bar-Eli M. M., Sood A. K. (2008) Effect of interleukin-8 gene silencing with liposome-encapsulated small interfering RNA on ovarian cancer cell growth. J. Natl. Cancer Inst. 100, 359–372 [DOI] [PMC free article] [PubMed] [Google Scholar]
- 37. Tsujioka H., Yotsumoto F., Hikita S., Ueda T., Kuroki M., Miyamoto S. (2011) Targeting the heparin-binding epidermal growth factor-like growth factor in ovarian cancer therapy. Curr. Opin. Obstet. Gynecol. 23, 24–30 [DOI] [PubMed] [Google Scholar]
- 38. Yagi H., Yotsumoto F., Sonoda K., Kuroki M., Mekada E., Miyamoto S. (2009) Synergistic anti-tumor effect of paclitaxel with CRM197, an inhibitor of HB-EGF, in ovarian cancer. Int. J. Cancer 124, 1429–1439 [DOI] [PubMed] [Google Scholar]
- 39. Hansen S. U., Baráth M., Salameh B. A., Pritchard R. G., Stimpson W. T., Gardiner J. M., Jayson G. C. (2009) Scalable synthesis of l-iduronic acid derivatives via stereocontrolled cyanohydrin reaction for synthesis of heparin-related disaccharides. Org. Lett. 11, 4528–4531 [DOI] [PubMed] [Google Scholar]
- 40. Hansen S. U., Miller G. J., Baráth M., Broberg K. R., Avizienyte E., Helliwell M., Raftery J., Jayson G. C., Gardiner J. M. (2012) Synthesis and scalable conversion of l-iduronamides to heparin-related di- and tetrasaccharides. J. Org. Chem. 77, 7823–7843 [DOI] [PubMed] [Google Scholar]
- 41. Hansen S. U., Miller G. J., Jayson G. C., Gardiner J. M. (2013) First gram-scale synthesis of a heparin-related dodecasaccharide. Org. Lett. 15, 88–91 [DOI] [PubMed] [Google Scholar]