

Background: Voltage-gated K+ (Kv) channels are localized in specific dendritic subcompartments of neurons to regulate dendritic excitability.
Results: Dendritic Kv channels are sorted and trafficked in distinct populations of post-Golgi transport vesicles.
Conclusion: Sorting of Kv channels and their subsequent trafficking by unique mechanisms are crucial for their specific localizations within dendrites.
Significance: Our study reveals the existence of novel subcompartment-specific trafficking pathways for dendritic ion channels.
Keywords: Actin, Golgi, Intracellular Trafficking, Ion Channels, Myosin, Protein Sorting, Myosin
Abstract
Proper membrane localization of ion channels is essential for the function of neuronal cells. Particularly, the computational ability of dendrites depends on the localization of different ion channels in specific subcompartments. However, the molecular mechanisms that control ion channel localization in distinct dendritic subcompartments are largely unknown. Here, we developed a quantitative live cell imaging method to analyze protein sorting and post-Golgi vesicular trafficking. We focused on two dendritic voltage-gated potassium channels that exhibit distinct localizations: Kv2.1 in proximal dendrites and Kv4.2 in distal dendrites. Our results show that Kv2.1 and Kv4.2 channels are sorted into two distinct populations of vesicles at the Golgi apparatus. The targeting of Kv2.1 and Kv4.2 vesicles occurred by distinct mechanisms as evidenced by their requirement for specific peptide motifs, cytoskeletal elements, and motor proteins. By live cell and super-resolution imaging, we identified a novel trafficking machinery important for the localization of Kv2.1 channels. Particularly, we identified non-muscle myosin II as an important factor in Kv2.1 trafficking. These findings reveal that the sorting of ion channels at the Golgi apparatus and their subsequent trafficking by unique molecular mechanisms are crucial for their specific localizations within dendrites.
Introduction
The somatodendritic compartment of neurons receives and integrates incoming synaptic information. These physiological processes are underpinned by a number of receptors and voltage-gated ion channels that are targeted specifically to this compartment. The highly controlled expression of receptors and ion channels and their accurate positioning within the dendrites are therefore important for dendritic computation. However, despite this importance, the mechanisms underlying intracellular trafficking and precise targeting of these molecules remain poorly understood.
Previous studies suggest that membrane proteins localized in dendrites are selectively delivered from the soma to the dendrites by vesicular transport (1, 2) and are prevented from entering the axon at the axon initial segment (3, 4). However, it is still uncertain how receptors and ion channels are targeted to more confined areas within the dendrites, such as proximal dendrites, distal dendrites, and dendritic spines (5).
In the present study, we hypothesized that, within dendrites, multiple biosynthetic trafficking mechanisms exist to target membrane proteins to different and specific subcompartments. To test this hypothesis, we focused on Kv2.13 and Kv4.2 channels based on their distinct localizations in dendrites. Kv2.1 channels are widely expressed in the mammalian brain where they exhibit restricted localization on soma and proximal parts of the dendrites (6). In contrast, Kv4.2 channels are expressed in distal parts of the dendrites with increasing expression levels from the soma (7). These Kv channels, therefore, serve as excellent model proteins to study targeting to different subcompartments of neuronal dendrites (8).
We first developed quantitative live cell imaging methods to investigate whether different ion channels are sorted into distinct transport vesicles at the Golgi apparatus. Using Kv channels tagged with fluorescent proteins, we here demonstrate a novel approach to synchronize the release of transport vesicles from the Golgi apparatus by a modified temperature arrest method. With this approach, we uncovered that Kv2.1 and Kv4.2 channels are sorted into different types of transport vesicles, which display different movement dynamics and distributions. The specific sorting into vesicles was found to be dictated by previously reported peptide targeting motifs present in Kv2.1 (9) and Kv4.2 (10). Quantitative analysis revealed that the differential targeting of Kv2.1 and Kv4.2 post-Golgi transport vesicles is mediated by distinct molecular mechanisms. Particularly, we identified a novel actin-myosin-based trafficking mechanism for Kv2.1 of which disruption caused a marked change in the expression of the channel. Our imaging study, therefore, provides insight into how dendritic ion channels are localized to specific subcompartments in neuronal cells. The novel imaging technique introduced here also provides a basis for future investigations of vesicular trafficking of a broader spectrum of membrane signaling proteins in neurons.
EXPERIMENTAL PROCEDURES
cDNA Constructs
Kv2.1, Kv4.2, KChIP2, and Kv2.1 S586A cDNAs were generous gifts from Dr. Trimmer. The coding sequences of Kv2.1 and Kv4.2 were cloned into EGFP-C1 and mCherry-C1 vectors from Clontech. Kv2.1 S586A was cloned into the EGFP-C1 vector. mCherry-GalT was generated from Venus-GalT (Addgene, Cambridge, MA). Green fluorescent protein (GFP)-tagged microtubule-associated protein-2C (MAP-2C) was a generous gift from Dr. Kaech (11). The Arf1 Q71I mutant was a generous gift from Dr. Jeyifous but was originally constructed by the El-Husseini laboratory. The dominant negative mutant of nonmuscle myosin IIB was provided by Dr. Takashi Tsuboi. hCD4-hKv7.3CT in pcDNA3.1 was generated as reported (12). Small hairpin RNAs for rat myosin IIB were designed as follows: 1, GGAAGAAAGCGATGGTCAA (196–214 bp in NCBI Reference Sequence accession number NM_031520); 2, GCTGCAGTTTGGAAACATC (1058–1076 bp); and 3, GCGAATGATCCGAGCTTTA (2243–2261 bp). Control small hairpin RNA (shRNA) for luciferase was GTGCGTTGCTAGTACCAAC. All of these sequences were cloned into pBAsi-hU6 Pur vector (Takara Biotechnology, Shiga, Japan) for mammalian expression.
Cell Culture and Transfection
Dissociated cultures of embryonic rat hippocampal neurons (E18) were prepared from female timed pregnant rats as described previously (13) with minor modifications. All animal use was approved by the institutional animal care and use committee. Neurons were transiently transfected at 7–10 days in vitro (DIV) using Lipofectamine 2000 transfection reagent (Invitrogen). In all experiments with GFP-Kv4.2 and mCherry-Kv4.2, we co-expressed the β subunit KChIP2, which is required for efficient export of Kv4.2 from the endoplasmic reticulum (14). For live cell imaging, these plasmids were used at 1 μg/coverslip (diameter, 25 mm). In the experiments with shRNA, neurons were transfected with an shRNA construct (0.25 μg/coverslip) together with a GFP expression vector as a marker (0.5 μg/coverslip).
Drug Experiments
Latrunculin A (Invitrogen) was dissolved in DMSO and added to Hanks' balanced salt solution to a final concentration of 1 μm (0.1% DMSO). Colchicine (Sigma) was also dissolved in DMSO. Neurons were imaged before and 5 min after the treatment. A working solution of blebbistatin (50 μm; Tocris) was prepared from a 50 mm stock solution (in DMSO) by rapidly mixing 2 μl of the stock solution with 300 μl of Hanks' balanced salt solution to prevent the formation of fluorescent precipitates. The solution was briefly centrifuged to remove any remaining precipitates and then added to the imaging medium at 50 μm.
Immunofluorescence Staining
Neurons were fixed in 4% paraformaldehyde, 4% sucrose, PBS and blocked in 4% milk, Tris-buffered saline in the presence of 0.1% Triton X-100 (TBST). Neurons were incubated overnight with primary antibodies and subsequently for 1 h with Alexa Fluor-conjugated IgG-specific secondary antibodies (Invitrogen; 1 μg/ml), both diluted in 4% milk, TBST. Primary antibodies used were anti-MAP-2 mouse monoclonal antibody (Sigma-Aldrich; clone AP-20; 1:2000), rabbit anti-Kv2.1 antiserum (at 1:5000) (15), mouse anti-Kv4.2 monoclonal antibody (K57 from NeuroMab, Davis, CA; 5 μg/ml), and rabbit anti-myosin IIB polyclonal antibody (Covance, Berkeley, CA).
Immunoprecipitation
Brains from adult Wistar rats were homogenized in ice-cold homogenization buffer (10% sucrose, 5 mm EDTA, 2.5 mm EGTA, 10 mm NaCl, 10 mm KCl, 50 mm Tris-HCl, pH 7.4) with protease inhibitors. The postnuclear supernatant (1 mg/ml) was incubated in a solubilization buffer (150 mm NaCl, 1% Triton X-100, 20 mm Tris-HCl, pH 7.9 with protease inhibitors) on ice for 30 min. Extracts were then cleared by centrifugation at 20,000 × g for 10 min to remove insoluble material. The brain lysates were preincubated with Dynabeads-Protein G (Invitrogen) for 1 h at 4 °C with agitation. The precleared lysates were further incubated with 2.0 μg of 1) mouse anti-Kv2.1 monoclonal antibody (K89 from NeuroMab), 2) rabbit anti-myosin IIB polyclonal antibody, 3) mouse anti-Kv2.1 external antibody (K39 from NeuroMab), 4) rabbit anti-Kv4.2 polyclonal antibody (Alomone Laboratory, Israel), or 5) normal rabbit IgG (Santa Cruz Biotechnology, Santa Cruz, CA). Dynabeads-Protein G were added, and the incubation was continued for 2 h. Dynabeads were collected using a magnetic stand and washed four times in the solubilization buffer. Proteins were eluted from the Dynabeads by incubating for 3 min at 70 °C in an SDS sample buffer (2% SDS, 5% 2-mercaptoethanol, 10% glycerol, 62.5 mm Tris-HCl, pH 6.8).
Pulldown Assay
We generated cytoplasmic N- (amino acid residues 1–181) and C-terminal (431–853) fragments of rat Kv2.1 tagged with HaloTag (Promega, Madison, WI) and the DDK tag (DYKDDDDK). These fragments and human non-muscle myosin IIB (MyoIIB) were cloned into pFN18A (Promega) vector for bacterial expression. Escherichia coli Rosetta2 (DE3)/pLysS were transformed with the Kv2.1 fragments or MyoIIB expression vector. Transformed E. coli cells were grown at 30 °C in LB medium. When the culture reached midlog phase, protein expression was induced with 100 mm isopropyl 1-thio-β-d-galactopyranoside for 3 h. Cells were then collected at 10,000 × g for 5 min and then resuspended in a solubilization buffer (25 mm Tris-HCl, pH 7.4, 300 mm NaCl, 1 mg/ml lysozyme, 0.5 mm EDTA, 10 mm 2-mercaptoethanol, 1% Triton X-100, Complete protease inhibitor mixture EDTA-free (Roche Applied Science). After 20-min incubation on ice, MgCl2 (10 mm) and 50 units of Benzonase were added to the lysate followed by 20-min incubation. The soluble fraction was obtained as a supernatant after centrifugation at 20,000 × g for 10 min. A soluble fraction containing either the N- or the C-terminal fragment was incubated with a HaloTag ligand with biotin (PEG-biotin) according to the manufacturer's instruction (Promega). This was then mixed with a bacterial lysate expressing MyoIIB or a lysate from HEK293 cells. The total protein concentration in the reaction mixture was ∼6 mg/ml. After 2-h incubation at room temperature, biotin-labeled proteins were purified using 50 μl of streptavidin magnetic beads (Thermo Scientific, Waltham, MA). Magnetic beads were washed three times with 25 mm Tris-HCl, pH 7.4, 1% Triton X-100, Complete protease inhibitor mixture EDTA-free. Bound proteins were eluted with the SDS sample buffer, separated by 7.5% SDS-PAGE, and then detected by Western blotting using anti-DDK or MyoIIB antibody.
Western Blotting
Proteins were separated in 4–15% SDS-polyacrylamide gels and transferred to PVDF membranes. The membranes were washed, blocked in PBS containing 4% nonfat dry milk for 1 h, and then incubated with primary antibodies overnight in the blocking buffer at room temperature. We used mouse anti-Kv2.1 C-terminal monoclonal antibody (1 μg/ml; K89 from NeuroMab), rabbit anti-myosin IIB polyclonal antibody (1:2,000; Covance), and anti-DDK antibody (1:2,000; Medical and Biological Laboratories Co., Ltd., Japan). The membranes were washed and probed with HRP-conjugated secondary antibodies according to the manufacturer's instructions. Immunoreactive bands were detected with enhanced chemiluminescence (PerkinElmer Life Sciences) and visualized by exposing the membranes to x-ray films (GE Healthcare). NeuroMab antibodies are available from the University of California Davis/National Institutes of Health NeuroMab Facility supported by National Institutes of Health Grant U24NS050606 and maintained by the Department of Neurobiology, Physiology and Behavior, College of Biological Sciences, University of California, Davis.
Temperature Block Procedure and Live Cell Imaging
Cultured neurons were transfected with either GFP-Kv2.1 or GFP-Kv4.2 and non-tagged mCherry, which served as a cell fill dye to access the morphology of neurons and to identify axons. Three hours after transfection, neurons were transferred to dishes with Hanks' balanced salt solution (Invitrogen) containing 10 mm HEPES, pH 7.3 and then incubated at 19.5 °C for 3–5 h. After the temperature block, a coverslip with neurons was transferred to an imaging chamber (Warner Instruments, Hamden, CT) and imaged in Hanks' balanced salt solution prewarmed to 37 °C. The temperature of the imaging solution was kept at 35–37 °C using an Air Stream Incubator (Nevtek, Williamsville, VA), and the chamber temperature was continuously monitored using a probe thermometer (Physitemp, Clifton, NJ). Neurons were visualized under epifluorescence illumination using an interline CCD camera installed on an Axiovert 200M microscope (Zeiss, Thornwood, NY) with a 63× objective lens (1.4 numerical aperture). Time lapse images were obtained with a typical CCD exposure time of 150 ms using Axiovision software. Time lapse images were acquired using either 1- (GFP-Kv2.1) or 5-Hz (GFP-Kv4.2) acquisition rates. We chose cells that had morphological characteristics of pyramidal neurons and of which the axon could be identified by mCherry labeling. Simultaneous dual color imaging was carried out by installing an image splitter (Andor Technology, South Windsor, CT) in front of the CCD camera. Images were transferred as JPEG files to NIH Image software ImageJ.
Image Analysis
The velocity, processivity, and distribution of transport vesicles were analyzed in live cell images. The analysis was restricted to anterograde moving vesicles in dendrites (<100 μm from the soma). We manually tracked individual vesicles for the analysis using the Manual Tracking plug-in in ImageJ. Signal intensity in each image frame was adjusted using a best fit algorithm to compensate for photobleaching and to reduce the background signal as well as to amplify the signal from small vesicles. We chose processes that were thick (>1.5 μm) and distinguishable from the axon in an mCherry image for each imaged neuron. Velocity measurements were performed in the following steps. 1) Mobile vesicular structures in the processes were selected from time lapse image stacks. 2) The tracking was restricted to vesicles that showed at least 1-μm displacement through a minimum of five frames. Intracellular puncta that appeared immobile through the time lapse sequences were not tracked and included in the analysis. 3) The net and maximum velocities of a vesicle were determined as follows.
Dtotal represents the distance the vesicle traveled during the duration for which the vesicle was tracked (ttotal) in Equation 1. Dmax represents the maximum displacement the vesicle showed between two consecutive frames separated by an interval (tinterval) in Equation 2. Velocities of individual vesicles were averaged per neuron, and then these values were averaged among 10 neurons. Alternatively, velocity distributions of all vesicles analyzed were presented. For the measurement of processivity, we determined the distance that vesicles traveled without any cessation of movement. Obtained values were averaged among 10 neurons.
Spatial distribution of vesicles in the dendrites was analyzed as follows. We chose dendrites that were 1) thick, 2) were distinguishable from the axon, and 3) showed their entire length in an image frame. We then measured the signal intensity of GFP along the dendrites, from the base to the tip, using the line profiling function of ImageJ. The signal intensity was divided by that of mCherry to compensate for changes in volume and then plotted against the distance. We then obtained the ratio of the signal intensity near the tip over that at the base of the dendrite. These values (distal enrichment indices) were averaged among 11 neurons and compared between GFP-Kv2.1- and GFP-Kv4.2-expressing neurons.
Image subtraction used to assess the drug effects was performed as follows (see also supplemental Movie 3). First, all image frames of a live cell imaging set were averaged in ImageJ. Then, this average image was subtracted from each image frame to remove signals from the background and immobile structures, like the Golgi apparatus, and to leave only that from mobile vesicles. Maximum projection was then created from the subtracted images to visualize trajectories of transport vesicles. The number of mobile anterograde vesicles that showed more than 1-μm displacement in the dendrites of a cell was manually counted in the subtracted live cell images and averaged among several neurons.
In the experiments with shRNA, images of immunofluorescence staining were acquired with a fixed exposure time. Signal intensity was measured within the soma using ImageJ and expressed as a percentage of the control (average signal intensity in non-transfected neurons).
Photoactivated Localization Microscopy (PALM) Imaging and Analysis
Tracking of individual actin molecules in filamentous actin in living neurons was performed using PALM (16). Cultured hippocampal neurons were transfected with actin tagged with a photoactivatable red fluorescent protein (PA-TagRFP). GFP-tagged markers of the axon initial segment (GFP-AIS) or the proximal dendrites (GFP-Kv2.1) were co-expressed with actin-PA-TagRFP to identify axons and dendrites, respectively. Imaging was conducted on an Olympus IX81 inverted microscope with a 100×/1.45 total internal reflection fluorescence oil immersion objective. The temperature was kept near 37 °C with an objective heater, and the imaging chamber was covered to avoid evaporation. The live cell imaging medium contained 120 mm NaCl, 3 mm KCl, 10 mm HEPES, 2 mm CaCl2, 2 mm MgCl2, and 10 mm glucose, pH 7.35. Fluorescence emission was detected with an iXon DV887ECS-BV back-thinned EM-CCD camera (Andor Technology) placed after the 1.6× magnification optic in the microscope body. The 16.0-μm pixels of the camera thus covered 100 nm in the imaging plane. GFP was excited with a 488 nm argon ion laser and PA-TagRFP with a 568 nm helium-neon laser. Photoactivation of PA-TagRFP was achieved with a SpectraPhysics MaiTai titanium sapphire laser tuned to 405 nm. Before PALM acquisition, GFP-positive neurons were located in total internal reflection fluorescence, and the background red fluorescence was bleached. We acquired time lapse images of red fluorescence actin-PA-TagRFP photoconverted with low intensity 405-nm excitation. The molecules were then imaged during consecutive frames before their stepwise disappearance in a time lapse series of a total of 300–1000 frames. Images of activated molecules were acquired every second (1 Hz) using 150-ms exposure. Molecules were localized by fitting a two-dimensional elliptical Gaussian function to a 9 × 9-pixel array surrounding the peak, and the locations were assembled into tracks using freely available algorithms (17). All subsequent analysis was written in Matlab. To identify potential molecules, the raw data were bandpass-filtered and thresholded to select only high intensity peaks. To ensure that orientation was reliably measured, we limited analysis to molecules that were tracked over distances exceeding 100 nm. The number of tracked molecules was between 36 and 160. To determine the orientation of actin filaments, the net angle of each track (see red tracks from detected actin-PA-TagRFP molecules in Fig. 9E) was determined relative to the axis of either the dendrite or the axon. The angle score was then generated for each angle by computing the cosine of the angle.
FIGURE 9.

Unique motion of Kv2.1 vesicles and the organization of dendritic actin filaments. A, the average processivity of GFP-Kv4.2 vesicles in individual neurons was significantly greater than that of GFP-Kv2.1 (p = 0.006). The horizontal bars indicate the means. B, unidirectional motion of a Kv4.2 vesicle. A single vesicle carrying GFP-Kv4.2 was imaged over 5 s. Positions of the vesicle at different time points are shown in different colors. The arrow indicates the original position of the vesicle at time 0, and the arrowhead indicates the position in the last frame. Scale bar, 5 μm. C, bidirectional motion of Kv2.1 vesicles. Note the net travel distance of ∼1 μm in 18 s. Scale bar, 5 μm. D, determination of actin filament orientation. If a fluorescent actin molecule moves to the left in a filament, the right side of the filament is the plus-end. E, representative result of PALM imaging. Left panel, diffraction-limited image of PA-TagRFP-actin in proximal dendrites. Middle panel, actin molecules with track lengths greater than 100 nm (red dots) are overlaid with GFP-Kv2.1. Scale bars, 2 μm. Right panel, the boxed region in the middle panel is magnified to show the net direction of each actin molecule. Red dots represent the original positions of the actin molecules, and lines indicate the net directions and the net distances. F, directions of motions were determined relative to the axis of the dendrites. Angle scores were calculated as the cosine of these angles. Averaged angle scores obtained in proximal dendrites and AIS are shown. Angle scores were also calculated with the axis rotated 90°. Data are presented with a box plot (the error bars indicate the 10th and 90th percentile). *, p = 0.0002 with analysis of variance.
Statistical Analysis
All data are presented as actual data points, the mean ± S.E., or a frequency distribution. Normality of data was examined by Kolmogorov-Smirnov test. Maximum and net velocities of GFP-Kv2.1 and GFP-Kv4.2 (cell averages) and the processivity were compared by Student's t test (unpaired, two-tailed). Comparison of the numbers of mobile vesicles in drug-treated neurons was done using the paired t test (two-tailed). Mann-Whitney test was used for the comparison of velocity distributions and that of spatial distributions of vesicles in the dendrites (the distal enrichment index). A p value less than 0.05 was considered to be statistically significant in all cases. It should be noted that one-way analysis of variance of velocities of all groups with Tukey post hoc analysis also yielded consistent results. Immunofluorescence data were analyzed with the Kruskal-Wallis test and Dunn's multiple comparison post hoc tests. Actual p values are shown in the text and figure legends except for those smaller than 0.0001 and for post hoc tests. All statistical analyses were carried out with GraphPad Prism software (La Jolla, CA).
RESULTS
Probing Post-Golgi Traffic in Neurons by Live Cell Imaging
To investigate vesicular trafficking of Kv2.1 and Kv4.2 channels in living neurons, we added a GFP tag to the N termini of channel polypeptides and verified their localization in cultured hippocampal neurons. Consistent with the localization of endogenous Kv2.1 and Kv4.2 channels (Fig. 1A), GFP-tagged Kv2.1 and Kv4.2 were targeted to distinct subdomains in the dendrites of neurons (Fig. 1B). It should be noted that GFP-Kv4.2 was co-expressed with KChIP2 because it is trapped in the endoplasmic reticulum without a β subunit (14, 18). GFP-Kv2.1 exhibited a proximal and clustered localization, whereas GFP-Kv4.2 showed uniform dendritic localization toward distal parts of the dendrites (Fig. 1C). Both GFP-Kv2.1 and GFP-Kv4.2 were functionally intact as they elicited the delayed rectifier (Kv2.1) (19) and transient A-type (Kv4.2) K+ currents (18) as expected when expressed in HEK293 cells (Fig. 1D). These findings demonstrate that GFP-tagged Kv2.1 and Kv4.2 are assembled in functional channels and that they are targeted to their respective subcellular locations in cultured neurons.
FIGURE 1.

Validation of GFP-tagged Kv2.1 and Kv4.2 channels for live cell imaging. A, localization of Kv2.1 and Kv4.2 channels endogenously expressed in cultured hippocampal neurons 18 DIV. Scale bar, 20 μm. B, localization of GFP-tagged Kv2.1 and Kv4.2 channels. Neurons were transfected at 10 DIV, fixed at 18 DIV, and immunostained for GFP and MAP-2. Scale bar, 10 μm. C, fluorescence detection of GFP-Kv2.1 (green trace) and GFP-Kv4.2 (red trace) channel expression from base to tip of dendritic branches. D, macroscopic currents of GFP-Kv2.1 and GFP-Kv4.2 recorded from transfected HEK293 cells. Scale, 1 nA and 50 ms.
To investigate protein sorting at the Golgi apparatus, we developed a method by which we could selectively detect and analyze post-Golgi transport vesicles. The principle of the method is as follows (see also Fig. 2A). First, neurons were transfected and allowed to express GFP-tagged channel proteins for 3 h. At this time point, the expression of GFP was barely detectable. Then, neurons were incubated at 19.5 °C at which temperature the exit of membrane proteins from the Golgi apparatus is suppressed. Therefore, newly synthesized GFP-tagged channels would be accumulated in the Golgi apparatus. Indeed, after 3–5 h at 19.5 °C, we observed that GFP-Kv2.1 and GFP-Kv4.2 were highly concentrated in perinuclear organelles positive for a Golgi marker, the N-terminal fragment of galactosyltransferase (amino acids 1–60) tagged with mCherry (mCherry-GalT) as shown in Fig. 2B. This accumulation in the Golgi was not observed in neurons that were not subjected to the low temperature incubation after transfection (Fig. 2C). These results suggest that our temperature block method trapped most of the newly synthesized GFP-Kv2.1 in the Golgi apparatus with minimal levels of the protein in other organelles and in the surface membrane.
FIGURE 2.

A temperature block assay to probe post-Golgi vesicular trafficking of membrane proteins. A, the principle of the method using temperature block. N, nucleus; ER, endoplasmic reticulum. B, effects of the temperature block. Transfected neurons were incubated for 3–5 h at 19.5 °C and imaged at room temperature. The Golgi marker, galactosyltransferase tagged with mCherry (GalT), was co-expressed. C, without the temperature block procedure, GFP-Kv2.1 channels escape to the surface membrane. Neurons were transfected and imaged 5 h later. D, emergence of mobile puncta from the Golgi apparatus. When sorting was restored after the temperature block, mobile puncta emerged from the Golgi apparatus. Time lapse images from GFP-Kv2.1-transfected neurons are shown. E, visualization of mobile puncta. After changing the incubation temperature to 37 °C, GFP-Kv4.2 signal started to invade dendrites but not the axon, indicating the synchronized formation of post-Golgi transport vesicles. The image of cell fill mCherry represents the morphology of the neuron. Scale bars, 10 μm.
We then promoted a synchronized release of GFP-tagged channels from the Golgi apparatus in transport vesicles by shifting the incubation temperature to 37 °C. Analysis of the released vesicles would reveal whether Kv2.1 and Kv4.2 are sorted into distinct pools of transport vesicles at the Golgi apparatus and whether they are trafficked by different mechanisms. To initiate sorting of vesicles from the Golgi after the temperature arrest, we incubated neurons for 15 min at 37 °C and visualized by live cell imaging how GFP-positive puncta appeared (see supplemental Movie 1 (GFP-Kv2.1) and supplemental Movie 2 (GFP-Kv4.2)). Occasionally, we observed puncta emerging directly from perinuclear organelles, presumably the Golgi apparatus (Fig. 2D). The mobile puncta in both GFP-Kv2.1- and GFP-Kv4.2-transfected neurons were transported out from the perinuclear region and into dendrites. However, this was particularly apparent with GFP-Kv4.2 as the vesicles traveled far into dendrites (Fig. 2E).
To test whether these mobile puncta are indeed post-Golgi transport vesicles, we co-expressed a mutant of Arf1 (Arf1 Q71I) that inhibits the release of vesicles from the Golgi apparatus (20, 21). We found that co-expression of Arf1 Q71I dramatically reduced the number of mobile GFP-Kv2.1 and GFP-Kv4.2 puncta. To better visualize the effect, we processed live cell images using an image subtraction method to reveal trajectories of mobile puncta (see Fig. 3A, supplemental Movie 3, and “Experimental Procedures” for the image processing information). Although control neurons exhibited a number of trajectories for both GFP-Kv2.1 (Fig. 3B) and GFP-Kv4.2 (Fig. 3C), neurons co-expressing Arf1 Q71I showed virtually no trajectories, indicating that the mobile puncta are post-Golgi transport vesicles. Taken together, these results suggest that our temperature block method is suitable for probing post-Golgi transport vesicles, which mediate the transport of Kv2.1 and Kv4.2 channels, respectively.
FIGURE 3.

Post-Golgi vesicular trafficking of Kv2.1 and Kv4.2. A, image processing procedure used for the analysis of vesicular motility. First, all image frames of a live cell imaging set (leftmost image) were averaged in ImageJ. This average image (second left image) was then subtracted from each image frame to remove signals from the background and immobile structures, like the Golgi apparatus, and to leave only that from mobile vesicles (second right image). Maximum projection was then created from the subtracted images to visualize trajectories of transport vesicles (rightmost image). B and C, mobile puncta represent post-Golgi transport vesicles. Formation of mobile puncta was inhibited by co-expression of Arf1 Q71I, indicating that these puncta represent post-Golgi transport vesicles. After temperature block, neurons expressing GFP-Kv2.1 (B) and GFP-Kv4.2 (C) were imaged without (Control) or with Arf1 Q71I. By an image subtraction method (see “Experimental Procedures”), trajectories from moving puncta were extracted to represent the effect of Arf1 Q71I. Scale bars, 10 μm.
Distinct Sorting of Kv2.1 and Kv4.2 Channels
We then quantitatively analyzed individual vesicles to determine whether GFP-Kv2.1 and GFP-Kv4.2 are sorted into distinct transport vesicles at the Golgi apparatus. As shown in supplemental Movie 1 (GFP-Kv2.1) and supplemental Movie 2 (GFP-Kv4.2), many GFP-positive vesicles were trafficked in the soma and dendrites (Fig. 4A). We observed that GFP-Kv2.1 vesicles were trafficked in both anterograde and retrograde directions, whereas the majority of GFP-Kv4.2 vesicles appeared anterogradely transported.
FIGURE 4.

Characterization of post-Golgi transport vesicles. A, mobile vesicles appeared after the temperature block. The movements of vesicles in the dendrites are illustrated by merging two image frames separated by a certain interval in two different colors: frame 1 (green) corresponds to time 0, and frame 2 (red) corresponds to 6 and 2 s later for GFP-Kv2.1 and GFP-Kv4.2, respectively. Scale bar, 5 μm. B, maximum and net velocities of vesicles carrying GFP-Kv2.1 and GFP-Kv4.2 in individual neurons. Velocities of individual vesicles were averaged per cell, and then these values were averaged in 10 cells. The horizontal bars indicate the averages. *, p < 0.0001. C, frequency distributions of the maximum and net velocities of GFP-Kv2.1 vesicles and GFP-Kv4.2 vesicles. D and E, velocities of vesicular stomatitis virus G (VSVG) vesicles were measured for comparison with values acquired for Kv2.1 and Kv4.2 vesicles. Scale bar, 10 μm.
GFP-Kv2.1 and GFP-Kv4.2 vesicles appeared to be transported at different velocities. To quantify the difference, we tracked individual transport vesicles through several frames to obtain their movement velocities. The average net and maximum velocities (see “Experimental Procedures” for definitions) of GFP-Kv2.1 vesicles in individual neurons were 0.79 ± 0.04 and 1.09 ± 0.06 μm/s (n = 10 cells), whereas those of GFP-Kv4.2 vesicles were 3.17 ± 0.14 and 3.85 ± 0.13 μm/s (n = 10 cells), respectively (Fig. 4B). The frequency distributions of the net and maximum velocities of GFP-Kv2.1 vesicles were significantly smaller than those of GFP-Kv4.2 vesicles (p < 0.0001, n = 60) (Fig. 4C). These results indicate that GFP-Kv2.1 and GFP-Kv4.2 are sorted into different populations of post-Golgi transport vesicles. We noted that these velocity values are comparable with values reported previously for vesicular carriers (22–25) and with those of vesicular stomatitis virus G (VSVG)-GFP post-Golgi vesicles in our experiments (Fig. 4, D and E).
Next, we investigated the spatial distribution of GFP-Kv2.1 and GFP-Kv4.2 vesicles. The distribution of GFP signal along dendrites was measured in neurons that were incubated for 30 min at 37 °C following the temperature block (Fig. 5A). The fluorescence intensity was normalized to that of co-expressed mCherry for volume correction. Then the intensity in the distal 50-μm segment of the dendrites was divided by that in the proximal 50-μm segment to assess the enrichment of GFP-positive vesicles in distal dendrites. We found that the spatial distribution of GFP-Kv2.1 vesicles was more restricted to the proximal segment than that of GFP-Kv4.2 vesicles as evidenced by the significant difference in the distal enrichment indices between GFP-Kv2.1 and GFP-Kv4.2 vesicles (Fig. 5B). This further indicates that they are sorted and transported in distinct pools of vesicles.
FIGURE 5.

Kv2.1 and Kv4. 2 in distinct transport vesicles. A, spatial distributions of vesicles along the dendrites. Co-expression of GFP-Kv2.1 and GFP-Kv4.2 with cell fill mCherry (red in the lower panels) is shown. Scale bar, 10 μm. B, GFP fluorescence intensity in the dendrites was measured for each channel and normalized to volume changes using mCherry fluorescence. The distal enrichment index was calculated as the normalized fluorescence intensity in the distal 50-μm segment of the dendrite divided by that in the proximal 50-μm segment of the dendrites. The distal enrichment index was significantly higher for GFP-Kv4.2 vesicles than for GFP-Kv2.1 vesicles (*, p = 0.0006; n = 11). Data shown are the means ± S.E. C, GFP-Kv2.1 and mCherry-Kv4.2 in non-overlapping vesicles. The image represents the first frame in the time lapse image of a proximal dendrite. Scale bar, 10 μm. D, the fluorescence intensities of GFP-Kv2.1 and mCherry-Kv4.2 vesicles plotted along a line (30 μm) drawn in the proximal dendrites.
To directly test whether neurons sort Kv2.1 and Kv4.2 channels in different vesicles, we co-expressed mCherry-tagged Kv4.2 with GFP-Kv2.1 for simultaneous dual color live cell imaging. GFP-Kv2.1 and mCherry-Kv4.2 were present in non-overlapping populations of transport vesicles that moved independently of each other (Fig. 5C and supplemental Movie 4). We also measured the fluorescence intensity along a line drawn in a proximal segment of a dendrite (20 μm). Peaks of fluorescence signals corresponding to vesicles containing GFP-Kv2.1 or mCherry-Kv4.2 did not overlap (Fig. 5D). Similar results were obtained with neurons from at least three different cultures (n = 10). It should be noted that only GFP-Kv2.1 vesicles appeared in the axon (Fig. 5C, arrow), consistent with the localization of Kv2.1 in the axon initial segment (9, 26). These data demonstrate that neurons strictly sort GFP-Kv2.1 and mCherry-Kv4.2 into different populations of transport vesicles at the Golgi apparatus.
Specific Sorting of Kv2.1 and Kv4.2 Dictated by Peptide Motifs
Previous studies have identified peptide motifs in the cytoplasmic C-terminal tails of Kv2.1 and Kv4.2 in which mutations result in mislocalization of the channels without apparent changes in their surface expression (9, 10). However, it is not known how these peptide motifs contribute to the specific localizations of Kv2.1 and Kv4.2 in dendrites. We hypothesized that mutation in Kv2.1 and Kv4.2 peptide motifs would alter their localizations due to disrupted sorting and subsequent post-Golgi trafficking. To test this, we analyzed Kv2.1 S586A (9) and Kv4.2 LL/AV (10) tagged with GFP. Kv2.1 S586A mutation resulted in uniform localization of the channel throughout the dendritic membrane (9) unlike the clustered localization of wild-type Kv2.1 in the soma and proximal dendrites (Fig. 6A). In the Kv4.2 LL/AV mutant, the replacement of the dileucine targeting motif with Ala and Val resulted in both axonal and somatodendritic localization (Fig. 6B) (10).
FIGURE 6.
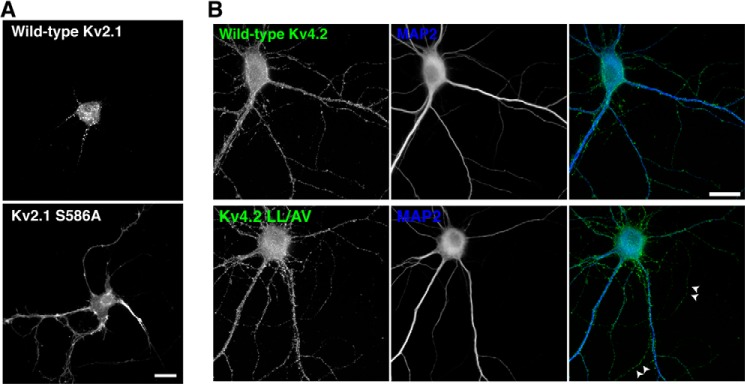
Mislocalization of Kv2.1 and Kv4.2 mutants. A, the restricted and clustered localization of GFP-Kv2.1 (upper) is disrupted for the targeting mutant GFP-Kv2.1 S586A (lower). Neurons were transfected at 10 DIV, fixed at 18 DIV, and immunostained for GFP. Scale bar, 10 μm. B, mutation of the dileucine motif in Kv4.2 channels results in both axonal and dendritic localization. Neurons were transfected at 10 DIV, fixed at 18 DIV, and immunostained for GFP and MAP-2. Arrows point to the MAP-2-negative axonal compartment. Scale bar, 20 μm.
We performed live cell imaging of these mutant channel subunits using our temperature block method to assess their sorting and post-Golgi traffic (supplemental Movies 5 and 6). We found that the vesicles carrying GFP-Kv2.1 S586A showed a marked change in the velocity distribution as compared with that of wild-type GFP-Kv2.1. The maximum (Fig. 7A) velocity distribution was significantly greater from that of wild-type GFP-Kv2.1 vesicles (p < 0.0001, n = 60). In addition, average maximum velocity in individual neurons (3.12 ± 0.20 μm/s) was significantly greater (p < 0.0001, n = 10). In contrast, the velocity distribution of the vesicles carrying GFP-Kv4.2 LL/AV was significantly (p = 0.0006, n = 60) shifted to slower velocities than that of wild-type Kv4.2 vesicles (Fig. 7A). The average maximum velocity in individual neurons (3.22 ± 0.16 μm/s) was also significantly slower (p = 0.006, n = 10). These results indicate that the PRC motif and the dileucine motif act as specific sorting signals for Kv2.1 and Kv4.2, respectively.
FIGURE 7.

Missorting of Kv2.1 and Kv4.2 mutants. A, frequency distributions of the maximum velocities of vesicles carrying GFP-Kv2.1 S586A (left) and GFP-Kv4.2 LL/AV (right). There was a significant difference in the velocity distribution between wild-type Kv2.1 and Kv2.1 S586A (p < 0.0001) as well as between Kv4.2 and Kv4.2 LL/AV (p < 0.0001). B, mistargeting of vesicles carrying GFP-Kv4.2 LL/AV to the axons indicated by the arrowheads. Scale bar, 10 μm. C, fluorescence intensity of GFP-Kv4.2 and GFP-Kv4.2 LL/AV along 23-μm segments of the axons.
In addition, we found that the spatial distributions of mutant GFP-Kv2.1 S586A and GFP-Kv4.2 LL/AV vesicles were disrupted. The distal enrichment index of GFP-Kv2.1 S586A was significantly increased (p = 0.008, n = 6) compared with wild-type Kv2.1 (1.91 ± 0.35 versus 0.80 ± 0.07), indicating that the vesicles carrying the targeting mutant are not restricted to the proximal dendrites but transported more distally in the dendrites. Furthermore, unlike wild-type GFP-Kv4.2, post-Golgi vesicles containing GFP-Kv4.2 LL/AV were readily detected in both the dendrites and in the axon (Fig. 7B), which was further evidenced by line scan analysis (Fig. 7C). Together, these results indicate that specific sorting mediated by the peptide motifs is crucial in the targeted transport of vesicles and therefore in the specific localization of Kv2.1 and Kv4.2.
Kv2.1 and Kv4.2 Are Trafficked by Distinct Mechanisms
The different velocities of Kv2.1 and Kv4.2 vesicles suggest that they are trafficked by distinct molecular mechanisms in dendrites. Therefore, we addressed the mechanisms underlying their vesicular trafficking. First, we investigated whether the actin cytoskeleton would be involved in the transport of Kv2.1 vesicles because an actin-myosin transport system was previously demonstrated to mediate short range transport of ionotropic glutamate receptors in dendrites (27, 28). Therefore, by use of an actin-depolymerizing toxin, latrunculin A (LatA), we examined whether intact actin filaments are required for the movement of Kv2.1 vesicles.
Neurons transfected with GFP-Kv2.1 were subjected to temperature block and then imaged before and after a 5-min treatment with 1 μm LatA. We verified that this treatment effectively reduced the level of filamentous actin as evidenced by a substantial reduction in phalloidin staining (100 ± 16% in control versus 24 ± 2% in LatA-treated cells, n = 3). This acute LatA treatment dramatically attenuated the motility of GFP-Kv2.1 vesicles (Fig. 8A, upper panel, and supplemental Movie 7). In contrast, the motion of GFP-Kv4.2 vesicles was not significantly affected by LatA (Fig. 8A, lower panel).
FIGURE 8.

Kv2.1 and Kv4. 2 channels are trafficked by distinct molecular mechanisms. A, neurons transfected with GFP-Kv2.1 or GFP-Kv4.2 were imaged before (Control) and after a 5-min treatment with 1 μm LatA. The movements of vesicles are illustrated by merging two image frames separated by 8 s in two different colors. Scale bar, 5 μm. B, trajectories from moving GFP-Kv2.1 vesicles before (Control) and after LatA treatment. Scale bar, 10 μm. C, the average number of mobile GFP-Kv2.1 vesicles in the dendrites was significantly reduced after treatment with LatA (*, p < 0.0001; n = 10 cells), whereas there were no significant changes in neurons treated with 100 μm colchicine (Col; n = 5). The effect of LatA on GFP-Kv2.1 S586A vesicles was negligible (n = 6). D, trajectories from moving GFP-Kv4.2 vesicles before (Control) and after treatment with colchicine (Col). Scale bar, 10 μm. E, the average number of mobile GFP-Kv4.2 vesicles was significantly reduced after treatment with colchicine (Col; n = 5) but not with LatA (n = 6).
To quantify the effect of LatA, we analyzed live cell images using the image processing method (see “Experimental Procedures” and Fig. 3A). The processing allowed us to count the number of post-Golgi vesicles in dendrites under different conditions for quantification. Before LatA treatment, many trajectories of GFP-Kv2.1 vesicles were detected in proximal dendrites (Fig. 8B). However, after LatA treatment, virtually no trajectories were visible (Fig. 8B and supplemental Movie 7). Consistently, the number of mobile vesicles was significantly reduced after LatA treatment (Fig. 8C). In contrast, depolymerization of microtubules with colchicine (100 μm; 20 min) did not elicit significant effects on the motility of GFP-Kv2.1 vesicles (Fig. 8C). Interestingly, the motility of vesicles carrying GFP-Kv2.1 S586A was not affected by LatA (Fig. 8C), further supporting the notion that the PRC mutant is sorted into a population of transport vesicles distinct from wild-type GFP-Kv2.1 vesicles. These data suggest that the specific population of post-Golgi vesicles carrying Kv2.1 depends on actin filaments for their transport.
It was shown previously that dendritic localization of Kv4.2 channels depends on a kinesin motor protein (KIF17) that transports cargo along microtubules (29). Consistently, upon depolymerization of microtubules with colchicine, we found a significant reduction in the number of moving GFP-Kv4.2 vesicles, whereas LatA did not cause any significant effect (Fig. 8, D and E). Together, these results strongly indicate that Kv2.1 and Kv4.2 channels are trafficked by distinct vesicular transport mechanisms within the somatodendritic compartment of neurons.
Unique Mode of Trafficking of GFP-Kv2.1 Vesicles and Its Underlying Mechanism
Our finding that the distribution of GFP-Kv2.1 vesicles was restricted to soma and the proximal parts of dendrites was striking and novel. To understand the basis of this, we first analyzed the processivity of individual post-Golgi transport vesicles, a parameter defined by the distance each vesicle moves without cessation. The average maximum processivity of GFP-Kv2.1 vesicles in individual neurons was significantly smaller than that of GFP-Kv4.2 vesicles (Fig. 9A). Interestingly, we also found that GFP-Kv2.1 vesicles changed direction frequently, whereas most of the GFP-Kv4.2 vesicles moved unidirectionally toward either the soma or the distal dendrites (Fig. 9, B and C). In the example shown in Fig. 9C, the net travel distance in 18 s was only about 1 μm even though the vesicle traveled with a maximum velocity of 1.9 μm/s. These results suggest that the actin-based trafficking of Kv2.1 is characterized by the intermittent and bidirectional motions of transport vesicles.
Therefore, we speculated that filaments with diverse orientations in this dendritic region could account for the unique bidirectional motion of GFP-Kv2.1 vesicles. Proximal dendrites contain numerous actin filaments (30), but their directionality is unknown. To determine the orientation of individual actin filaments, we used PALM (31) to track single molecules in live cells (16, 17). We noted that actin polymerization at filament barbed ends drives the flow of monomers along the filament away from the site of polymerization (32). Thus, trajectories of individual polymerized molecules reflect filament directionality, and we used this to compare filament organization in different subcompartments of neurons (Fig. 9D). Neurons were transfected with actin tagged with PA-TagRFP (33) and a marker of the axon initial segment (GFP-tagged ankyrin G-binding motif of Kv7.3 fused to CD4) (12). Tagged actin molecules were photoactivated, localized, and tracked as reported previously (Fig. 9E) (16). The direction of movement was measured as the angle relative to the axis of the dendrite. We then computed the cosine of each angle and used it as an angle score. We predicted that if actin filaments are oriented randomly in proximal dendrites then the average angle score would be zero. On the contrary, if actin filaments are oriented uniformly along the axis of the dendrite then the average angle score would be significantly greater than 0 with a maximum value of 1. In addition, we computed the angle scores relative to a perpendicular axis of dendrites in case actin filaments were oriented along this axis. For comparison, we simulated randomly oriented actin filaments with typical numbers of tracked particles (35–160) and obtained the angle scores, which were virtually zero (0.001 ± 0.114 (mean ± S.D.)). The mean angle score obtained from actin filaments in the proximal dendrites was not significantly greater than zero (p > 0.8), suggesting that actin filaments are randomly orientated in this compartment of neurons. Consistently, when the axis for angle score determination was rotated 90°, the values were not significantly different from zero (p > 0.9). In contrast, the mean angle score in the axon initial segment was 0.194 ± 0.052, suggesting an organized arrangement of actin filaments consistent with a recent study using electron microscopy (4). This score was significantly higher than the values from proximal dendrites and random simulations (Fig. 9F). These results suggest that actin filaments are more uniformly oriented in the axon initial segment than in the proximal dendrites. Taken together, these findings indicate that the characteristic intermittent and bidirectional motion of GFP-Kv2.1 vesicles in the somatodendritic compartment results from their traffic along randomly oriented actin filaments.
Role of Non-muscle Myosin II in GFP-Kv2.1 Trafficking
Our data also provide evidence that non-muscle myosin II (myosin II hereafter) is involved in the transport of Kv2.1 vesicles. Fig. 10, A and B, illustrate a significant reduction in the number of mobile GFP-Kv2.1 vesicles after treatment with 50 μm blebbistatin, a specific myosin II inhibitor (34, 35). We furthermore confirmed that a dominant-negative mutant of myosin IIB also reduced the motility of GFP-Kv2.1 vesicles (10.2 ± 1.7 in control versus 4.6 ± 1.1 with the dominant negative, p = 0.02).
FIGURE 10.

The role of non-muscle MyoIIB in Kv2.1 trafficking. A, the motility of GFP-Kv2.1 vesicles is attenuated upon treatment with blebbistatin. GFP-Kv2.1 vesicles were imaged before (Control) and after treatment with 50 μm blebbistatin for 5 min. Scale bar, 10 μm. B, the number of mobile GFP-Kv2.1 vesicles was significantly reduced (*, p = 0.0006; n = 7) upon treatment. C, interaction between Kv2.1 and MyoIIB. MyoIIB and Kv2.1 were immunoprecipitated (IP) from brain lysate. Normal rabbit IgG was used as a control. The immunoprecipitates were subjected to Western blotting (Blot) using the anti-MyoIIB antibody (left) and an antibody raised against the C terminus of Kv2.1 (middle). The arrowhead indicates the mouse IgG band. Right panel, co-immunoprecipitation of myosin IIB by an antibody against the extracellular region of Kv2.1 (Kv2.1E). D, lack of Kv4.2 binding to myosin IIB. E, pulldown assay with recombinant Kv2.1 fragments and MyoIIB. Left panel, the expression of Kv2.1 fragments in E. coli. Right panel, pulldown assay with Kv2.1 lysates and either the bacterial lysate with myosin IIB (E. coli) or HEK293 cell (HEK) lysate. Control represents the pulldown of the myosin IIB bacterial lysate with the streptavidin column in the absence of Kv2.1 lysate. Representative results from three independent experiments are shown. F, effect of blebbistatin on the steady-state localization of GFP-Kv2.1. Neurons were transfected with GFP-Kv2.1 for 3 h, incubated at 19.5 °C for 3 h, and treated with 10 μm blebbistatin for 18 h. Cells were then fixed and immunostained for GFP (green), Kv2.1 (red), and MAP-2 (blue). Scale bar, 20 μm.
Consistently, we found that endogenous Kv2.1 binds to endogenous myosin IIB in native rat brain tissues using a co-immunoprecipitation assay (Fig. 10C). In a reciprocal approach, an antibody against the extracellular epitope of Kv2.1 successfully co-immunoprecipitated myosin IIB. This binding was specific to Kv2.1 as endogenous Kv4.2 was not detected in the immunoprecipitate of myosin IIB (Fig. 10D).
To determine whether the binding between Kv2.1 and myosin IIB is direct, we performed a pulldown assay. Cytoplasmic N (1–186 amino acid residues) and C termini (431–853) of rat Kv2.1 were tagged with HaloTag (36) and expressed in E. coli. The bacterial lysates were mixed with a lysate either from E. coli expressing recombinant myosin IIB or from HEK293 cells. Recombinant Kv2.1 fragments were purified using a biotin ligand for HaloTag and a streptavidin column. We found that recombinant myosin IIB as well as endogenous myosin IIB from HEK293 cells was co-purified with either of the Kv2.1 fragments (Fig. 10E). These results indicate that myosin IIB can directly bind to Kv2.1 and that the binding involves both N and C termini of Kv2.1.
To test the significance of myosin IIB in Kv2.1 trafficking, we applied the temperature block to neurons transfected with GFP-Kv2.1 and then treated them without or with blebbistatin for 18 h. Control neurons showed typical clustering of GFP-Kv2.1, indicating its surface expression. However, GFP-Kv2.1 signal appeared cytoplasmic in neurons treated with blebbistatin (Fig. 10E).
Furthermore, to investigate whether the trafficking of endogenous Kv2.1 also depends on myosin IIB, we used shRNA to knock down myosin IIB and investigated its effect on Kv2.1. We tested three different shRNAs and found that they all reduced the expression levels of endogenous myosin IIB significantly as evidenced by immunofluorescence staining (Fig. 11, A and B). We then examined whether the expression of endogenous Kv2.1 in the somatodendritic region is altered by the shRNAs. Neurons were transfected with shRNA at 7 DIV, fixed at 9 DIV, and immunostained for Kv2.1. We found that neurons transfected with the shRNAs of myosin IIB had significantly lower immunofluorescence signals than those transfected with a control shRNA or untransfected neurons (Fig. 11, C and D). As it has been shown with a number of ion channels that trafficking-defective channels are rapidly degraded (for example, see Ref. 14), the result indicates that the reduction of myosin IIB disrupts Kv2.1 trafficking. Collectively, these results suggest that myosin II has a unique role in the post-Golgi trafficking of endogenous Kv2.1 in neurons.
FIGURE 11.

Significance of MyoIIB in Kv2.1 trafficking. A, knockdown of endogenous MyoIIB with shRNA. Neurons were transfected with shRNA and GFP at 7 DIV and fixed at 9 DIV for immunostaining of MyoIIB. Note that the GFP-positive neuron exhibits less immunofluorescence signal. Scale bar, 20 μm. B, quantification of the effects of shRNAs. The immunofluorescence signal of MyoIIB was measured in neurons expressing shRNA for luciferase (Control shRNA) or three independent shRNAs for rat MyoIIB (shRNA1–3). Non-transfected neurons were also used as controls. Asterisks indicate statistically significant differences as compared with control with Kruskal-Wallis test and Dunn's multiple comparison post hoc tests (*, p < 0.05; **, p < 0.01). Data shown are the means ± S.E. C, immunofluorescence staining of endogenous Kv2.1 in neurons transfected with MyoIIB shRNA together with GFP. Scale bar, 20 μm. D, quantification of the effects of shRNAs on Kv2.1. Quantification and analysis were done as for B. Data shown are the means ± S.E. E, the model. Selective transport mechanisms in the somatodendritic compartment are shown. Kv2.1 and Kv4.2 are sorted into distinct populations of transport vesicles at the Golgi apparatus and transported to specific subdomains of the dendrites by distinct transport mechanisms. N, nucleus; ER, endoplasmic reticulum.
DISCUSSION
In this study, we developed a novel imaging approach and used it to probe protein sorting and vesicular transport of dendritic Kv channels in living neurons. Our approach, based on the temperature block, resulted in the effective accumulation of GFP-tagged channel proteins in the Golgi apparatus, thereby allowing semipulse-chase imaging of the post-Golgi vesicular trafficking of Kv channels. By combining this approach with a number of quantitative analyses, we provided evidence that two dendritic ion channels, Kv2.1 and Kv4.2, are precisely sorted into distinct pools of transport vesicles that are targeted to specific dendritic subcompartments by different molecular mechanisms. Previous work has demonstrated that membrane proteins targeted to either axonal or somatodendritic compartments, such as the transferrin receptor and neuroglia cell adhesion molecule (NgCAM) are sorted in distinct populations of transport vesicles (1), a result that has also been supported by recent studies (37, 38). Our study further extends this compartment-specific trafficking model to ion channels that are localized to specific subcompartments within the dendrites. Based on our findings, we propose a selective dendritic transport model (Fig. 11E) in which proximal Kv2.1 and distal Kv4.2 are sorted into unique populations of vesicles at the Golgi apparatus and delivered by distinct transport machineries.
The significance of the specific sorting in establishing the distinct localizations of Kv2.1 and Kv4.2 is supported by our experiments using localization mutants. We showed that the mutants, which have been reported to mislocalize in neuronal membranes (9, 10), were indeed impaired in the protein sorting process. They appeared to be still efficiently packaged into post-Golgi transport vesicles but not into their designated populations. Consequently, these vesicles carrying missorted proteins were transported to improper locations, such as the distal dendrites for Kv2.1 S586A and the axon for Kv4.2 LL/AV. These results indicate that sorting to a specific population of transport vesicles at the Golgi apparatus is a crucial step in localizing these Kv channels to specific dendritic subcompartments.
Interestingly, our studies also shed light on how efficiently and precisely neurons sort dendritic ion channels into post-Golgi vesicles. Ample evidence suggests that the binding of a specific set of coat proteins to a peptide sorting signal is the common mechanism whereby membrane proteins are concentrated and packaged into a specific population of vesicles at the Golgi apparatus (39, 40). A recent study also reported that the μ1A subunit of adaptor protein-1 complex prevents somatodendritic proteins from being packaged into axonal transport vesicles at the Golgi apparatus (41). Although we currently do not know the molecular mechanism whereby dendritic Kv2.1 and Kv4.2 are separated into specific vesicular carriers, our results that an Arf1 mutant inhibits the formation of both types of vesicles indicate that adaptor protein-1 or other clathrin-associated sorting proteins recruited by Arf1 (40, 42) might be involved in the sorting events.
The velocities of post-Golgi transport vesicles obtained in this study (0.5–6 μm/s) are much greater than the values reported for single myosin IIB molecules (<0.1 μm/s) (43) and kinesin motors (up to 2 μm/s) (44), which have been measured mostly in vitro. As our results with vesicular stomatitis virus G-GFP showed velocities comparable with those measured previously in living cells (22–25), we concluded that our measurements are genuine. It should also be noted that the most classical type of vesicular transport in neurons, the fast axonal transport, has been shown to operate at the speed of ∼5 μm/s (400 mm/day). Therefore, there may be unknown factors that accelerate molecular motors, presumably their hydrolysis cycle (45), in the native cellular environment. However, these remain to be identified.
Previous studies have characterized mobile structures positive for Kv2.1 in neurons using live cell imaging (46, 47). However, because vesicles mediate the transport of membrane proteins between several compartments, such as from endoplasmic reticulum to Golgi or from the surface to endosomes, simple live cell imaging does not provide direct insight into the post-Golgi trafficking of Kv2.1. Our approach combining temperature block with quantitative live cell imaging allowed us to detect and analyze post-Golgi transport vesicles preferentially. Here, we provided evidence that GFP-Kv2.1 is sorted into a specific pool of vesicles at the Golgi apparatus that differs from the vesicle population carrying GFP-Kv4.2. Furthermore, GFP-Kv2.1 vesicles were trafficked by a unique mechanism involving myosin IIB and actin filaments. The molecular interaction detected between endogenous Kv2.1 and myosin IIB in brain tissue suggests that this novel trafficking mechanism identified for GFP-Kv2.1 also applies to the native channel. This was further supported by the results that shRNAs for myosin IIB caused significant changes in the expression of endogenous Kv2.1.
The binding between Kv2.1 and myosin IIB appears to be direct. This was evidenced by the results that recombinant myosin IIB expressed in E. coli was able to bind to recombinant cytoplasmic fragments of Kv2.1. This is comparable with the direct binding of the KIF17 motor protein to Kv4.2 (29). Also, the binding may involve both cytoplasmic tails of Kv2.1 as myosin IIB was co-purified with both of the fragments. This is interesting in light of the previous work demonstrating that the N and C termini of Kv2.1 can form a polypeptide complex and facilitate Kv2.1 trafficking in heterologous cells (48).
It has been shown that Kv2.1 is also localized in the proximal region of the axon, the AIS (9, 26). Although the S586A mutation disrupted the proximal localization of Kv2.1 in dendrites, it did not affect its restricted localization at the AIS (see Fig. 3A) (9). This suggests that the mechanism that localizes Kv2.1 to the AIS differs from the mechanism mediating the restricted somatodendritic localization of Kv2.1.
Our live PALM study provided evidence that actin filaments are oriented randomly in proximal dendrites. This is consistent with the random motion of Kv2.1 vesicles presumably mediated by a myosin motor. Although we do not know exactly how long actin filaments are, actin filament length in neurons varies widely, ranging from a few micrometers to 100 nm (30, 49). Therefore, motor molecules (and Kv2.1 vesicles) may have to change tracks frequently in the proximal dendrites. The random orientation and the short track length would cause frequent stalls and changes of direction of Kv2.1 transport vesicles in accordance with our observation. Alternatively, the myosin motor itself may reverse direction as observed by single molecule imaging of myosin IIB (43).
In summary, using quantitative imaging approaches, we provide evidence that neurons sort dendritic ion channels into multiple trafficking pathways, thereby resulting in destination-specific targeting and localization. In addition, these approaches would be useful in future studies to determine vesicular trafficking of other membrane signaling molecules in living neurons.
Acknowledgments
We thank Drs. James Trimmer, Stephanie Kaech, Mark Rizzo, Takashi Tsuboi, and Don Arnold for generously providing precious reagents. We also thank Matthew Rasband and Scott Thompson for critical reading and helpful discussion.
This work was supported in part by a grant from the Epilepsy Foundation (to H. M.), the Takeda Science Foundation (to H. M.), the Naito Foundation (to H. M.), and a framework grant from the Danish Medical Research Council (to S. P. O.).

This article contains supplemental Movies 1–7.
- Kv
- Voltage-gated K+
- DIV
- days in vitro
- MyoIIB
- non-muscle myosin IIB
- CCD
- charge-coupled device
- PALM
- photoactivated localization microscopy
- PA-TagRFP
- photoactivatable red fluorescent protein
- AIS
- axon initial segment
- LatA
- latrunculin A
- MAP-2
- microtubule-associated protein-2.
REFERENCES
- 1. Burack M. A., Silverman M. A., Banker G. (2000) The role of selective transport in neuronal protein sorting. Neuron 26, 465–472 [DOI] [PubMed] [Google Scholar]
- 2. Sampo B., Kaech S., Kunz S., Banker G. (2003) Two distinct mechanisms target membrane proteins to the axonal surface. Neuron 37, 611–624 [DOI] [PubMed] [Google Scholar]
- 3. Al-Bassam S., Xu M., Wandless T. J., Arnold D. B. (2012) Differential trafficking of transport vesicles contributes to the localization of dendritic proteins. Cell Rep. 2, 89–100 [DOI] [PMC free article] [PubMed] [Google Scholar]
- 4. Watanabe K., Al-Bassam S., Miyazaki Y., Wandless T. J., Webster P., Arnold D. B. (2012) Networks of polarized actin filaments in the axon initial segment provide a mechanism for sorting axonal and dendritic proteins. Cell Rep. 2, 1546–1553 [DOI] [PMC free article] [PubMed] [Google Scholar]
- 5. Lai H. C., Jan L. Y. (2006) The distribution and targeting of neuronal voltage-gated ion channels. Nat. Rev. Neurosci. 7, 548–562 [DOI] [PubMed] [Google Scholar]
- 6. Murakoshi H., Trimmer J. S. (1999) Identification of the Kv2.1 K+ channel as a major component of the delayed rectifier K+ current in rat hippocampal neurons. J. Neurosci. 19, 1728–1735 [DOI] [PMC free article] [PubMed] [Google Scholar]
- 7.7 Menegola M., Misonou H., Vacher H., Trimmer J. S. (2008) Dendritic A-type potassium channel subunit expression in CA1 hippocampal interneurons. Neuroscience 154, 953–964 [DOI] [PMC free article] [PubMed] [Google Scholar]
- 8. Jensen C. S., Rasmussen H. B., Misonou H. (2011) Neuronal trafficking of voltage-gated potassium channels. Mol. Cell. Neurosci. 48, 288–297 [DOI] [PubMed] [Google Scholar]
- 9. Lim S. T., Antonucci D. E., Scannevin R. H., Trimmer J. S. (2000) A novel targeting signal for proximal clustering of the Kv2.1 K+ channel in hippocampal neurons. Neuron 25, 385–397 [DOI] [PubMed] [Google Scholar]
- 10. Rivera J. F., Ahmad S., Quick M. W., Liman E. R., Arnold D. B. (2003) An evolutionarily conserved dileucine motif in Shal K+ channels mediates dendritic targeting. Nat. Neurosci. 6, 243–250 [DOI] [PubMed] [Google Scholar]
- 11. Kaech S., Ludin B., Matus A. (1996) Cytoskeletal plasticity in cells expressing neuronal microtubule-associated proteins. Neuron 17, 1189–1199 [DOI] [PubMed] [Google Scholar]
- 12. Gilling M., Rasmussen H. B., Calloe K., Sequeira A. F., Baretto M., Oliveira G., Almeida J., Lauritsen M. B., Ullmann R., Boonen S. E., Brondum-Nielsen K., Kalscheuer V. M., Tümer Z., Vicente A. M., Schmitt N., Tommerup N. (2013) Dysfunction of the heteromeric KV7.3/KV7.5 potassium channel is associated with autism spectrum disorders. Front. Genet. 4, 54. [DOI] [PMC free article] [PubMed] [Google Scholar]
- 13. Kaech S., Banker G. (2006) Culturing hippocampal neurons. Nat. Protoc. 1, 2406–2415 [DOI] [PubMed] [Google Scholar]
- 14. Shibata R., Misonou H., Campomanes C. R., Anderson A. E., Schrader L. A., Doliveira L. C., Carroll K. I., Sweatt J. D., Rhodes K. J., Trimmer J. S. (2003) A fundamental role for KChIPs in determining the molecular properties and trafficking of Kv4.2 potassium channels. J. Biol. Chem. 278, 36445–36454 [DOI] [PubMed] [Google Scholar]
- 15. Trimmer J. S. (1991) Immunological identification and characterization of a delayed rectifier K+ channel polypeptide in rat brain. Proc. Natl. Acad. Sci. U.S.A. 88, 10764–10768 [DOI] [PMC free article] [PubMed] [Google Scholar]
- 16. Frost N. A., Shroff H., Kong H., Betzig E., Blanpied T. A. (2010) Single-molecule discrimination of discrete perisynaptic and distributed sites of actin filament assembly within dendritic spines. Neuron 67, 86–99 [DOI] [PMC free article] [PubMed] [Google Scholar]
- 17. Manley S., Gillette J. M., Patterson G. H., Shroff H., Hess H. F., Betzig E., Lippincott-Schwartz J. (2008) High-density mapping of single-molecule trajectories with photoactivated localization microscopy. Nat. Methods 5, 155–157 [DOI] [PubMed] [Google Scholar]
- 18. An W. F., Bowlby M. R., Betty M., Cao J., Ling H. P., Mendoza G., Hinson J. W., Mattsson K. I., Strassle B. W., Trimmer J. S., Rhodes K. J. (2000) Modulation of A-type potassium channels by a family of calcium sensors. Nature 403, 553–556 [DOI] [PubMed] [Google Scholar]
- 19. Frech G. C., VanDongen A. M., Schuster G., Brown A. M., Joho R. H. (1989) A novel potassium channel with delayed rectifier properties isolated from rat brain by expression cloning. Nature 340, 642–645 [DOI] [PubMed] [Google Scholar]
- 20. Dascher C., Balch W. E. (1994) Dominant inhibitory mutants of ARF1 block endoplasmic reticulum to Golgi transport and trigger disassembly of the Golgi apparatus. J. Biol. Chem. 269, 1437–1448 [PubMed] [Google Scholar]
- 21. Jeyifous O., Waites C. L., Specht C. G., Fujisawa S., Schubert M., Lin E. I., Marshall J., Aoki C., de Silva T., Montgomery J. M., Garner C. C., Green W. N. (2009) SAP97 and CASK mediate sorting of NMDA receptors through a previously unknown secretory pathway. Nat. Neurosci. 12, 1011–1019 [DOI] [PMC free article] [PubMed] [Google Scholar]
- 22. Hirschberg K., Miller C. M., Ellenberg J., Presley J. F., Siggia E. D., Phair R. D., Lippincott-Schwartz J. (1998) Kinetic analysis of secretory protein traffic and characterization of Golgi to plasma membrane transport intermediates in living cells. J. Cell Biol. 143, 1485–1503 [DOI] [PMC free article] [PubMed] [Google Scholar]
- 23. Toomre D., Keller P., White J., Olivo J. C., Simons K. (1999) Dual-color visualization of trans-Golgi network to plasma membrane traffic along microtubules in living cells. J. Cell Sci. 112, 21–33 [DOI] [PubMed] [Google Scholar]
- 24. Polishchuk E. V., Di Pentima A., Luini A., Polishchuk R. S. (2003) Mechanism of constitutive export from the Golgi: bulk flow via the formation, protrusion, and en bloc cleavage of large trans-Golgi network tubular domains. Mol. Biol. Cell 14, 4470–4485 [DOI] [PMC free article] [PubMed] [Google Scholar]
- 25. Lock J. G., Stow J. L. (2005) Rab11 in recycling endosomes regulates the sorting and basolateral transport of E-cadherin. Mol. Biol. Cell 16, 1744–1755 [DOI] [PMC free article] [PubMed] [Google Scholar]
- 26. Sarmiere P. D., Weigle C. M., Tamkun M. M. (2008) The Kv2.1 K+ channel targets to the axon initial segment of hippocampal and cortical neurons in culture and in situ. BMC Neurosci. 9, 112. [DOI] [PMC free article] [PubMed] [Google Scholar]
- 27. Brown J. R., Stafford P., Langford G. M. (2004) Short-range axonal/dendritic transport by myosin-V: a model for vesicle delivery to the synapse. J. Neurobiol. 58, 175–188 [DOI] [PubMed] [Google Scholar]
- 28. Osterweil E., Wells D. G., Mooseker M. S. (2005) A role for myosin VI in postsynaptic structure and glutamate receptor endocytosis. J. Cell Biol. 168, 329–338 [DOI] [PMC free article] [PubMed] [Google Scholar]
- 29. Chu P. J., Rivera J. F., Arnold D. B. (2006) A role for Kif17 in transport of Kv4.2. J. Biol. Chem. 281, 365–373 [DOI] [PubMed] [Google Scholar]
- 30. Xu K., Zhong G., Zhuang X. (2013) Actin, spectrin, and associated proteins form a periodic cytoskeletal structure in axons. Science 339, 452–456 [DOI] [PMC free article] [PubMed] [Google Scholar]
- 31. Betzig E., Patterson G. H., Sougrat R., Lindwasser O. W., Olenych S., Bonifacino J. S., Davidson M. W., Lippincott-Schwartz J., Hess H. F. (2006) Imaging intracellular fluorescent proteins at nanometer resolution. Science 313, 1642–1645 [DOI] [PubMed] [Google Scholar]
- 32. Pollard T. D., Borisy G. G. (2003) Cellular motility driven by assembly and disassembly of actin filaments. Cell 112, 453–465 [DOI] [PubMed] [Google Scholar]
- 33. Subach F. V., Patterson G. H., Renz M., Lippincott-Schwartz J., Verkhusha V. V. (2010) Bright monomeric photoactivatable red fluorescent protein for two-color super-resolution sptPALM of live cells. J. Am. Chem. Soc. 132, 6481–6491 [DOI] [PMC free article] [PubMed] [Google Scholar]
- 34. Straight A. F., Cheung A., Limouze J., Chen I., Westwood N. J., Sellers J. R., Mitchison T. J. (2003) Dissecting temporal and spatial control of cytokinesis with a myosin II inhibitor. Science 299, 1743–1747 [DOI] [PubMed] [Google Scholar]
- 35. Allingham J. S., Smith R., Rayment I. (2005) The structural basis of blebbistatin inhibition and specificity for myosin II. Nat. Struct. Mol. Biol. 12, 378–379 [DOI] [PubMed] [Google Scholar]
- 36. Los G. V., Encell L. P., McDougall M. G., Hartzell D. D., Karassina N., Zimprich C., Wood M. G., Learish R., Ohana R. F., Urh M., Simpson D., Mendez J., Zimmerman K., Otto P., Vidugiris G., Zhu J., Darzins A., Klaubert D. H., Bulleit R. F., Wood K. V. (2008) HaloTag: a novel protein labeling technology for cell imaging and protein analysis. ACS Chem. Biol. 3, 373–382 [DOI] [PubMed] [Google Scholar]
- 37. Lewis T. L., Jr., Mao T., Svoboda K., Arnold D. B. (2009) Myosin-dependent targeting of transmembrane proteins to neuronal dendrites. Nat. Neurosci. 12, 568–576 [DOI] [PMC free article] [PubMed] [Google Scholar]
- 38. Song A. H., Wang D., Chen G., Li Y., Luo J., Duan S., Poo M. M. (2009) A selective filter for cytoplasmic transport at the axon initial segment. Cell 136, 1148–1160 [DOI] [PubMed] [Google Scholar]
- 39. Bonifacino J. S., Lippincott-Schwartz J. (2003) Coat proteins: shaping membrane transport. Nat. Rev. Mol. Cell Biol. 4, 409–414 [DOI] [PubMed] [Google Scholar]
- 40. Traub L. M. (2005) Common principles in clathrin-mediated sorting at the Golgi and the plasma membrane. Biochim. Biophys. Acta 1744, 415–437 [DOI] [PubMed] [Google Scholar]
- 41. Farías G. G., Cuitino L., Guo X., Ren X., Jarnik M., Mattera R., Bonifacino J. S. (2012) Signal-mediated, AP-1/clathrin-dependent sorting of transmembrane receptors to the somatodendritic domain of hippocampal neurons. Neuron 75, 810–823 [DOI] [PMC free article] [PubMed] [Google Scholar]
- 42. Edeling M. A., Smith C., Owen D. (2006) Life of a clathrin coat: insights from clathrin and AP structures. Nat. Rev. Mol. Cell Biol. 7, 32–44 [DOI] [PubMed] [Google Scholar]
- 43. Norstrom M. F., Smithback P. A., Rock R. S. (2010) Unconventional processive mechanics of non-muscle myosin IIB. J. Biol. Chem. 285, 26326–26334 [DOI] [PMC free article] [PubMed] [Google Scholar]
- 44. Hirokawa N., Noda Y., Tanaka Y., Niwa S. (2009) Kinesin superfamily motor proteins and intracellular transport. Nat. Rev. Mol. Cell Biol. 10, 682–696 [DOI] [PubMed] [Google Scholar]
- 45. Howard J. (2001) Mechanics of Motor Proteins and the Cytoskeleton, Sinauer Associates, Inc., Sunderland, MA [Google Scholar]
- 46. Nakata T., Hirokawa N. (2003) Microtubules provide directional cues for polarized axonal transport through interaction with kinesin motor head. J. Cell Biol. 162, 1045–1055 [DOI] [PMC free article] [PubMed] [Google Scholar]
- 47. Tamkun M. M., O'connell K. M., Rolig A. S. (2007) A cytoskeletal-based perimeter fence selectively corrals a sub-population of cell surface Kv2.1 channels. J. Cell Sci. 120, 2413–2423 [DOI] [PubMed] [Google Scholar]
- 48. Mohapatra D. P., Siino D. F., Trimmer J. S. (2008) Interdomain cytoplasmic interactions govern the intracellular trafficking, gating, and modulation of the Kv2.1 channel. J. Neurosci. 28, 4982–4994 [DOI] [PMC free article] [PubMed] [Google Scholar]
- 49. Korobova F., Svitkina T. (2010) Molecular architecture of synaptic actin cytoskeleton in hippocampal neurons reveals a mechanism of dendritic spine morphogenesis. Mol. Biol. Cell 21, 165–176 [DOI] [PMC free article] [PubMed] [Google Scholar]