

Background: Mutations in TDP-43 are frequently found in ALS patients.
Results: A315T TDP-43 protein is elevated from this transgenic knock-in allele due to disturbed feedback regulation.
Conclusion: Elevation of A315T TDP-43 was insufficient to cause ALS in this mutant.
Significance: This TDP-43 allele could be valuable in determining genetic or environmental factors that cause full-blown FTLD or ALS.
Keywords: Amyotrophic Lateral Sclerosis (Lou Gehrig's Disease), Mitochondrial Metabolism, Mouse Genetics, Mutagenesis Site-specific, Neurological Diseases
Abstract
The majority of amyotrophic lateral sclerosis (ALS) cases as well as many patients suffering from frontotemporal lobar dementia (FTLD) with ubiquitinated inclusion bodies show TDP-43 pathology, the protein encoded by the TAR DNA-binding protein (Tardbp) gene. We used recombinase-mediated cassette exchange to introduce an ALS patient cDNA into the mouse Tdp-43 locus. Expression levels of human A315T TDP-43 protein were 300% elevated in heterozygotes, whereas the endogenous mouse Tdp-43 was decreased to 20% of wild type levels as a result of disturbed feedback regulation. Heterozygous TDP-43A315TKi mutants lost 10% of their body weight and developed insoluble TDP-43 protein starting as early as 3 months after birth, a pathology that was exacerbated with age. We analyzed the splicing patterns of known Tdp-43 target genes as well as genome-wide gene expression levels in different tissues that indicated mitochondrial dysfunction. In heterozygous mutant animals, we observed a relative decrease in expression of Parkin (Park2) and the fatty acid transporter CD36 along with an increase in fatty acids, HDL cholesterol, and glucose in the blood. As seen in transmission electron microscopy, neuronal cells in motor cortices of TDP-43A315TKi animals had abnormal neuronal mitochondrial cristae formation. Motor neurons were reduced to 90%, but only slight motoric impairment was detected. The observed phenotype was interpreted as a predisease model, which might be valuable for the identification of further environmental or genetic triggers of neurodegeneration.
Introduction
The Tardbp gene codes for TDP-43, an RNA-binding protein of 43 kDa, which has been implicated in a number of neurodegenerative diseases, such as frontotemporal lobar dementia (FTLD)2 and amyotrophic lateral sclerosis (ALS) but also Huntington disease, Alzheimer disease, and Parkinson disease (1–8). TDP-43 is a widely expressed heterogeneous nuclear ribonucleoprotein with two RNA recognition motifs and high affinity to single-stranded nucleic acids (9–14). Although predominantly located in the nucleus, TDP-43 shuttles between the nucleus and the cytoplasm under normal conditions (15). In the nucleus, TDP-43 is involved in microRNA biogenesis (16) and splicing regulation, where it causes exon inclusion or exclusion, depending on the number and localization of its UG-enriched target sequences (17–22). Upon stress exposure, TDP-43 is recruited to stress granules in cultured cells, which serve as cytoplasmic storage of RNAs that become instantly available for translation without further transcription processes (10, 23–25). Under pathological conditions, TDP-43 is ubiquitinated and phosphorylated and forms neuronal cytoplasmic inclusions in upper and lower motor neurons (26, 27). The vast majority of ALS mutations have been observed in the glycine-rich domain of TDP-43, a domain that is thought to function in protein-protein interaction, because TDP-43 interacts with a large number of proteins, including itself, under physiological conditions (28–30). Cellular steady-state levels of TDP-43 are mainly regulated through a TDP-43 autofeedback (17, 31, 32). High levels of TDP-43 are toxic to cells, yet also low TDP-43 levels are not tolerated (11, 33–34). Hence, transgenic overexpressors down-regulated endogenous TDP-43 levels, whereas heterozygous TDP-43 knock-out mice showed an increased expression of the wild type allele. A number of transgenic mice expressing wild type or mutant human TDP-43 have been established, showing either early lethality or severe motor dysfunction shortly after birth (35–37). No mouse model so far has shown all of the features of ALS. It is not yet clear under which conditions TDP-43 pathology develops in vivo and what the role of the mutations for the progression of the disease is. In order to investigate the role of a TDP-43 mutation under physiological conditions, we generated a mouse line expressing a human TDP-43 cDNA, carrying an A315T mutation under the control of the endogenous Tardbp promoter.
EXPERIMENTAL PROCEDURES
Generation of hTDP-43A315T Mice
Animals were generated via RMCE as described previously (38). Briefly, the final exchange vector was established from pENTR-Ex containing full-length cDNA TDP-43(A315T) and pEX-Dest in a Gateway reaction using clonase and following standard protocols (Invitrogen). Transfection was performed using the FlEx conditional GGTC gene trap clone D045A10. Hygro-resistant clones were screened for successful exchange by PCR using internal oligonucleotides in the splice acceptor of pEX-FLP-hTDP-43(A315T) and in the 5′-LTR. In vivo excision of hygromycin by Cre was done using Rosa26Cre transgenic mice (Taconic; 006467-T-F Heterozygous C57BL/6NTac-Gt(ROSA)26Sortm16(cre)Arte).
Genotyping
Mice expressing human A315T TDP-43 protein were identified by PCR using the following primers: D045for, 5′-CTGTTGTCGGATTCCTTCCC-3′; D045rev, 5′-CTCGTCATTTCTTACCTGGAG-3′; and LTRfor, 5′-CAACTGCAAGAGGGTTTATTGG-3′.
Quantitative Real-time PCR
Levels of mouse and human TDP-43 transcripts were determined using commercial TaqMan® Gene Expression Assays (Applied Biosystems). Total RNA was extracted from frozen brain tissue using TRIzol® (Invitrogen) and RNeasy minikit (Qiagen). Total RNA was treated with DNase (Qiagen) to eliminate genomic DNA. 1 μg of RNA was used to synthesize cDNA using the High Capacity cDNA reverse transcription kit (Applied Biosystems). The following gene expression assays were used: hTDP-43 Hs0606522_m1, mTDP-43 Mm00523866_m1, and mouse ACTB (endogenous control, 4352933E) (Applied Biosystems).
Western Blotting
For soluble fractions tissues were homogenized in radioimmune precipitation assay buffer (50 mm Tris-HCl, pH 7.4, 150 mm NaCl, 1% Triton X-100, 0.5% sodium deoxycholate, 1% SDS, 3 mm EDTA, and protease and phosphatase inhibitor mixture) and sonicated. Following centrifugation, supernatant was assessed by a BCA protein assay kit (Thermo Scientific). The pellet was twice redissolved in radioimmune precipitation assay buffer, sonicated, and centrifuged at 100,000 × g at 4 °C for 30 min. Finally, the pellet was resuspended in urea buffer (7 m urea, 2 m thiourea, 4% CHAPS, 30 mm Tris-HCl, pH 8.5), sonicated, and centrifuged at 20,000 × g at room temperature for 30 min. The supernatant was used for the insoluble fraction. Equal amounts of protein were loaded on a NuPAGE 4–12% BisTris gel (Invitrogen) and transferred on a nitrocellulose membrane. The following antibodies were used: rabbit anti-TDP-43 antibody (ProteinTech, 10782-2-AP; 1:1000), human-specific mouse anti-TDP-43 antibody (Abcam, ab57105; 1:1000), mouse anti-PARKIN antibody (Santa Cruz Biotechnology, Inc.; 1:1000), rat anti-TDP-43 phosphorylated (1D3; E. Kremmer; 1:100) (39), mouse anti-FUS (Santa Cruz Biotechnology; 1:1000), mouse anti-ubiquitin (Millipore; 1:500), rabbit anti-p62 (Santa Cruz Biotechnology; sc-25575), anti-Opa1 (BD Biosciences), and anti-CD36 (R&D Systems; 1:500). Detection was performed using HRP-conjugated secondary antibodies and the ECL Plus chemiluminescent detection system (Amersham Biosciences). Data were normalized to mouse anti-β-actin (GeneTex; 1:10,000).
Immunohistochemistry/Immunofluorescence
Mice were perfused transcardially using 4% paraformaldehyde in 0.1 m phosphate buffer and paraffin-embedded. Eight-micrometer sections of brain and spinal cord were cut. For immunohistochemistry, the tissue was quenched in 0.2% H2O2 in PBS, and antigen-retrieval was done with citrate buffer for 1 h. After blocking in 10% normal goat serum for 1 h at room temperature, primary antibodies were incubated overnight at 4 °C. The tissue was treated with biotinylated secondary antibodies (1:300) for 1 h at room temperature, incubated in avidin-biotin complex (Vector Laboratories), and developed using DAB (Sigma). Nissl and hematoxylin/eosin staining were performed using standard methods. Double immunofluorescence was performed on fixed paraffin-embedded sections of the brain and spinal cord using the described primary antibodies and Alexa Fluor 594- or 488-conjugated secondary antibodies.
Transmission Electron Microscopy
Animals were perfused as described under “Immunohistochemistry/Immunofluorescence.” Tissue samples were fixed in 2.5% electron microscopy grade glutaraldehyde in 0.1 m sodium cacodylate buffer, pH 7.4 (Science Services, Munich, Germany), postfixed in 2% aqueous osmium tetraoxide, dehydrated in gradual ethanol (30–100%) steps and propylene oxide, embedded in Epon (Merck), and cured for 24 h at 60 °C. Semithin sections were cut and stained using toluidine blue. Ultrathin sections of 50 nm were collected onto 200-mesh copper grids, stained using uranyl acetate and lead citrate prior to transmission electron microscopy examination (Zeiss Libra 120 Plus, Carl Zeiss NTS GmbH, Oberkochen, Germany). Pictures were acquired using a Slow Scan CCD camera and iTEM software (Olympus Soft Imaging Solutions, Münster, Germany).
ES Cell Culture
All clones were derived from feeder independent E14 Tg2A.4 cells (40) gene trap lines, with the exception of D045A10, which was derived from a TBV2 cell line (41) and was cultured on a mouse embryonic fibroblast feeder layer. ES cell lines were grown under standard culture conditions (see the German Gene Trap Consortium website). For Cre transfection, the exchange clones were transfected with 50 μg of supercoiled Caggs-CRE-IRES-Puro plasmid. After electroporation, ES cells were plated on gelatin-coated culture dishes (1 × 10³, 100 mm) for 3–4 days. Selected colonies were transferred to 96-well plates and expanded in three replicates to 96-wells. One plate was used for the isolation of genomic DNA and genotyping. Positive clones were expanded on gelatin-coated 100-mm dishes and used for protein analysis.
Behavioral Tests
All behavioral tests were carried out as described previously (42–43).
Beam Walk
Mice were trained to traverse a 1-meter wooden round beam. After the training period, animals were placed on the beam for five testing trials. The time needed to traverse the beam, the number of foot slips, and number of falls off the beam were measured.
Vertical Pole Test
The animals were placed head upwards on a 50-cm-high, taped pole. The time needed to turn downward and to descend were measured.
Accelerating Rotarod
Mice were placed on a rod rotating at 4 rpm constant speed. Rotation speed was accelerated from 4 to 40 rpm in 300 s. Latency and rpm at which each mouse fell off were recorded. The test phase consisted of three trials separated by 15-min inter-trial intervals.
Ladder
Animals were placed on a horizontal ladder on which spacing of the rungs was variable. After a short training period, mice needed to traverse the ladder. The number of front and hind paw slips and the time to cross the ladder were recorded.
Gait Analysis
Mice performed three uninterrupted runs in a dark room over an elevated glass walkway. The footprint pattern was tracked by a camera (Pulnix Camera RM-765) and analyzed using the “Cat Walk” software version 7.1.
Y-maze
The Y-maze is an apparatus in the shape of a Y, encompassing three identical arms connected with a triangular platform. The mice were placed at the end of one arm and allowed to explore the Y-maze for a 5-min interval. Latency to leave the first arm and the total number and sequence of entries into each arm were counted.
Object Recognition
Two identical objects were placed in an empty arena, and the mice were allowed to explore them for 5 min. Each mouse had three sampling trials with inter-trial intervals of 15 min. At 3 and 24 h after the third sampling trial, one object was replaced by a new, unfamiliar one. The exploration times were scored for each trial and analyzed.
Motor Neuron Counting
For spinal motor neuron quantification, mice were perfused with 4% paraformaldehyde, and the spinal cord was removed and embedded in paraffin. Serial 8-μm sections from the L3–L5 region were cut. Sections were Nissl-stained, and every second section was used for counting motor neurons in the sciatic motor pool. Only cells with a clear, definable nucleolus were scored.
Rapid Amplification of cDNA Ends (3′-RACE)
Total RNA was isolated from adult brain tissue as described above. Reverse transcription and 3′-RACE were performed with the FirstChoice® RLM-RACE kit (Ambion) using the following gene specific primer: 5′-ATATTCTGCCATAGGAATAC-3′.
Clinical Chemistry
A cohort of 40 mice (20 mice/sex) and an equal number of wild type littermates was phenotypically analyzed within the German Mouse Clinic in a two-pipeline systematic primary phenotyping screen using 10 mice/group for each test. In the following, only tests resulting in the detection of significant genotype-related differences are described in detail. Blood samples were collected by retrobulbar puncture from isoflurane anesthetized mice into heparinized tubes in both pipelines. Mice analyzed in pipeline 1 were fasted overnight for 16–18 h prior to blood collection. Blood samples collected from fasted mice were stored after collection in a rack on wet ice for not longer than 1 h until being separated by centrifugation, and plasma was immediately frozen at −80 °C until analysis. Samples collected from ad libitum fed mice in pipeline 2 were stored for 1–2 h at room temperature before centrifugation (10 min at 8 °C, 5000 × g, Biofuge Fresco, Heraeus Instruments), and plasma was distributed for the different blood-based screens. Clinical chemistry analysis of these samples was performed on the day of collection using 1:2 diluted samples. Clinical chemical parameters were determined using an AU400 autoanalyzer (Olympus; distributed by Beckman-Coulter) and adapted reagents from Beckman-Coulter, Wako, and Randox. Plasma samples collected from overnight fasted mice were analyzed for concentrations of total cholesterol, HDL cholesterol, triglyceride, glucose, non-esterified fatty acids (NEFA), and glycerol, whereas a set of 18 parameters (concentrations of sodium, chloride, potassium, calcium, inorganic phosphorus, iron, total protein, albumin, urea, creatinine, total cholesterol, triglyceride, and glucose as well as plasma activities of alanine-aminotransferase (ALAT), aspartate-aminotransferase, (ASAT), alkaline phosphatase (AP), α-amylase, and lactate dehydrogenase) was measured in samples collected in pipeline 2.
Molecular Phenotyping
Brain and muscle were collected from mice at the age of 17 weeks. Total RNA of the different organs was isolated from eight (testis) and 14 (brain) mice (4/6 mutant and 4/8 wild type mice) according to the manufacturer's protocol using RNeasy minikits (Qiagen). RNA integrity was monitored on a formaldehyde-agarose gel, and concentration was calculated from an A260/280 measurement. 500 ng of this high quality total RNA were amplified using the Illumina TotalPrep RNA amplification kit (Ambion). The amplified cRNA was hybridized to MouseRef-8 v2 Expression BeadChips (Illumina, San Diego, CA), and subsequent to 16 h of incubation, staining and scanning were done according to the Illumina expression protocol. Data were normalized using the GenomeStudio version 2011.1 software and processed using the quantile normalization, background subtraction option, and introduction of an offset to remove remaining negative expression values. The identification of significant gene regulation was performed using SAM (significant analysis of microarrays) included in the TM4 software package. Genes were ranked according to their relative difference value d(i), a score assigned to each gene on the basis of changes in gene expression levels in relation to the S.D. value. Genes with d(i) values greater than a threshold were selected as significantly differentially expressed in a one-class analysis. The percentage of such genes identified by chance is the false discovery rate. To estimate the false discovery rate, nonsense genes were identified by calculation of 1000 permutations of the measurements. The selection of the top differentially expressed genes with reproducible up- or down-regulation includes about 5% false positives (false discovery rate) in combination with -fold change of >1.4. Array data are available in the GEO database under GSE39585.
Bioinformatics Analysis
Support Vector Machines with Recursive Feature Elimination (SVM-RFE) according to Zhou et al. (44) was performed on normalized microarray data of the TDP-43 mutant and wild type mice. For SVM prediction, the function svm from the e1071 package in R (available on the World Wide Web) was used with default settings except the parameters type = C-classification, kernel = linear, and cost = 0.1. SVM-RFE algorithm grouped the samples of the microarray data set (six wild type and six mutant animals) into stratified five folds, and all combinations of four folds were used for mSVM-RFE. The grouping into folds was done 10 times, and the SVM-RFE algorithm was applied 50 times on different subsets of the original data set. Finally, 50 different probe set selections, each consisting of the best 500 probe sets for classification according to the cost function of the SVM classifier, were obtained. The frequency of each occurring in all of the probe set selections was computed to identify the most important (see detailed description of an application of this algorithm by Augustin et al. (45)).
Differentially expressed genes occurring in at least 15 selections were functionally investigated with the Ingenuity Pathway Analysis (IPA) software (content version: 12710793, release date: 2012-05-07) and explored for enrichment in the gene ontology categories cellular component and biological process (46) by the program Pathway Studio version 9.0 (Ariadne Genomics). For calculation of p values, Fisher's exact test was performed with both tools.
RESULTS
Increased TDP-43 Levels in Mice Expressing hTDP-43A315T
To study the pathological functions of A315T TDP-43 protein, we generated mice expressing human TDP-43 cDNA with the A315T mutation under control of the endogenous Tardbp promoter (38). The hTDP-43A315T(+/−) mice were viable and fertile. hTDP-43A315T(+/−) mice were intercrossed to generate homozygous mutants. However, no homozygous hTDP-43A315T mice were identified among 200 pups genotyped at weaning age. To determine the stage of lethality, 20 embryos were genotyped at embryonic day 7.5 (E7.5) after het × het matings. Again, no homozygous mutant embryos were found, indicating lethality of homozoygotes before or around gastrulation (E6.5–E7.5; Fig. 1A). Therefore, this entire study was done using heterozygotes. Expression levels of TDP-43 were found to be elevated in the adult brain and yet in a variety of other tissues of the mutants too (Fig. 1, B and C). We detected two tissue specific TDP-43 isoforms in Western blots. Due to the presence of a smaller TDP-43 isoform in the kidney (35 kDa), which was detectable with an antibody recognizing the N terminus of human TDP-43 protein, and the fact that a human cDNA was expressed, we concluded that the 35-kDa form was not a result of alternative splicing but rather represents a C-terminal post-translational truncation. The second tissue-specific isoform was a 60-kDa band, which was detectable only in the brains of wild type and heterozygous animals. To date, the nature of this band is still unclear (Fig. 1B). To investigate the onset of TDP-43 overexpression, we analyzed brain lysates from 1-, 6-, and 12-month-old mutants. Elevated TDP-43 protein amounts, which were estimated to be 2.5 times wild type levels from Western blots, were already present in 1-month-old heterozygotes (Fig. 1C). Next, we examined the relative levels of the mouse and the mutant human TDP-43 transcripts. Using species-specific quantitative real-time PCR, we found that in 1-year-old mutant mice, endogenous mouse TDP-43 messenger RNA transcripts were decreased to as low as 20% compared with controls. In contrast, the human TDP-43 isoform carrying the A315T mutation was 3-fold up-regulated (Fig. 1D). In summary, the ratio of hTDP-43A315T to mTDP-43 was calculated to be 15:1 based on transcript levels.
FIGURE 1.

TDP-43 expression in heterozygous hTDP-43A315T mice. A, homozygous animals expressing human A315T TDP-43 were embryonic lethal at weaning age. At stage E7.5 no homozygous embryo was found by PCR genotyping. B, Western blots of various tissue lysates from a 6-month-old mutant mouse compared with control probed for total TDP-43 or human TDP-43 revealed a tissue-specific pattern as well as increased TDP-43 levels for all organs. C, Western blots of brain lysates from 1-, 6-, and 12-month-old mutants (+/−) and controls (wt) using antibodies against total TDP-43 and human TDP-43. D, quantification of mouse and human TDP-43 isoforms via quantitative real-time PCR. Down-regulation of endogenous mouse TDP-43 to about 20% as well as a 3–4-fold up-regulation of human TDP-43 in mutants compared with controls. Error bars, S.D.
The 3′-UTR Is Essential to Control Endogenous TDP-43 Levels in Vivo
TDP-43 regulates itself through a negative feedback loop by binding to its own 3′-UTR sequence (17, 31). This discovery led us to investigate if the missing 3′-UTR in our construct was accountable for the hTDP-43 up-regulation. We created four ES cell lines expressing either the human wild type or mutant TDP-43 cDNA along with a bGH poly(A) sequence or 800 bp of the mouse 3′-UTR. Protein lysates of these clones were generated and analyzed. TDP-43 protein amounts of clones expressing either wild type or mutant hTDP-43 together with the 3′-UTR were comparable with the levels of the control, whereas the clones expressing the wild type or mutant cDNA with the bGH poly(A) showed a ∼2.5-fold increase of TDP-43 protein (Fig. 2A). These experiments suggested that the elevated expression of human TDP-43 in the mutants was solely due to the absence of the 3′-UTR. In addition, 800 bp of the mouse 3′-UTR were sufficient for the negative TDP-43 autoloop. While performing a 3′-RACE of mouse brain samples, we detected two splice variants of the TDP-43 3′-UTR of 828 and 247 bp (Fig. 2B). The spliced region contains a putative binding site for TDP-43 (Fig. 2C, red).
FIGURE 2.

The 3′-UTR is essential to control endogenous TDP-43 levels. A, Western blot of ES cells expressing either human wild type TDP-43 with Bgh poly(A), human A315T TDP-43 with Bgh poly(A), or human wild type or human A315T TDP-43 with 3′-UTR under control of the endogenous TDP-43 promoter. Cells expressing human wild type TDP-43 with Bgh poly(A) showed 3-fold increased TDP-43 levels compared with untransfected control. Cells expressing human wild type or mutant TDP-43 with 3′-UTR display similar levels as control. B, 3′-RACE of the TDP-43 3′-UTR revealed different splicing variants. C, spliced sequence within the 3′-UTR.
Insoluble TDP-43 Inclusions in hTDP-43A315T Mice
A pathological hallmark of ALS and frontotemporal lobar degeneration (FTLD-TDP) is the formation of neuronal insoluble TDP-43 inclusions (47, 48). We detected insoluble TDP-43 in brain lysates of hTDP-43A315T(+/−) mice (Fig. 3A). The amount of insoluble TDP-43 protein increased with age; whereas 3-month-old mice showed only small amounts of insoluble TDP-43, it became highly detectable in 1-year-old mutants but not in controls. This observation was made using an antibody detecting only the human TDP-43 (anti-hTDP-43) as well as using an antibody detecting both human and mouse isoforms (anti-total TDP-43). Despite elevated expression of human TDP-43 being detected in all tissues tested, insoluble TDP-43 was only found in the brain and not in the spleen, kidney, or liver (Fig. 3B). Using immunohistochemistry, we detected the presence of cytoplasmic TDP-43 aggregates in sections of the brain and spinal cord of 1-year-old hTDP-43A315T(+/−) mice with both anti-hTDP-43 and anti-total TDP-43 antibodies (Fig. 3C). Neuronal cytoplasmic inclusions were present in the cortex and, to some extent, in hippocampal neurons. Furthermore, neurons in the anterior horn of the spinal cord exhibited TDP-43 aggregates and nuclear clearance. These findings support the view that a mechanism leading to the formation of TDP-43 aggregates is only active in neurons.
FIGURE 3.

Insoluble TDP-43 in mutant mice. A, Western blots of brain lysates from control (ctrl) and heterozygous (+/−) mutant mice using total TDP-43 and human-specific TDP-43 antibodies at 3 and 12 months showed that mutant mice developed insoluble TDP-43 that increase with age. B, Western blots of various tissues display insoluble TDP-43 in brain lysates but not in other tissues. C, immunohistochemistry of brain and spinal cord sections using human TDP-43 and total TDP-43 antibody revealed cytoplasmic TDP-43 inclusions (arrows) in the cortex and the ventral horn of the spinal cord at 12 months. Normal nuclear staining (arrowheads) of neurons was also detectable.
TDP-43 Aggregates in Brain and Spinal Cord of hTDP-43A315T Mice
A characteristic feature of neurodegenerative diseases is the ubiquitination of protein aggregates in the cytoplasm and/or nucleus of neurons (49). Neumann et al. (47) were able to show that TDP-43 is the ubiquitinated protein in ALS and FTLD-TDP cases. To investigate possible ubiquitination of TDP-43, we performed double immunofluorescence labeling with antibodies recognizing both TDP-43 isoforms and polyubiquitin (Fig. 4, A–D). TDP-43 (green) was shown to localize to the nucleus of neurons of the brain and spinal cord in the control mice. The ubiquitin staining of the control sections (Fig. 4, A and C) displayed a rather weak signal in comparison with sections from mutant mice (Fig. 4, B and D). In the brain and in the cortex and the anterior horn of the spinal cord of mutants, we detected TDP-43 inclusions in the cytoplasm of neurons that co-localized with ubiquitin (Fig. 4, B and D). Another previously described pathological feature of TDP-43 in ALS and FTLD-TDP is hyperphosphorylation of the protein at several serine residues as well as the presence of a C-terminal 25-kDa fragment (47). To examine the phosphorylation status of TDP-43, we performed Western blot analyses using soluble and insoluble brain protein fractions of 20-month-old control and mutant mice. As positive control for a phospho-specific TDP-43 antibody, we carried out in vitro phosphorylation of brain lysates using casein kinase I (50). However, we were unable to detect hyperphosphorylation of TDP-43 in hTDP-43A315T animals. Also, disease-related C-terminal fragments of TDP-43 were not detected (not shown).
FIGURE 4.

Ubiquitin pathology in brains and spinal cords of 1-year-old mutant mice. A–D, co-labeling of ubiquitin aggregates with total TDP-43 antibody revealing co-aggregation of ubiquitin and TDP-43 in the cytoplasm of brain (B) and spinal cord (D) (white arrows). Co-aggregation was not seen in brain (A) and spinal cord (C) sections of control mice.
Neurodegeneration in Mice Expressing Human A315T TDP-43
Because ALS has been described as a progressive neurodegenerative disease affecting upper and lower motor neurons, we analyzed the motor system of hTDP-43A315T(+/−) mice. In order to assess the number of motor neurons in the ventral horn of the spinal cord, we performed Nissl staining of the lumbar spinal cord region in serial sections (Fig. 5, A and B). Counting of neurons in the sciatic motor pool revealed that there was a 10% reduction of motor neurons compared with controls in 3- and 18-month-old animals expressing the human A315T mutation (Fig. 5C), indicating a developmental phenotype. To test for a correlation between a decreased number of motor neurons and performance of the animals, several motor tests on a cohort of animals were done after 5 and 15 months. No abnormalities were seen in 5-month-old animals (not shown). In the CatWalk analysis of the mutant animals, an increase in gait abnormalities was determined, which was subtle yet significant as compared with control animals. Not only did hTDP-43A315T(+/−) mice spend more time standing on four paws compared with controls (Fig. 5D); the time at which the largest part of a paw contacted the glass plate was significantly altered for the left hind paws (Fig. 5E), and the temporal relationship of the diagonal interpaw coordination was displaced in mutants (Fig. 5F). Other motor tests (ladder, accelerating rotarod, beam walk, grip strength, and pole test) revealed no significant differences (Fig. 6). Patients suffering from ALS occasionally develop a form of dementia (51). To this purpose, we analyzed several memory tasks in one cohort of mice. The Y-maze, which is a test for working memory, showed a trend in female mutants toward unusually increased same arm returns in comparison with aged-matched controls. In other memory tests, including object recognition and IntelliCage, no abnormalities could be detected in mutant mice (not shown). Summed up, these results suggest that the ∼10% reduction of motor neurons observed is responsible for slight motoric problems.
FIGURE 5.

Nissl staining of the lumbar spinal cord region in serial sections (A and B). Counting of neurons in the sciatic motor pool (C). D–F, gait analysis. Mutant mice spent more time standing on four paws (D). Time at which the largest part of a paw contacted the glass plate was significantly altered for the left hind paws of mutants (E). The temporal relationship of the diagonal interpaw coordination was displaced in mutants (F). Error bars, S.E.
FIGURE 6.
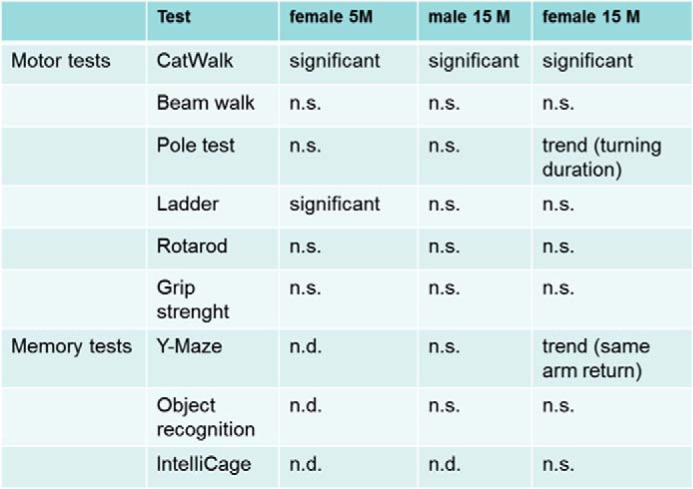
Behavioral analysis of mutant mice. There were few significant differences in the motor tests of 5- and 15-month-old mutant mice compared with age-matched controls. Only 5-month-old females had more slips on the ladder, and both 5- and 15-month-old animals showed slight abnormalities in the gait analysis (CatWalk). 15-month-old female mutants displayed longer turning duration on top of the pole, which was not yet significant. In all memory tests, mutants behaved comparably with controls. Again females showed a trend for same arm returns in the Y-maze (trend, t test, 0.1 > p < 0.05; significant, t test, p < 0.05; n.s., not significant).
Changes in the Metabolism of hTDP-43A315T Mice
Compared with both age- and sex-matched controls, hTDP-43A315T(+/−) mice showed decreased body weight of 10% at an age of 15 months (Fig. 7A). In order to investigate this phenotype, we performed blood plasma sample analysis of 6-month-old ad libitum fed and overnight fasted mice. Although no significant genotype-related differences were observed for triglyceride levels of the ad libitum fed mice, glucose concentrations were slightly increased in both male and female mutants of this group (Fig. 7B). Significant genotype-related differences were detected in blood lipid and glucose concentrations of overnight fasted mice, for which we determined decreased plasma cholesterol and triglyceride values (Fig. 7B). Ad libitum fed females showed an increased ratio of HDL cholesterol to total cholesterol, indicating a reduction of non-HDL cholesterol (Fig. 7C). In the intestine, triglycerides are broken down into NEFA, this being the molecular species absorbed by enterocytes (52). Ad libitum fed females showed increased NEFA concentrations in mutants (Fig. 7D), and plasma cholesterol levels were significantly increased in male mutants over male controls. Taken together, we observed a number of gender-specific changes in lipid content and a significant loss of bodyweight of 10% in both sexes.
FIGURE 7.

Reduced body weight and changes in metabolism parameters in mutants. A, body weight changes were compared in male and female mutants. Both sexes show significantly reduced body weight as compared with controls. B, overnight fasted mutant mice displayed decreased cholesterol and triglyceride levels. There were no significant changes in glucose levels of overnight fasted and ad libitum fed mice. C, the proportion of HDL cholesterol on total cholesterol was increased in these mice. D, slightly increased NEFA concentrations in female mutant mice (*, t test, p < 0.05; **, t test, p < 0.01; ***, t test, p < 0.001). Error bars, S.D.
TDP-43 Regulates the Expression of the Parkinson Disease-related Protein PARKIN and Its Target CD-36 Negatively
Mutations in the genes encoding Progranulin (GRN) and Fus/Tls are involved in sporadic and/or familiar forms of ALS or FTLD (53–56). To examine the expression of these proteins, we performed Western blot analysis with brain lysates of 3- and 15-month-old control and mutant animals. The expression levels of neither GRN nor FUS were affected by elevated hTDP-43A315T protein levels (not shown). Interestingly, the expression levels of the Parkinson disease-related protein Parkin were robustly reduced to ∼30% of wild type controls (Fig. 8A) at all ages, tested by real-time PCR and Western blotting. Parkin has previously been shown to be a potential TDP-43 target gene in iCLIP analysis (17). Parkin also became connected to the process of mitophagy (57). Hence, reduction of Parkin levels may be in agreement with accumulation of impaired mitochondria. For this reason, we analyzed protein levels of OPA1 (optic atrophy 1), a protein controlling both mitochondrial fusion and cristae morphology (58). We found an increase of OPA1 in young mutant animals, indicating increased mitochondrial fusion. On the other hand, there was a shift toward more fragmentation of mitochondria in old mutants (Fig. 8B). Furthermore, Parkin has been brought into relation to the fat metabolism by regulating CD36 (59). We therefore analyzed liver protein lysates of old and young hTDP-43A315T animals for CD36 protein levels. Interestingly, a significant reduction of CD36 levels of ∼50% was determined in 15-month-old mutants compared with controls (Fig. 8C). Collectively, these data suggest that elevated protein levels of hTDP-43A315T do not affect protein levels of FUS and GRN, whereas a clear negative effect in older animals on the Parkinson disease-related protein PARKIN, the mitochondrial dynamin-related protein OPA1, and the fat metabolism-associated protein CD36 is observed.
FIGURE 8.

Downstream targets of TDP-43. Western blot analysis of brain lysates from 3- and 15-month-old mutants compared with controls showing decreased protein level for the Parkinson disease-related protein PARKIN (A) of about 70%. The autophagic marker Opa-1 was found to be elevated in 3-month-old and decreased in 15-month-old mutants (B). CD-36 protein was significantly reduced in old mutants as compared with controls (C). Error bars, S.E.
Transcriptome Analysis of Brain and Muscle
Transcriptome analysis was performed for brain and muscle using 17-week-old male mice, analyzing 4–6 biological replicates of each genotype group (in a total of 20 hybridizations). Statistical analysis of transcriptome profiles of the brain identified 50 differentially regulated genes in Tardbp mutant and control mice (Fig. 9). IPA, based on 382 differentially expressed probes of microarray data from hTDP-43A315T mutants, showed two significantly overrepresented biological functions: (a) cell death (p value = 2.4 × 10⁻⁴; including the regulated transcripts ATP6AP2, BCL2A1, BECN1, BMPR1B, CASP9, CD300LD, CDKN2C, EIF2AK4, EMD, ENO1, GPX4, IAPP, INSR, IRF1, MDM2, MSH2, RECQL, SF3B14, TGM2, TNFRSF25, and UBE2K) as well as (b) energy production/lipid metabolism (p value = 4.0 × 10⁻³; incorporating AADAC, ECHS1, ESRRA, IAPP, INSR, LIPE, PPARGC1B, and VDR; Fig. 10). In addition, a specific search for enriched gene ontology categories with the same input data revealed two significantly overrepresented biological functions: (a) respiratory electron transport chain (p value = 6.8 × 10⁻⁵; including ATP5F1, COX5A, NDUFA6, NDUFA8, NDUFS4, NDUFS7, and SDHB) and (b) mitochondria (p value = 3.2 × 10⁻⁵; with regulated transcripts ACOT13, ATP5F1, AZI2, C6orf57, CASP9, COX5A, CYP11B2, DNAJC19, ECHS1, GCET2, GPX4, GTPBP8, HEMK1, HSH2D, IDH3B, IDH3G IVD, LOC100046650, MDH1, MLXIP, MPV17L, MRPL18, MRPL27, MRPL46, MRPL52, NDUFA6, NDUFA8, NDUFS4, NDUFS7, NLRX1, PPA2, RAB8B, SDHB, SIRT3, SLC25A16, SLC25A21, SRP19, TGM2, TIMM10, TIMM8B, and WARS2).
FIGURE 9.

Heat map of brain from gene expression profiling experiments, Tardbp mutants versus control animals. The expression differences are represented by the -fold changes of mutant/mean controls. Scale bar, ratio of the -fold induction. Blue/yellow, transcriptional repression/induction in the mutant mice. The color intensity reflects the magnitude of the change in gene expression levels on average.
FIGURE 10.

IPA network energy production/lipid metabolism of regulated genes in brain of Tardbp mutant mice. Nodes with red color represent up-regulated, whereas those with green color represent down-regulated transcripts from microarray data.
Based on the results of the microarrays, we performed transmission electron microscopy (TEM) of the motor cortex and hippocampus using 18-month-old animals. Neuronal cells were identified by their surrounding myelin sheath. We showed that neurons of heterozygous hTDP-43A315T animals frequently displayed a mitochondrial dysmorphology with highly reduced cristae formation, which was not seen in wild type littermates (Fig. 11). Abnormal cristae morphology was not observed in spinal cords (data not shown).
FIGURE 11.

Transmission electron micrographs of mitochondria of hippocampus and motor cortex. Mitochondria of myelinated neurons were compared between wild type and heterozygotes. Hippocampus, mitochondria of the hippocampus of heterozygous mice did not show any alterations in comparison with wild type litermates (scale bar, 200 nm). Cortex, in the cortex of heterozygous mice, mitochondria appeared with a reduced number of cristae in comparison with wild type litermates (scale bars, 200 nm).
DISCUSSION
An animal model of TDP-43 pathology with close resemblance to human disease could accelerate the development of drugs, potentially slowing down disease progression. Mouse models expressing TDP-43 mutations in trans have often turned out unsatisfactory in this respect (1, 60). Neither loss nor gain of function mutants could simultaneously recapitulate all of the pathologic signs reported from ALS patients (47–48), such as progressive upper or lower motor neuron loss, skeletal muscle atrophy and paralysis, respiratory muscle failure, and the presence of ubiquitinated and phosphorylated TDP-43 and C-terminal fragments (11–12, 35, 61–65). The mutant forms of TDP-43 were not particularly aggregation-prone, and the target spectra of wild type and mutant TDP-43 are apparently identical (66). When overexpressed, the wild type form of TDP-43 caused an even more severe phenotype than the mutant protein or C-terminal fragment (67–72). ALS-like phenotypes observed in transgenic animals had manifested already in younger mutants and, unlike the human condition, often resulted in early death (60, 73).
The recombinase-mediated cassette exchange (RMCE) mouse model of TDP-43 described in the present study for the first time provides in vivo evidence for mitochondrial dysmorphology and dysfunction as well as altered lipid metabolism, which may support an interpretation as a predisease model for a neurodegenerative disease. We show that the already suspected negative feedback loop of TDP-43 on its own transcription (17, 31) has significant in vivo relevance, and we provide a minimal 3′-RACE fragment of 800 bp, which was sufficient to exert negative regulation of Tardbp transcription (Fig. 2). When coupled to a bovine growth hormone poly(A) sequence, TDP-43 mRNA and protein levels were elevated up to 3-fold in total, although transcription of the non-affected allele was regulated down to only 20% of wild type levels simultaneously (Fig. 1D). Hence, it is important to stress that this mouse is an overexpression model, with more than 90% of all TDP-43 protein being the human A315T form. Down-regulation of the wild type allele indicated that the TDP-43 protein with the A315T point mutation was entirely functional with respect to its self-regulating ability. The mechanism of the negative autofeedback of TDP-43 has been recently determined as self-splicing of the proximal poly(A) signal, which results in nuclear retention of the spliced transcript (74).
It has been well described that elevated TDP-43 protein levels can assert toxic effects on cells (33, 75). A number of studies have reported elevated expression of TDP-43 in FTLD patients (76–79). A strong argument in favor of the importance of the 3′-UTR in humans was the discovery by Gitcho et al. (80) of an FTLD-motor neuron disease patient, carrying a 3′-UTR point mutation. TDP-43 levels were increased 2-fold in this case, and the age of 66 years at disease onset was earlier than in a patient carrying the A315T point mutation (83 years). We propose a model in which the negative feedback loop of TDP-43 is critical for development of TDP-43 pathology; once the TDP-43 protein is located in the cytoplasm, as a result of either TDP-43 protein modification, modified interaction partners, or yet unidentified cellular stressors, the feedback loop in the nucleus will instantly cause an overshooting of TDP-43 protein levels. An excess of TDP-43 protein should be removed by ubiquitination with subsequent proteasomal activity. However, with continuous stress, the cellular proteasome is outnumbered by protein production, which then results in cytoplasmic inclusions of ubiquitinated TDP-43. As we show, elevated levels of TDP-43 (A315T) do not necessarily lead to the formation of insoluble protein. Although TDP-43 protein levels were high in all tissues tested, we were unable to detect insoluble protein in tissues other than the brain and spinal cord (Fig. 2). This indicates that a yet unidentified mechanism exists, which promotes insolubility of TDP-43 in neuronal tissues. The pathway analysis of microarray data from hTDP-43A315T transgenic knock-in animals showed that clusters of regulated transcripts are involved in either cell death, energy production, respiratory electron chain, mitochondrial function, or lipid metabolism (Fig. 10). On an hTDP-43A315T-overexpressing background, genes were mostly negatively regulated, with the exception of Lhx1 (LIM homeobox protein 1), Masp2 (mannan-binding lectin serine peptidase 2), and Eno1 (enolase 1) (Fig. 9). Lim-1 has a developmental role in head formation (81), and Masp2 is involved in the complement cascade (82), whereas Eno1 encodes for α-enolase, which is a glycolytic enzyme, and for Mbp1 (Myc-binding protein) (83).
We demonstrate that elevated levels of TDP-43 A315T protein resulted in an increase in glucose and cholesterol concentrations in the plasma of ad libitum fed animals as well as increased NEFA and decreased cholesterol and triglyceride levels in plasma of overnight fasted mice (Fig. 7). However, all cells are capable of metabolizing NEFA by esterification to glycerol, and in the blood, the major proportion of fatty acids is transported as lipoprotein-associated triglycerides. Fatty acids are released from triglycerides by lipolytic activity occurring as intravascular lipoprotein lipolysis and intracellular lipolysis (84). Although 80–90% of infused lipoprotein-associated triglycerides are usually turned into NEFA within 15 min, plasma NEFA levels increase only moderately due to a high turnover of free fatty acids (85). Prolonged fasting of mice elevates lipolytic activity, resulting in an almost 2-fold increase of free fatty acids and glycerol in the plasma of overnight fasted mice (86). Weight loss is a well known phenomenon among ALS patients (87). A high lipid content in the blood has been correlated with survival, and a high lipid diet has been suggested as beneficial for many ALS cases (88).
hTDP-43A315T-overexpressing mice were ∼10% underweight in comparison with littermates at all ages (Fig. 7A). Measurements of bone density, lean mass, and fat mass from each 10 wild type or mutant males and females indicated that this loss of body mass was not due to skeletal muscle atrophy but was partially due to reduced bone mineral density in females and mainly a result of reduced fat tissue. On average, mutant females showed a slightly elevated fat mass reduction from 5.4 g in wild type littermates to 2.0 g (37%), whereas mutant males showed a reduction in fat mass from 7.82 to 6.56 g (84%).
A rapid loss of fat mass, leading to death 9–18 days after induction, was previously reported from conditional TDP-43 mutant mice after cross-breeding with a widely expressed, tamoxifen-inducible Cre deleter strain (89). The authors demonstrated a decrease in the expression of Tbc1d1 in mutant ES cells. Tbc1d1 is required for Glut4 translocation to the membrane of skeletal muscle cells and glucose uptake (90) and is involved in human obesity (91, 92). We therefore examined TBC1D1 protein levels in hTDP-43A315T mutants but did not detect any abnormalities in skeletal muscle or other tissues (not shown). The uptake of free fatty acids can be mediated in a large number of cells by the fatty acid transporter (FAT), also referred to as CD36. CD36 has been previously associated with insulin resistance (93) and atherosclerotic cardiovascular diseases (94). We therefore analyzed the expression level of CD36 in hTDP-43A315T mutants and found a significant decrease of CD36 protein expression (Fig. 8C). A reduction of CD36 and thus a correlation with fat metabolism has been recently reported from Parkin mutant animals (59). Whether the relative reduction of Parkin detectable in hTDP-43A315T animals (Fig. 8A) was causing a decrease in CD36 is unclear. Parkin was first identified as a potential TDP-43 target gene by Polymenidou et al. (17). Parkin expression is usually induced in response to starvation and is elevated upon inhibition of mTOR signaling through rapamycin (95).
Motoric tests revealed normal grip strength of the mutants and only slight impairment of motor control (ladder, catwalk, rotarod; see Fig. 5, D–F), which may also hint at yet undiscovered cerebellar dysfunction. However, when motor neurons of a 15-month-old cohort of five mutants and five wild types were counted in a double-blinded fashion, a reduction of 10% was evident in the mutants (Fig. 5C). We questioned whether this was a developmental defect or a progressive phenotype and counted motor neurons also in 3-month-old animals. As it turned out, the 10% reduction of motor neurons could be already observed in younger animals, indicating a developmental phenotype that did not worsen with age (Fig. 5C). These results probably illustrate the vulnerability of motor neurons to high TDP-43 expression levels and may be unrelated to the A315T mutation. However, a similar construct with a hTDP-43 wild type cDNA was not transmitted through the germ line, and direct comparisons were therefore not possible.
Transcriptome analysis followed by IPA and TEM revealed mitochondrial dysfunction in the brain (IPA) and frequent mitochondrial dysmorphology in the motor cortex (TEM) of hTDP-43A315T transgenic knock-in animals (Figs. 9 and 10). Mitochondrial abnormalities were also reported from a mouse model that overexpressed human wild type TDP-43 in the developing forebrain conditionally. However, they were not observed after delayed overexpression in adult animals and were therefore considered developmental abnormalities (96). Whether mitochondrial abnormality could explain the observed metabolic changes and altered body weight composition of hTDP-43A315T animals will be subject of future studies.
Summary and Outlook
With respect to the fact that patients carrying A315T mutations develop either ALS or motor neuron disease (80, 97) and a patient carrying a 3′-UTR mutation of TDP-43 leading to overexpression of the protein developed FTLD, the mouse model presented here is interpreted as a predisease model for FTLD-motor neuron disease. In agreement with this interpretation, TARDBPKIA315T animals showed slight gait and cognitive abnormalities along with a decrease in number of motor neurons but did not show primary motor phenotypes or muscular atrophy. We therefore believe that the animals could be invaluable in identifying environmental or genetic triggers that finally lead to full-blown FTLD or ALS.
Acknowledgments
We thank Helga Weichsberger, Sandra Geissler, Denise Herold, Irina Rodionova, Elfie Holupirek, Susanne Wittich, Anja Wohlbier, and Reinhard Seeliger for technical assistance. We are grateful to Anja Capell and Christian Haass for a progranulin antibody. We also thank Constantin Stautner and Jordi Guimera for critical reading of the manuscript.
This work was supported by KNDD2 Grant FKZ 01 GI 1005D (to T. F.). This work was also supported by the program for medical genome research with financial support from the Federal Ministry for Education and Research (BMBF) grant “Funktionelle Tiermodelle für die Kandidatengene der Alzheimerschen Erkrankung” (01GS08133), the grant “Verhalten” (01GS0850), and furthermore by the Helmholtz Alliance “Mental Health in an Aging Society” (HELMA) (HA215). This work was supported by the Cluster of Excellence Frankfurt Macromolecular Complexes at the Goethe University Frankfurt DFG project EXC 115 (to A. R. and S. K.). This study was also supported in part by a grant from the German Federal Ministry of Education and Research (BMBF) to the German Center for Diabetes Research (DZD e.V.). The German Mouse Clinic was supported by NGFNplus Grant 01GS0850 and Infrafrontier Grant 01KX1012 from the BMBF and the EU (EUMODIC LSHG-2006-037188). This work was also supported by grants from the National Genome Research Network (NGFN 01GR) (to J. B.). This project was also supported by funds from the German Federal Ministry of Education and Research (German Center for Vertigo and Balance Disorders Grant 01 EO 0901).
- FTLD
- frontotemporal lobar dementia
- ALS
- amyotrophic lateral sclerosis
- BisTris
- 2-[bis(2-hydroxyethyl)amino]-2-(hydroxymethyl)propane-1,3-diol
- ES
- embryonic stem
- En
- embryonic day n
- NEFA
- non-esterified fatty acid(s)
- IPA
- ingenuity pathway analysis.
REFERENCES
- 1. Rademakers R., Neumann M., Mackenzie I. R. (2012) Advances in understanding the molecular basis of frontotemporal dementia. Nat. Rev. Neurol. 8, 423–434 [DOI] [PMC free article] [PubMed] [Google Scholar]
- 2. Andersen P. M., Al-Chalabi A. (2011) Clinical genetics of amyotrophic lateral sclerosis: what do we really know? Nat. Rev. Neurol. 7, 603–615 [DOI] [PubMed] [Google Scholar]
- 3. Janssens J., Kleinberger G., Wils H., Van Broeckhoven C. (2011) The role of mutant TAR DNA-binding protein 43 in amyotrophic lateral sclerosis and frontotemporal lobar degeneration. Biochem. Soc. Trans. 39, 954–959 [DOI] [PubMed] [Google Scholar]
- 4. Bonini N. M., Gitler A. D. (2011) Model organisms reveal insight into human neurodegenerative disease: ataxin-2 intermediate-length polyglutamine expansions are a risk factor for ALS. J. Mol. Neurosci. 45, 676–683 [DOI] [PMC free article] [PubMed] [Google Scholar]
- 5. Wilson A. C., Dugger B. N., Dickson D. W., Wang D. S. (2011) TDP-43 in aging and Alzheimer's disease. A review. Int. J. Clin. Exp. Pathol. 4, 147–155 [PMC free article] [PubMed] [Google Scholar]
- 6. Jucker M., Walker L. C. (2011) Pathogenic protein seeding in Alzheimer disease and other neurodegenerative disorders. Ann. Neurol. 70, 532–540 [DOI] [PMC free article] [PubMed] [Google Scholar]
- 7. Herman A. M., Khandelwal P. J., Stanczyk B. B., Rebeck G. W., Moussa C. E. (2011) β-Amyloid triggers ALS-associated TDP-43 pathology in AD models. Brain Res. 22, 191–199 [DOI] [PMC free article] [PubMed] [Google Scholar]
- 8. Jellinger K. A. (2008) Neuropathological aspects of Alzheimer disease, Parkinson disease and frontotemporal dementia. Neurodegener. Dis. 5, 118–121 [DOI] [PubMed] [Google Scholar]
- 9. Wang H. Y., Wang I. F., Bose J., Shen C. K. (2004) Structural diversity and functional implications of the eukaryotic TDP gene family. Genomics 83, 130–139 [DOI] [PubMed] [Google Scholar]
- 10. Colombrita C., Zennaro E., Fallini C., Weber M., Sommacal A., Buratti E., Silani V., Ratti A. (2009) TDP-43 is recruited to stress granules in conditions of oxidative insult. J. Neurochem. 111, 1051–1061 [DOI] [PubMed] [Google Scholar]
- 11. Sephton C. F., Good S. K., Atkin S., Dewey C. M., Mayer P., 3rd, Herz J., Yu G. (2010) TDP-43 is a developmentally regulated protein essential for early embryonic development. J. Biol. Chem. 285, 6826–6834 [DOI] [PMC free article] [PubMed] [Google Scholar]
- 12. Wu L. S., Cheng W. C., Hou S. C., Yan Y. T., Jiang S. T., Shen C. K. (2010) TDP-43, a neuro-pathosignature factor, is essential for early mouse embryogenesis. Genesis 48, 56–62 [DOI] [PubMed] [Google Scholar]
- 13. Chen-Plotkin A. S., Lee V. M., Trojanowski J. Q. (2010) TAR DNA-binding protein 43 in neurodegenerative disease. Nat. Rev. Neurol. 6, 211–220 [DOI] [PMC free article] [PubMed] [Google Scholar]
- 14. Turner B. J., Bäumer D., Parkinson N. J., Scaber J., Ansorge O., Talbot K. (2008) TDP-43 expression in mouse models of amyotrophic lateral sclerosis and spinal muscular atrophy. BMC Neurosci. 9, 104. [DOI] [PMC free article] [PubMed] [Google Scholar]
- 15. Ayala Y. M., Zago P., D'Ambrogio A., Xu Y. F., Petrucelli L., Buratti E., Baralle F. E. (2008) Structural determinants of the cellular localization and shuttling of TDP-43. J. Cell Sci. 121, 3778–3785 [DOI] [PubMed] [Google Scholar]
- 16. Kawahara Y., Mieda-Sato A. (2012) TDP-43 promotes microRNA biogenesis as a component of the Drosha and Dicer complexes. Proc. Natl. Acad. Sci. U.S.A. 109, 3347–3352 [DOI] [PMC free article] [PubMed] [Google Scholar]
- 17. Polymenidou M., Lagier-Tourenne C., Hutt K. R., Huelga S. C., Moran J., Liang T. Y., Ling S. C., Sun E., Wancewicz E., Mazur C., Kordasiewicz H., Sedaghat Y., Donohue J. P., Shiue L., Bennett C. F., Yeo G. W., Cleveland D. W. (2011) Long pre-mRNA depletion and RNA missplicing contribute to neuronal vulnerability from loss of TDP-43. Nat. Neurosci. 14, 459–468 [DOI] [PMC free article] [PubMed] [Google Scholar]
- 18. Tollervey J. R., Curk T., Rogelj B., Briese M., Cereda M., Kayikci M., König J., Hortobágyi T., Nishimura A. L., Zupunski V., Patani R., Chandran S., Rot G., Zupan B., Shaw C. E., Ule J. (2011) Characterizing the RNA targets and position-dependent splicing regulation by TDP-43. Nat. Neurosci. 14, 452–458 [DOI] [PMC free article] [PubMed] [Google Scholar]
- 19. Xiao S., Sanelli T., Dib S., Sheps D., Findlater J., Bilbao J., Keith J., Zinman L., Rogaeva E., Robertson J. (2011) RNA targets of TDP-43 identified by UV-CLIP are deregulated in ALS. Mol. Cell Neurosci. 47, 167–180 [DOI] [PubMed] [Google Scholar]
- 20. Sephton C. F., Cenik C., Kucukural A., Dammer E. B., Cenik B., Kucukural A., Dammer E. B., Cenik B., Han Y., Dewey C. M., Roth F. P., Herz J., Peng J., Moore M. J., Yu G. (2011) Identification of neuronal RNA targets of TDP-43-containing ribonucleoprotein complexes. J. Biol. Chem. 286, 1204–1215 [DOI] [PMC free article] [PubMed] [Google Scholar]
- 21. Buratti E., Baralle F. E. (2008) Multiple roles of TDP-43 in gene expression, splicing regulation, and human disease. Front. Biosci. 13, 867–878 [DOI] [PubMed] [Google Scholar]
- 22. Polymenidou M., Lagier-Tourenne C., Hutt K. R., Bennett C. F., Cleveland D. W., Yeo G. W. (2012) Misregulated RNA processing in amyotrophic lateral sclerosis. Brain Res. 1462, 3–15 [DOI] [PMC free article] [PubMed] [Google Scholar]
- 23. Liu-Yesucevitz L., Bilgutay A., Zhang Y. J., Vanderweyde T., Citro A., Mehta T., Zaarur N., McKee A., Bowser R., Sherman M., Petrucelli L., Wolozin B. (2010) Tar DNA binding protein-43 (TDP-43) associates with stress granules: analysis of cultured cells and pathological brain tissue. PLoS One 5, e13250. [DOI] [PMC free article] [PubMed] [Google Scholar]
- 24. Dewey C. M., Cenik B., Sephton C. F., Dries D. R., Mayer P., 3rd, Good S. K., Johnson B. A., Herz J., Yu G. (2011) TDP-43 is directed to stress granules by sorbitol, a novel physiological osmotic and oxidative stressor. Mol. Cell. Biol. 31, 1098–1108 [DOI] [PMC free article] [PubMed] [Google Scholar]
- 25. Dewey C. M., Cenik B., Sephton C. F., Johnson B. A., Herz J., Yu G. (2012) TDP-43 aggregation in neurodegeneration: Are stress granules the key? Brain Res. 1462, 16–25 [DOI] [PMC free article] [PubMed] [Google Scholar]
- 26. Gendron T. F., Josephs K. A., Petrucelli L. (2010) Review: transactive response DNA-binding protein 43 (TDP-43): mechanisms of neurodegeneration. Neuropathol. Appl. Neurobiol. 36, 97–112 [DOI] [PMC free article] [PubMed] [Google Scholar]
- 27. Ticozzi N., Ratti A., Silani V. (2010) Protein aggregation and defective RNA metabolism as mechanisms for motor neuron damage. CNS Neurol. Disord. Drug Targets 9, 285–296 [DOI] [PubMed] [Google Scholar]
- 28. Kuo P. H., Doudeva L. G., Wang Y. T., Shen C. K., Yuan H. S. (2009) Structural insights into TDP-43 in nucleic-acid binding and domain interactions. Nucleic Acids Res. 37, 1799–1808 [DOI] [PMC free article] [PubMed] [Google Scholar]
- 29. Wang I. F., Chang H. Y., Hou S. C., Liou G. G., Way T. D., James Shen C. K. (2012) The self-interaction of native TDP-43 C terminus inhibits its degradation and contributes to early proteinopathies. Nat. Commun. 3, 766. [DOI] [PubMed] [Google Scholar]
- 30. Freibaum B. D., Chitta R. K., High A. A., Taylor J. P. (2010) Global analysis of TDP-43 interacting proteins reveals strong association with RNA splicing and translation machinery. J. Proteome Res. 9, 1104–1120 [DOI] [PMC free article] [PubMed] [Google Scholar]
- 31. Ayala Y. M., De Conti L., Avendaño-Vázquez S. E., Dhir A., Romano M., D'Ambrogio A., Tollervey J., Ule J., Baralle M., Buratti E., Baralle F. E. (2011) TDP-43 regulates its mRNA levels through a negative feedback loop. EMBO J. 30, 277–288 [DOI] [PMC free article] [PubMed] [Google Scholar]
- 32. Budini M., Buratti E. (2011) TDP-43 autoregulation: implications for disease. J. Mol. Neurosci. 45, 473–479 [DOI] [PubMed] [Google Scholar]
- 33. Johnson B. S., Snead D., Lee J. J., McCaffery J. M., Shorter J., Gitler A. D. (2009) TDP-43 is intrinsically aggregation-prone, and amyotrophic lateral sclerosis-linked mutations accelerate aggregation and increase toxicity. J. Biol. Chem. 284, 20329–20339 [DOI] [PMC free article] [PubMed] [Google Scholar]
- 34. Estes P. S., Boehringer A., Zwick R., Tang J. E., Grigsby B., Zarnescu D. C. (2011) Wild-type and A315T mutant TDP-43 exert differential neurotoxicity in a Drosophila model of ALS. Hum. Mol. Genet. 20, 2308–2321 [DOI] [PMC free article] [PubMed] [Google Scholar]
- 35. Wegorzewska I., Bell S., Cairns N. J., Miller T. M., Baloh R. H. (2009) TDP-43 mutant transgenic mice develop features of ALS and frontotemporal lobar degeneration. Proc. Natl. Acad. Sci. U.S.A. 106, 18809–18814 [DOI] [PMC free article] [PubMed] [Google Scholar]
- 36. Wang Q., Zhang X., Chen S., Zhang X., Zhang S., Youdium M., Le W. (2011) Prevention of motor neuron degeneration by novel iron chelators in SOD1(G93A) transgenic mice of amyotrophic lateral sclerosis. Neurodegener. Dis. 8, 310–321 [DOI] [PubMed] [Google Scholar]
- 37. Dance A. (2010) TDP-43 models coverage. J. Alzheimers Dis. 21, 1403–1408 [DOI] [PubMed] [Google Scholar]
- 38. Schebelle L., Wolf C., Stribl C., Javaheri T., Schnütgen F., Ettinger A., Ivics Z., Hansen J., Ruiz P., von Melchner H., Wurst W., Floss T. (2010) Efficient conditional and promoter-specific in vivo expression of cDNAs of choice by taking advantage of recombinase-mediated cassette exchange using FlEx gene traps. Nucleic Acids Res. 38, e106. [DOI] [PMC free article] [PubMed] [Google Scholar]
- 39. Neumann M., Kwong L. K., Lee E. B., Kremmer E., Flatley A., Xu Y., Forman M. S., Troost D., Kretzschmar H. A., Trojanowski J. Q., Lee V. M. (2009) Phosphorylation of S409/410 of TDP-43 is a consistent feature in all sporadic and familial forms of TDP-43 proteinopathies. Acta Neuropathol. 117, 137–149 [DOI] [PMC free article] [PubMed] [Google Scholar]
- 40. Li M., Pevny L., Lovell-Badge R., Smith A. (1998) Generation of purified neural precursors from embryonic stem cells by lineage selection. Curr. Biol. 8, 971–974 [DOI] [PubMed] [Google Scholar]
- 41. Hill P. D., Wurst W. (1993) Screening of novel pattern formation of genes using gene trap approaches. Methods Enzymol. 225, 664–681 [DOI] [PubMed] [Google Scholar]
- 42. Hölter S. M., Mandillo S., Tucci V., Nolan P. M., Meziane H., Banchaabouchi M. A., Kallnik M., Lad H. V., Nolan P. M., Ouagazzal A. M., Coghill E. L., Gale K., Golini E., Jacquot S., Krezel W., Parker A., Riet F., Schneider I., Marazziti D., Auwerx J., Brown S. D., Chambon P., Rosenthal N., Tocchini-Valentini G., Wurst W. (2008) Reliability, Robustness and Reproducibility in mouse behavioral phenotyping: a cross-laboratory study. Physiol. Genomics 34, 243–255 [DOI] [PMC free article] [PubMed] [Google Scholar]
- 43. Hölter S. M., Glasl L. (2011) in Animal Models of Movement Disorders (Dunnett S. B., Lane E., eds) pp. 109–133, Humana Press, Inc., New York [Google Scholar]
- 44. Zhou X., Tuck D. P. (2007) MSVM-RFE: extensions of SVM-RFE for multiclass gene selection on DNA microarray data. Bioinformatics 23, 1106–1114 [DOI] [PubMed] [Google Scholar]
- 45. Augustin R., Lichtenthaler S. F., Greeff M., Hansen J., Wurst W., Trümbach D. (2011) Bioinformatics identification of modules of transcription factor binding sites in Alzheimer's disease-related genes by in silico promoter analysis and microarrays. Int. J. Alzheimers Dis. 2011, 154325. [DOI] [PMC free article] [PubMed] [Google Scholar]
- 46. Ashburner M., Ball C. A., Blake J. A., Botstein D., Butler H., Cherry J. M., Davis A. P., Dolinski K., Dwight S. S., Eppig J. T., Harris M. A., Hill D. P., Issel-Tarver L., Kasarskis A., Lewis S., Matese J. C., Richardson J. E., Ringwald M., Rubin G. M., Sherlock G. (2000) Gene ontology: tool for the unification of biology. The Gene Ontology Consortium. Nat. Genet. 25, 25–29 [DOI] [PMC free article] [PubMed] [Google Scholar]
- 47. Neumann M., Sampathu D. M., Kwong L. K., Truax A. C., Micsenyi M. C., Chou T. T., Bruce J., Schuck T., Grossman M., Clark C. M., McCluskey L. F., Miller B. L., Masliah E., Mackenzie I. R., Feldman H., Feiden W., Kretzschmar H. A., Trojanowski J. Q., Lee V. M. (2006) Ubiquitinated TDP-43 in frontotemporal lobar degeneration and amyotrophic lateral sclerosis. Science 314, 130–133 [DOI] [PubMed] [Google Scholar]
- 48. Arai T., Hasegawa M., Akiyama H., Ikeda K., Nonaka T., Mori H., Mann D., Tsuchiya K., Yoshida M., Hashizume Y., Oda T. (2006) TDP-43 is a component of ubiquitin-positive tau-negative inclusions in frontotemporal lobar degeneration and amyotrophic lateral sclerosis. Biochem. Biophys. Res. Commun. 351, 602–611 [DOI] [PubMed] [Google Scholar]
- 49. Forman MS, Trojanowski JQ, Lee VM. (2004) Neurodegenerative diseases: a decade of discoveries paves the way for therapeutic breakthroughs. Nat. Med. 10, 1055–1063 [DOI] [PubMed] [Google Scholar]
- 50. Kametani F., Nonaka T., Suzuki T., Arai T., Dohmae N., Akiyama H., Hasegawa M. (2009) Identification of casein kinase-1 phosphorylation sites on TDP-43. Biochem. Biophys. Res. Commun. 382, 405–409 [DOI] [PubMed] [Google Scholar]
- 51. Lillo P., Hodges J. R. (2009) Frontotemporal dementia and motor neurone disease. Overlapping clinic-pathological disorders. J. Clin. Neurosci. 16, 1131–1135 [DOI] [PubMed] [Google Scholar]
- 52. Fergani A., Oudart H., Gonzalez De Aguilar J. L., Fricker B., René F., Hocquette J. F., Meininger V., Dupuis L., Loeffler J. P. (2007) Increased peripheral lipid clearance in an animal model of amyotrophic lateral sclerosis. J. Lipid Res. 48, 1571–1580 [DOI] [PMC free article] [PubMed] [Google Scholar]
- 53. Baker M., Mackenzie I. R., Pickering-Brown S. M., Gass J., Rademakers R., Lindholm C., Snowden J., Adamson J., Sadovnick A. D., Rollinson S., Cannon A., Dwosh E., Neary D., Melquist S., Richardson A., Dickson D., Berger Z., Eriksen J., Robinson T., Zehr C., Dickey C. A., Crook R., McGowan E., Mann D., Boeve B., Feldman H., Hutton M. (2006) Mutations in progranulin cause tau-negative frontotemporal dementia linked to chromosome 17. Nature 442, 916–919 [DOI] [PubMed] [Google Scholar]
- 54. Cruts M., Gijselinck I., van der Zee J., Engelborghs S., Wils H., Pirici D., Rademakers R., Vandenberghe R., Dermaut B., Martin J. J., van Duijn C., Peeters K., Sciot R., Santens P., De Pooter T., Mattheijssens M., Van den Broeck M., Cuijt I., Vennekens K., De Deyn P. P., Kumar-Singh S., Van Broeckhoven C. (2006) Null mutations in progranulin cause ubiquitin-positive frontotemporal dementia linked to chromosome 17q21. Nature 442, 920–924 [DOI] [PubMed] [Google Scholar]
- 55. Kwiatkowski T. J., Jr., Bosco D. A., Leclerc A. L., Tamrazian E., Vanderburg C. R., Russ C., Davis A., Gilchrist J., Kasarskis E. J., Munsat T., Valdmanis P., Rouleau G. A., Hosler B. A., Cortelli P., de Jong P. J., Yoshinaga Y., Haines J. L., Pericak-Vance M. A., Yan J., Ticozzi N., Siddique T., McKenna-Yasek D., Sapp P. C., Horvitz H. R., Landers J. E., Brown R. H., Jr. (2009) Mutations in the FUS/TLS gene on chromosome 16 cause familial amyotrophic lateral sclerosis. Science 323, 1205–1208 [DOI] [PubMed] [Google Scholar]
- 56. Vance C., Rogelj B., Hortobágyi T., De Vos K. J., Nishimura A. L., Sreedharan J., Hu X., Smith B., Ruddy D., Wright P., Ganesalingam J., Williams K. L., Tripathi V., Al-Saraj S., Al-Chalabi A., Leigh P. N., Blair I. P., Nicholson G., de Belleroche J., Gallo J. M., Miller C. C., Shaw C. E. (2009) Mutations in FUS, an RNA processing protein, cause familial amyotrophic lateral sclerosis type 6. Science 323, 1208–1211 [DOI] [PMC free article] [PubMed] [Google Scholar]
- 57. Narendra D., Tanaka A., Suen D. F., Youle R. J. (2008) Parkin is recruited selectively to impaired mitochondria and promotes their autophagy. J. Cell Biol. 183, 795–803 [DOI] [PMC free article] [PubMed] [Google Scholar]
- 58. Hoppins S., Lackner L., Nunnari J. (2007) The machines that divide and fuse mitochondria. Annu. Rev. Biochem. 76, 751–780 [DOI] [PubMed] [Google Scholar]
- 59. Kim K. Y., Stevens M. V., Akter M. H., Rusk S. E., Huang R. J., Cohen A., Noguchi A., Springer D., Bocharov A. V., Eggerman T. L., Suen D. F., Youle R. J., Amar M., Remaley A. T., Sack M. N. (2011) Parkin is a lipid-responsive regulator of fat uptake in mice and mutant human cells. J. Clin. Invest. 121, 3701–3712 [DOI] [PMC free article] [PubMed] [Google Scholar]
- 60. Tsao W., Jeong Y. H., Lin S., Ling J., Price D. L., Chiang P. M., Wong P. C. (2012) Rodent models of TDP-43: recent advances. Brain Res. 1462, 26–39 [DOI] [PMC free article] [PubMed] [Google Scholar]
- 61. Wils H., Kleinberger G., Janssens J., Pereson S., Joris G., Cuijt I., Smits V., Ceuterick-de Groote C., Van Broeckhoven C., Kumar-Singh S. (2010) TDP-43 transgenic mice develop spastic paralysis and neuronal inclusions characteristic of ALS and frontotemporal lobar degeneration. Proc. Natl. Acad. Sci. U.S.A. 107, 3858–3863 [DOI] [PMC free article] [PubMed] [Google Scholar]
- 62. Igaz L. M., Kwong L. K., Lee E. B., Chen-Plotkin A., Swanson E., Unger T., Malunda J., Xu Y., Winton M. J., Trojanowski J. Q., Lee V. M. (2011) Dysregulation of the ALS-associated gene TDP-43 leads to neuronal death and degeneration in mice. J. Clin. Invest. 121, 726–738 [DOI] [PMC free article] [PubMed] [Google Scholar]
- 63. Huang C., Tong J., Bi F., Zhou H., Xia X. G. (2012) Mutant TDP-43 in motor neurons promotes the onset and progression of ALS in rats. J. Clin. Invest. 122, 107–118 [DOI] [PMC free article] [PubMed] [Google Scholar]
- 64. Kabashi E., Lin L., Tradewell M. L., Dion P. A., Bercier V., Bourgouin P., Rochefort D., Bel Hadj S., Durham H. D., Vande Velde C., Rouleau G. A., Drapeau P. (2010) Gain and loss of function of ALS-related mutations of TARDBP (TDP-43) cause motor deficits in vivo. Hum. Mol. Genet. 19, 671–683 [DOI] [PubMed] [Google Scholar]
- 65. Kraemer B. C., Schuck T., Wheeler J. M., Robinson L. C., Trojanowski J. Q., Lee V. M., Schellenberg G. D. (2010) Loss of murine TDP-43 disrupts motor function and plays an essential role in embryogenesis. Acta Neuropathol. 119, 409–419 [DOI] [PMC free article] [PubMed] [Google Scholar]
- 66. Li Y., Ray P., Rao E. J., Shi C., Guo W., Chen X., Woodruff E. A., 3rd, Fushimi K., Wu J. Y. (2010) A Drosophila model for TDP-43 proteinopathy. Proc. Natl. Acad. Sci. U.S.A. 107, 3169–3174 [DOI] [PMC free article] [PubMed] [Google Scholar]
- 67. Caccamo A., Majumder S., Oddo S. (2012) Cognitive decline typical of frontotemporal lobar degeneration in transgenic mice expressing the 25-kDa C-terminal fragment of TDP-43. Am. J. Pathol. 180, 293–302 [DOI] [PMC free article] [PubMed] [Google Scholar]
- 68. Stallings N. R., Puttaparthi K., Luther C. M., Burns D. K., Elliott J. L. (2010) Progressive motor weakness in transgenic mice expressing human TDP-43. Neurobiol. Dis. 40, 404–414 [DOI] [PubMed] [Google Scholar]
- 69. Swarup V., Phaneuf D., Dupré N., Petri S., Strong M., Kriz J., Julien J. P. (2011) Deregulation of TDP-43 in amyotrophic lateral sclerosis triggers nuclear factor κB-mediated pathogenic pathways. J. Exp. Med. 208, 2429–2447 [DOI] [PMC free article] [PubMed] [Google Scholar]
- 70. Tsai K. J., Yang C. H., Fang Y. H., Cho K. H., Chien W. L., Wang W. T., Wu T. W., Lin C. P., Fu W. M., Shen C. K. (2010) Elevated expression of TDP-43 in the forebrain of mice is sufficient to cause neurological and pathological phenotypes mimicking FTLD-U. J. Exp. Med. 207, 1661–1673 [DOI] [PMC free article] [PubMed] [Google Scholar]
- 71. Xu Y. F., Gendron T. F., Zhang Y. J., Lin W. L., D'Alton S., Sheng H., Casey M. C., Tong J., Knight J., Yu X., Rademakers R., Boylan K., Hutton M., McGowan E., Dickson D. W., Lewis J., Petrucelli L. (2010) Wild-type human TDP-43 expression causes TDP-43 phosphorylation, mitochondrial aggregation, motor deficits, and early mortality in transgenic mice. J. Neurosci. 30, 10851–10859 [DOI] [PMC free article] [PubMed] [Google Scholar]
- 72. Zhang Y. J., Gendron T. F., Xu Y. F., Ko L. W., Yen S. H., Petrucelli L. (2010) Phosphorylation regulates proteasomal-mediated degradation and solubility of TAR DNA binding protein-43 C-terminal fragments. Mol. Neurodegener. 5, 33. [DOI] [PMC free article] [PubMed] [Google Scholar]
- 73. Gendron T. F., Petrucelli L. (2011) Rodent models of TDP-43 proteinopathy: investigating the mechanisms of TDP-43-mediated neurodegeneration. J. Mol. Neurosci. 45, 486–499 [DOI] [PMC free article] [PubMed] [Google Scholar]
- 74. Avendaño-Vázquez S. E., Dhir A., Bembich S., Buratti E., Proudfoot N., Baralle F. E. (2012) Autoregulation of TDP-43 mRNA levels involves interplay between transcription, splicing, and alternative polyA site selection. Genes Dev. 26, 1679–1684 [DOI] [PMC free article] [PubMed] [Google Scholar]
- 75. Suzuki H., Matsuoka M. (2012) TDP-43 toxicity is mediated by the unfolded protein response-unrelated induction of C/EBP homologous protein expression. J. Neurosci. Res. 90, 641–647 [DOI] [PubMed] [Google Scholar]
- 76. Mishra M., Paunesku T., Woloschak G. E., Siddique T., Zhu L. J., Lin S., Greco K., Bigio E. H. (2007) Gene expression analysis of frontotemporal lobar degeneration of the motor neuron disease type with ubiquitinated inclusions. Acta Neuropathol 114, 81–94 [DOI] [PubMed] [Google Scholar]
- 77. Chen-Plotkin A. S., Geser F., Plotkin J. B., Clark C. M., Kwong L. K., Yuan W., Grossman M., Van Deerlin V. M., Trojanowski J. Q., Lee V. M. (2008) Variations in the progranulin gene affect global gene expression in frontotemporal lobar degeneration. Hum. Mol. Genet. 17, 1349–1362 [DOI] [PMC free article] [PubMed] [Google Scholar]
- 78. Kabashi E., Valdmanis P. N., Dion P., Spiegelman D., McConkey B. J., Vande Velde C., Bouchard J. P., Lacomblez L., Pochigaeva K., Salachas F., Pradat P. F., Camu W., Meininger V., Dupre N., Rouleau G. A. (2008) TARDBP mutations in individuals with sporadic and familial amyotrophic lateral sclerosis. Nat. Genet. 40, 572–574 [DOI] [PubMed] [Google Scholar]
- 79. Weihl C. C., Temiz P., Miller S. E., Watts G., Smith C., Forman M., Hanson P. I., Kimonis V., Pestronk A. (2008) TDP-43 accumulation in inclusion body myopathy muscle suggests a common pathogenic mechanism with frontotemporal dementia. J. Neurol. Neurosurg. Psychiatry 79, 1186–1189 [DOI] [PMC free article] [PubMed] [Google Scholar]
- 80. Gitcho M. A., Bigio E. H., Mishra M., Johnson N., Weintraub S., Mesulam M., Rademakers R., Chakraverty S., Cruchaga C., Morris J. C., Goate A. M., Cairns N. J. (2009) TARDBP 3′-UTR variant in autopsy-confirmed frontotemporal lobar degeneration with TDP-43 proteinopathy. Acta Neuropathol. 118, 633–645 [DOI] [PMC free article] [PubMed] [Google Scholar]
- 81. Shawlot W., Behringer R. R. (1995) Requirement for Lim1 in head-organizer function. Nature 374, 425–430 [DOI] [PubMed] [Google Scholar]
- 82. Takahashi M., Mori S., Shigeta S., Fujita T. (2007) Role of MBL-associated serine protease (MASP) on activation of the lectin complement pathway. Adv. Exp. Med. Biol. 598, 93–104 [DOI] [PubMed] [Google Scholar]
- 83. Subramanian A., Miller D. M. (2000) Structural analysis of α-enolase. Mapping the functional domains involved in down-regulation of the c-myc protooncogene. J. Biol. Chem. 275, 5958–5965 [DOI] [PubMed] [Google Scholar]
- 84. Zechner R., Zimmermann R., Eichmann T. O., Kohlwein S. D., Haemmerle G., Lass A., Madeo F. (2012) FAT SIGNALS-lipases and lipolysis in lipid metabolism and signaling. Cell Metab. 15, 279–291 [DOI] [PMC free article] [PubMed] [Google Scholar]
- 85. Teusink B., Voshol P. J., Dahlmans V. E., Rensen P. C., Pijl H., Romijn J. A., Havekes L. M. (2003) Contribution of fatty acids released from lipolysis of plasma triglycerides to total plasma fatty acid flux and tissue-specific fatty acid uptake. Diabetes 52, 614–620 [DOI] [PubMed] [Google Scholar]
- 86. Kersten S., Seydoux J., Peters J. M., Gonzalez F. J., Desvergne B., Wahli W. (1999) Peroxisome proliferator-activated receptor α mediates the adaptive response to fasting. J. Clin. Invest. 103, 1489–1498 [DOI] [PMC free article] [PubMed] [Google Scholar]
- 87. Dupuis L., Oudart H., René F., Gonzalez de Aguilar J. L., Loeffler J. P. (2004) Evidence for defective energy homeostasis in amyotrophic lateral sclerosis: benefit of a high-energy diet in a transgenic mouse model. Proc. Natl. Acad. Sci. U.S.A. 101, 11159–11164 [DOI] [PMC free article] [PubMed] [Google Scholar]
- 88. Dorst J., Kühnlein P., Hendrich C., Kassubek J., Sperfeld A. D., Ludolph A. C. (2011) Patients with elevated triglyceride and cholesterol serum levels have a prolonged survival in amyotrophic lateral sclerosis. J. Neurol. 258, 613–617 [DOI] [PubMed] [Google Scholar]
- 89. Chiang P. M., Ling J., Jeong Y. H., Price D. L., Aja S. M., Wong P. C. (2010) Deletion of TDP-43 down-regulates Tbc1d1, a gene linked to obesity, and alters body fat metabolism. Proc. Natl. Acad. Sci. U.S.A. 107, 16320–16324 [DOI] [PMC free article] [PubMed] [Google Scholar]
- 90. Chadt A., Leicht K., Deshmukh A., Jiang L. Q., Scherneck S., Bernhardt U., Dreja T., Vogel H., Schmolz K., Kluge R., Zierath J. R., Hultschig C., Hoeben R. C., Schürmann A., Joost H. G., Al-Hasani H. (2008) Tbc1d1 mutation in lean mouse strain confers leanness and protects from diet-induced obesity. Nat. Genet. 40, 1354–1359 [DOI] [PubMed] [Google Scholar]
- 91. Meyre D., Farge M., Lecoeur C., Proenca C., Durand E., Allegaert F., Tichet J., Marre M., Balkau B., Weill J., Delplanque J., Froguel P. (2008) R125W coding variant in TBC1D1 confers risk for familial obesity and contributes to linkage on chromosome 4p14 in the French population. Hum. Mol. Genet. 17, 1798–1802 [DOI] [PubMed] [Google Scholar]
- 92. Stone S., Abkevich V., Russell D. L., Riley R., Timms K., Tran T., Trem D., Frank D., Jammulapati S., Neff C. D., Iliev D., Gress R., He G., Frech G. C., Adams T. D., Skolnick M. H., Lanchbury J. S., Gutin A., Hunt S. C., Shattuck D. (2006) TBC1D1 is a candidate for a severe obesity gene and evidence for a gene/gene interaction in obesity predisposition. Hum. Mol. Genet. 15, 2709–2720 [DOI] [PubMed] [Google Scholar]
- 93. Miyaoka K., Kuwasako T., Hirano K., Nozaki S., Yamashita S., Matsuzawa Y. (2001) CD36 deficiency associated with insulin resistance. Lancet 357, 686–687 [DOI] [PubMed] [Google Scholar]
- 94. Hirano K., Kuwasako T., Nakagawa-Toyama Y., Janabi M., Yamashita S., Matsuzawa Y. (2003) Pathophysiology of human genetic CD36 deficiency. Trends Cardiovasc. Med. 13, 136–141 [DOI] [PubMed] [Google Scholar]
- 95. Klinkenberg M., Gispert S., Dominguez-Bautista J. A., Braun I., Auburger G., Jendrach M. (2012) Restriction of trophic factors and nutrients induces PARKIN expression. Neurogenetics 13, 9–21 [DOI] [PMC free article] [PubMed] [Google Scholar]
- 96. Cannon A., Yang B., Knight J., Farnham I. M., Zhang Y., Wuertzer C. A., D'Alton S., Lin W. L., Castanedes-Casey M., Rousseau L., Scott B., Jurasic M., Howard J., Yu X., Bailey R., Sarkisian M. R., Dickson D. W., Petrucelli L., Lewis J. (2012) Neuronal sensitivity to TDP-43 overexpression is dependent on timing of induction. Acta Neuropathol. 123, 807–823 [DOI] [PMC free article] [PubMed] [Google Scholar]
- 97. Gitcho M. A., Baloh R. H., Chakraverty S., Mayo K., Norton J. B., Levitch D., Hatanpaa K. J., White C. L., 3rd, Bigio E. H., Caselli R., Baker M., Al-Lozi M. T., Morris J. C., Pestronk A., Rademakers R., Goate A. M., Cairns N. J. (2008) TDP-43 A315T mutation in familial motor neuron disease. Ann. Neurol. 63, 535–538 [DOI] [PMC free article] [PubMed] [Google Scholar]