

Abstract
The continued elimination of measles requires accurate assessment of its epidemiology and a critical evaluation of how its incidence is changing with time. National surveillance of measles in the United States between 2001 and 2011 provides data on the number of measles introductions and the size of the resulting transmission chains. These data allow inference of the effective reproduction number, Reff, and the probability of an outbreak occurring. Our estimate of 0.52 (95% confidence interval: 0.44, 0.60) for Reff is smaller than prior results. Our findings are relatively insensitive to the possibility that as few as 75% of cases were detected. Although we confirm that measles remains eliminated, we identify an increasing trend in the number of measles cases with time. We show that this trend is likely attributable to an increase in the number of disease introductions rather than a change in the transmissibility of measles. However, we find that transmissibility may increase substantially if vaccine coverage drops by as little as 1%. Our general approach of characterizing the case burden of measles is applicable to the epidemiologic assessment of other weakly transmitting or vaccine-controlled pathogens that are either at risk of emerging or on the brink of elimination.
Keywords: disease elimination, effective reproduction number, heterogeneity of transmission, measles, preventable disease, transmissibility, United States, vaccine coverage
Measles is a highly contagious communicable disease, the complications of which include pneumonia, encephalitis, and death. Because vaccination provides long-term immunity, and circulation occurs only among humans, measles is a potential candidate for global eradication (1, 2). Although endogenous measles transmission was declared eliminated in the United States in 2000 (3, 4), sporadic introductions occasionally result in short chains of transmission (5, 6). The small size of these transmission chains is dependent on high vaccine coverage. Thus, there is concern that vaccination refusal may increase the possibility of endogenous transmission (7, 8).
To quantify the risk of the reemergence of measles, we analyzed recent data for the final size distribution of transmission chains of measles in the United States. This approach is justified because the chains are linked epidemiologically. Meanwhile, our use of the final size of transmission chains rather than the epidemic curve is helpful because our results are independent of the specific timing of individual cases. Because measles is reportable in the United States, continual active surveillance has enabled availability of chain size data with a high case detection rate (5, 9, 10). We quantified the amount of measles transmission by inferring the average size of transmission chains and the probability that a single imported case led to a transmission chain having at least 3 cases. Whereas quantitative estimates of measles transmission have been previously reported (5, 9, 11), our analysis was distinct in that it allowed a flexible degree of transmission heterogeneity and a more robust method of correcting for imperfect observation. We also investigated how sensitive these results were to changes in vaccine coverage. The National Health and Nutrition Examination Surveys seroprevalence data from 1999–2004 and recent reports of measles-mumps-rubella vaccine coverage for children 19–35 months of age provided an approximate range for the current level of population immunity (12, 13).
To obtain insight into whether the number of measles cases is relatively stable or potentially increasing, we examined whether there was a temporal trend in the data. When we focused on the time after declaration of measles elimination, we found evidence that the number of measles cases has increased significantly with time. This motivated a closer look to identify whether the increased health burden was due to more introductions of disease from foreign countries or to an increase in transmission within the United States.
Our analysis was based upon the assumption that the number of cases that were infected by a randomly chosen case followed a negative binomial distribution. This simple assumption permitted a full range of values for the effective reproduction number, the degree of transmission heterogeneity, and the observation probability (14). Branching process theory provided an explicit link between this model, observed data, and maximum likelihood statistics (15, 16). Our approach illustrates the importance of considering the degree of transmission heterogeneity and how imperfect observation can be accounted for in a self-consistent manner. Furthermore, by separating the analysis of disease introduction and subsequent transmissibility, it also provides a framework for evaluating the burden of diseases that are either weakly transmitting or are limited because of active control intervention.
METHODS
Data
The data for this study were obtained from the Centers for Disease Control and Prevention (CDC) (Atlanta, Georgia), which conducts national surveillance of measles and tracks all confirmed cases. The adequacy of this surveillance system to detect measles cases has been validated using 4 different measurements (17). The number and size distribution of transmission chains for measles are available in 2 reports; 1 for 1997–1999 (Table 1 in the article by Gay et al. (5)) and another for 2001–2011 (Tables 2 and 3 in the article by Papania et al. (11), which is an update of Tables 4 and 5 in the report by the CDC (9)). The reports do not provide any explicit reason to presume that the case detection probability differed between 1997–1999 and 2001–2011. Because our model concerns the distribution of chain sizes rather than an epidemic curve, we did not require access to the specific timing of measles cases.
Model
Because the transmission of measles in the United States is currently self-limiting, cases are typically observed as distinct transmission chains. A transmission chain consists of an imported case of measles (i.e., a primary case), along with all secondary cases that can be linked to it. In principle, overlapping chains could form an infection cluster with multiple primary cases. However, the presence of multiple primary cases was reported only for a single infection cluster in 1999. We defined an outbreak as a chain with at least 3 cases (analogous to the CDC's definition (9)).
We leveraged a body of research concerning the use of observed chain sizes to estimate transmission parameters for self-limited chains (7, 11, 15, 16, 18, 19). In particular, the transmissibility of measles within the United States was modeled by assuming that the offspring distribution for the number of infections caused by a randomly chosen case followed a negative binomial distribution (16). The negative binomial distribution has been shown to be a parsimonious model for disease transmission, because it encompasses both the strength and heterogeneity of transmission (14). It is parameterized by the effective reproduction number, Reff, and the dispersion parameter, k. The mean of the distribution is Reff, and the requirement for disease elimination is that Reff is less than 1. The variance of the distribution is a function of both Reff and k. As such, k represents the degree of transmission heterogeneity with lower values of k corresponding to greater heterogeneity. When k → ∞, the offspring distribution is equivalent to a Poisson distribution (i.e., each case is assumed to have an identical and constant rate of infection, as well as an identical infectious period). When k = 1, the offspring distribution is equivalent to a geometric distribution (i.e., equivalent to each case having an identical and constant rate of infection, but an exponentially distributed infectious period). When k is less than 1, a high degree of transmission heterogeneity is observed. This latter scenario may be evident when a social structure, such as the clustering of unvaccinated individuals, affects transmission. Traditional analyses often assume that k → ∞ or k = 1, but available data indicate that higher degrees of heterogeneity (i.e., lower values of k) are common for many infections (14, 15). By allowing k to be a free parameter that is inferred from the observed chain size distribution, we permit a flexible degree of transmission heterogeneity.
For a specific value of Reff, the average chain size was computed according to 1 / (1 – Reff), and the proportion of cases that were expected is, therefore, 1 − Reff (Figures 1A and 2) (11, 16). Thus, the number of cases in a year is modeled as NI / (1 − Reff), where NI is the number of disease introductions in a year. Meanwhile, branching process theory allows explicit calculation of the chain size distribution as a function of Reff and k (16). The outbreak probability, which depends on both Reff and k, was computed by calculating the probability that a chain has exactly 1 or 2 cases and then subtracting this value from 1.
Figure 1.

Inference results for the transmission of measles in the United States during 2001–2011. A) The 95% confidence region for average chain size and the probability of an outbreak (defined as a chain having at least 3 cases) are shown for the negative binomial model under the assumption of perfect observation (black contour). These results were then modified for the scenario in which each case was observed with an independent probability of 75% (light gray contour). For each scenario, the maximum likelihood estimate is indicated by the bullet point. The dotted curve shows the relationship between average chain size and the probability of an outbreak when homogeneous transmission is assumed (i.e., the number of infections that are attributed to a randomly chosen case is Poisson distributed). The dashed curve, corresponding to k = 1, represents transmission with an intermediate degree of heterogeneity (i.e., the number of infections that are attributed to a randomly chosen case follow a geometric distribution). The dark gray line superimposed on the homogeneous transmission curve represents the truncated Poisson confidence interval of previously published analyses (9). The confidence interval for the truncated Poisson model is represented by a line because this model has only 1 parameter. The confidence regions for the models that are based on a negative binomial offspring distribution are shown as 2-dimensional contours because these models have 2 parameters. B) Chain size predictions based on 75% case observation rate (light gray) or the truncated Poisson model (dark gray) (9). The observed data and the 95% error bars for these observations (determined by bootstrapping) are shown in black.
Figure 2.
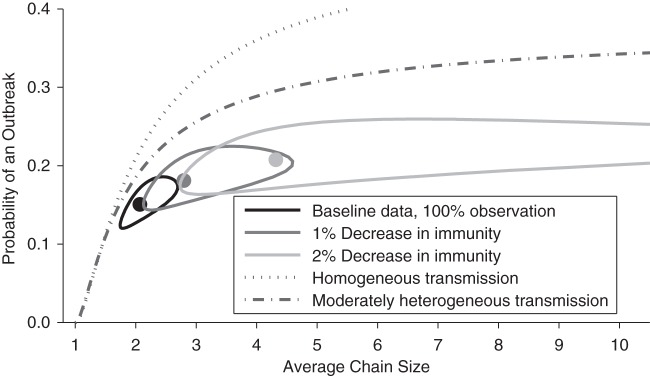
Projections for how a decrease in immunity would change the transmission of measles (dark and light gray contours). The other lines and contours are identical to those in Figure 1.
When observation was assumed to be imperfect (Figure 1), we constructed the observed chain size distribution by assuming that each case had an identical and independent probability of detection (15, 16). Imperfect case observation has previously been accounted for using a “truncated Poisson” model that assumed homogeneous transmission and ignored chains having only 1 or 2 cases (9). However, previous analysis showed that the truncated Poisson model can lead to overestimation of Reff, because heterogeneity of transmission is not incorporated (15).
To model the projected change due to decreased vaccine coverage (Figure 2), 1 − Reff was assumed to be proportional to the seroprevalence. It was also assumed that no transmission would be possible if the seroprevalence were 100%, and that changes in seroprevalence would not change the dispersion parameter. These assumptions are analogous to previous modeling efforts (7) but do not explicitly model clustering of susceptible individuals.
Statistics
Maximum likelihood estimates of Reff and k were obtained by computing the probability of the observed chain size distribution (16). Specifically, the probability, rj, for a transmission chain to have a true size of j is
 |
(1) |
When perfect observations are assumed, the probability  to observe a transmission chain of size j is the same as rj. When imperfect observation is accounted for by assuming that each case is observed with an identical and independent probability pind, the probability of observing j cases in an arbitrary observed chain is (15)
 |
(2) |
The possibility for observing no cases in a chain is determined by setting j = 0. Therefore, the overall probability of observing a chain of size j (which requires that there be at least 1 case to observe) is
 |
(3) |
To adjust for the aggregated form in which the data were reported for 2001–2011, the likelihood calculation for a set of data is determined by summing chain size probabilities together when the exact size of a chain was known only to be within a specific range. Specifically,
 |
(4) |
where m1 is the observed number of isolated cases, m2 is the observed number of chains having exactly 2 cases, m3→5 is the observed number of chains containing 3–5 cases, m6→9 is the observed number of chains containing 6–9 cases, m10+ is the observed number of chains having at least 10 cases, and  represent the actual sizes of the m10+ observed chains that have at least 10 cases. Exact sizes of large chains (i.e., at least 10 cases) in Table 2 of the article by Papania et al. (10) were used, but this required adjusting the “greater than five cases column” of Table 3 of the article by Papania et al. (10) to include only the chains having between 6 and 9 cases. For the single infection cluster in 1999 that had 2 index cases (and thus had 2 entangled chains of transmission), the likelihood was computed by summing over all possible combinations of chain sizes. The 95% confidence regions for Reff and k were found by the likelihood ratio test, and the associated 95% confidence interval for Reff was calculated by using likelihood profiling (16, 20).
The error bars of the observed chain size distribution for the 2002–2011 data in the inset of Figure 1B correspond to bootstrapping the observed chain size distribution with replacement. The confidence intervals for the data on number of cases and number of disease introductions (Figures 3A and 3C) were determined by the likelihood ratio test for a Poisson distribution. The maximum likelihood values for the Reff of each year (Figure 3D) were determined by maximizing the likelihood for the observed chain size distribution for each year with respect to Reff and k and then profiling on Reff to determine the confidence intervals.
Figure 3.

Trends in the incidence, introduction, and transmission of measles cases in the United States, 1997–2011. A) Data on the number of measles cases are shown along with 95% error bars obtained with the assumption of a Poisson distribution for the number of cases in any 1 year. When the number of cases is modeled as varying linearly by year (i.e., Poisson regression), the dashed and solid gray lines show the best fit of the data for the years 1997–2011 and 2002–2011, respectively. The vertical dotted line indicates when measles was declared to be eliminated in the United States. B) The number of cases of measles depends on both the number of introductions of measles into the United States and on the transmissibility of measles (as represented by the effective reproduction number, Reff). C) Postelimination data (from 2002–2011) on the number of introductions of measles cases are shown along with 95% error bars. A Poisson process for disease introduction is assumed. The gray line shows results for a linear regression of the data. D) The inferred values for the Reff for each postelimination year (from 2002–2011) are plotted along with 95% confidence intervals and the best linear fit. The inference of Reff is based on the assumption that the number of infections caused by each case follows a negative binomial distribution.
The linear fits in Figures 3A and 3C were obtained by assuming that the number of cases and number of introductions for any single calendar year followed a Poisson distribution with a mean that was linearly dependent on the calendar year. The confidence intervals on the slopes of these regressions were determined by the log likelihood ratio test. An alternative parametric bootstrapping approach for obtaining confidence intervals was also conducted. For this approach, bootstrapped data were generated by choosing values for the number of cases and introductions each year according to a Poisson distribution with a mean equal to the observed data value. Poisson regression was then performed on the bootstrapped data. This was repeated 5,000 times, and the 95% confidence limits were obtained from the histograms of the value of the slopes obtained for the set of linear regressions. As a nonparametric alternative for detecting temporal trends, the Mann-Kendall function was applied to the time-series data (21).
For the regression of Reff (Figure 3D), k was assumed to be constant from year to year. However, Poisson regression could not be applied in a way that was consistent with our model because it would not incorporate uncertainty with respect to the degree of transmission heterogeneity. Thus, the linear fit was obtained by first maximizing the likelihood,
 |
(5) |
with respect to c1, c2, and k and then plotting c1 + c2y. Here, Ly (Reff, k) is the likelihood of the data for year y for transmission parameters of Reff and k. The confidence intervals on the slopes of this regression were determined by the log likelihood ratio test. Again, as a nonparametric alternative for detecting temporal trends, the Mann-Kendall function was applied to the time-series data.
RESULTS
When perfect case observation was assumed, we found that the maximum likelihood estimate of Reff for measles in the United States (in 2002–2011) was 0.52 (95% confidence interval (CI): 0.44, 0.60). This estimate of Reff implies that chains had an average size of 2.1 cases (95% CI: 1.8, 2.5; black contour in Figure 1A), and that 48% of cases (95% CI: 40%, 56%) were caused by introductions from another country.
In addition to estimating the average chain size, our inference method was used to quantify the probability of a primary case causing an outbreak. The higher the degree of transmission heterogeneity, the higher the probability that a primary case will be a dead end for infection and, thus, the outbreak probability will be lower. We inferred the outbreak probability to be 0.15 (95% CI: 0.13, 0.18). This low outbreak probability (in comparison to the probability expected from more homogeneous transmission indicated by the dashed and dotted black lines in Figure 1A) is balanced by a higher probability of very large chains containing “super-spreader” cases that cause a disproportionate amount of transmission (14). The amount of super-spreading can be quantified by the coefficient of variation for the offspring distribution (2.38, 95% CI: 2.08, 2.74 compared to 1.39 for Reff = 0.52 with homogeneous transmission) or by the dispersion parameter (0.27, 95% CI: 0.18, 0.41).
Imperfect observation of cases is an unfortunate reality of all surveillance efforts. Despite comprehensive surveillance, the CDC noted that 12% of measles cases in 2002–2011 had unknown infection sources (9). However, incorporation of the observation process into inference methods can partially compensate for unobserved cases. A prior analysis used the truncated Poisson method to correct for imperfect observation, but this method involved an assumption of homogeneous transmission. The resulting estimate for Reff was 0.70 (95% CI: 0.61, 0.79; black line in Figure 1A) (9), which corresponds to an average chain size of 3.3 (95% CI: 2.6, 4.8). We assumed that each case had an independent observation rate of 75% as an alternative correction for imperfect observation. The resulting estimate of the average chain size was 2.2 (95% CI: 1.9, 2.7; light gray contour in Figure 1A). The difference between these models is significant because of the substantial difference in the expected sizes of observed chains and the probabilities of outbreaks (seen by the nonoverlap of the black line and light gray contour in Figure 1A). Direct comparison of how well the 2 models fit the observed chain size distribution yielded a difference in the Akaike information criterion scores of −120.1 (inset of Figure 1B). This indicated a strong preference for our model of imperfect case observation over the truncated Poisson model. The discrepancy between these 2 models can be explained by a recent comparison of the underlying methods, which showed that the assumption of Poisson-distributed transmission often causes a greater bias in Reff than the bias introduced by imperfect observation (15).
Because the average size of chains is related to the proportion of the population that is susceptible to measles, we used seroprevalence data to predict the consequence of reduced vaccine coverage. The National Health and Nutrition Examination Surveys reported an overall seropositive proportion of the population of 95.9% (95% CI: 95.1%, 96.5%), which we treat as the overall level of population immunity (12). Our model predicted that if the seroprevalence decreased by an absolute value of 1% from the baseline value, the average chain size would increase to 2.8 (95% CI: 2.2, 4.0; dark gray contour of Figure 2). If seroprevalence decreased another 1% to an absolute value of 93.9%, our model predicted an increase of the average chain size to 4.3 (95% CI: 2.9, 9.9; light gray contour of Figure 2). Our analysis confirmed a prior observation that relatively small changes in vaccine coverage can have a substantial impact on the number of measles cases (7).
Our projections for the impact of a decrease in population immunity are dramatic. Although there are many caveats to the analysis, the possibility that the average size of chains can more than double with a 2% drop in population immunity motivates a closer examination of the data to ensure that transmission is being maintained at low levels. An examination of the number of cases that occurs each year shows a potentially concerning trend (Figure 3A). When Poisson regression is applied to available data from 1997 to 2011, there is a minimal change in the case load (slope of dashed gray line in Figure 3A is 0.7 cases per year, 95% CI: 0.0, 1.6 by likelihood ratio, and 95% CI: −0.3, 1.7 based on parametric bootstrapping). However, similar examination of data since the elimination of measles (in 2002–2011) shows a significant increase in the number of cases with time (slope of solid gray line in Figure 3A is 10.2 cases per year, 95% CI: 9.0, 11.8 by likelihood ratio, and 95% CI: 8.5, 11.9 based on parametric bootstrapping). These findings are further validated by the Mann-Kendall statistic for detecting a temporal trend in data (P = 0.91 for 1997–2011, P = 0.07 for 2002–2011). This raises a concern about whether the declaration of measles elimination caused an inadvertent change in control interventions and establishes a need to understand the likely cause of the increased number of cases.
Although it appears that the number of cases of measles may be increasing, one cannot also conclude that the transmissibility (as represented by Reff) is increasing. Rather, an increase in the number of cases could be entirely caused by an increase in the number of introductions, or could be entirely due to an increase in Reff or a combination of these possibilities (Figure 3B).
When just the number of introductions per year was examined, the postelimination data (from 2002–2011) showed an increasing trend (slope of gray line in Figure 3C is 4.6 introductions per year, 95% CI: 3.8, 5.8 by likelihood ratio, and 95% CI: 3.5, 5.8 based on parametric bootstrapping, Mann-Kendall P = 0.02). Even when the noticeably high value of disease introductions for 2011 is ignored, an increase of 1.9 introductions per year (95% CI: 0.9, 3.2 by likelihood ratio, and 95% CI: 0.5, 3.2 based on parametric bootstrapping) is still observed. Meanwhile, a statistically significant trend in Reff was not identified (slope of gray line in Figure 3D is 0.00 cases per year, 95% CI: −0.03, 0.03 by likelihood ratio, Mann-Kendall P = 1.00). This implies that the increase in the number of cases can be attributed to an increase in the number of introductions rather than a change in Reff.
Although the data suggest that Reff is approximately equally likely to be decreasing as increasing, the possibility that Reff is increasing cannot be ruled out. In particular, the 95% confidence interval for the slope of Reff included the possibility that Reff has increased by 0.3 over a 10-year period. If this worst-case scenario were true and continued for 5 years, the average size of outbreaks would be expected to grow 60% by 2017. This reinforces the need to maintain surveillance efforts so that monitoring of Reff can continue and, if needed, reactive measures such as improved vaccine coverage can be implemented.
DISCUSSION
Because the upper confidence interval limit for the average chain size is 2.7 (corresponding to Reff of 0.63), even when an observation probability of 75% is assumed (Figure 1A), our estimates of Reff were well below the critical value of 1. Thus, our overall analysis of postelimination measles data confirmed prior findings that endemic transmission was not possible during 2002–2011 (3, 4). However, the apparent trend showing an increase in the number of cases from year to year deserves continued monitoring (Figure 3A).
A concern is that the size of transmission chains and the risk of reestablishing endemic measles are highly sensitive to the fraction of the population that is susceptible. In fact, a change of only 2% in the fraction of the population that is susceptible can have a dramatic impact on disease burden (Figure 2). This finding deserves particular attention in light of the CDC's report that measles-mumps-rubella vaccine coverage among children 19–35 months of age varied between 90.0% and 92.3% in the years 2006–2010 (13). If this relatively low coverage is maintained so that seroprevalence drops to this level, then the risk of larger, sustained outbreaks becomes increasingly worrisome (7). Reassuringly, Kindergarten coverage data show a higher level of 2-dose measles-mumps-rubella vaccine coverage for 2009–2010 (22). However, our observation that the confidence intervals for Reff include the possibility of an increasing Reff shows that a trend toward larger, sustained outbreaks cannot be ruled out.
Because of the strong relationship between the size of transmission chains, vaccine coverage, community structure, and the risk of endemic transmission, a more thorough characterization of how measles transmission varies from individual to individual would be beneficial. The cause of a high degree of observed heterogeneity in transmission may be due to chain-to-chain variation in transmission, intrinsic individual-to-individual variation in transmission, or a combination of these effects. Heterogeneity may result from biological factors (e.g., a particular strain of virus) or demographic factors (e.g., clustering of individuals in whom vaccination coverage is low). A better understanding of clustering of susceptible individuals and other sources of transmission heterogeneity would improve subsequent modeling efforts.
Our results also relate national health to global health. Because approximately half of measles cases in the CDC data were primary cases, an important contribution to the overall disease burden of measles was geographical importation. Thus, support of other countries’ efforts to control and eliminate measles within their own borders would likely result in a tangible reduction of measles within the United States (10, 23). To consider whether it is possible to facilitate early detection of the importation of measles, it would be useful to understand whether the marked increase in introductions of measles in 2011 (Figure 3C) is simply a stochastic effect, it reflects changing travel patterns, or correlates with a special circumstance.
In summary, our analysis of readily available chain size data provides a quantitative perspective on the potential for measles to reemerge and confirms the importance of continued surveillance. More generally, the breakdown of case load into cases due to disease introduction and cases resulting from secondary transmission provides a useful framework for the monitoring of other subcritical diseases having a Reff between 0 and 1 (Figure 3B). These diseases include zoonoses, such as avian influenza, that are at risk of emerging (18, 24) and diseases such as polio that are on the brink of elimination (25, 26).
ACKNOWLEDGMENTS
Author affiliations: Francis I. Proctor Foundation, University of California, San Francisco, California (Seth Blumberg, Wayne T. A. Enanoria, Thomas M. Lietman, Travis C. Porco); Division of International Epidemiology and Population Studies, Fogarty International Center, National Institutes of Health, Bethesda, Maryland (Seth Blumberg, James O. Lloyd-Smith); Center for Infectious Diseases and Emergency Readiness, School of Public Health, University of California, Berkeley, California (Wayne T. A. Enanoria); Ecology and Evolutionary Biology Department, University of California, Los Angeles, California, (James O. Lloyd-Smith); Department of Ophthalmology, University of California, San Francisco, California (Thomas M. Lietman); and Department of Epidemiology and Biostatistics, University of California, San Francisco, California (Thomas M. Lietman, Travis C. Porco).
This work was supported by the National Institute of Health Modeling Infectious Disease Agent Study program (grant NIH NIGMS 1-U01-GM087728 to T.C.P., T.M.L., W.T.A.E., and S.B.); the Research and Policy for Infectious Disease Dynamics program of the Science and Technology Directorate, Department of Homeland Security (funding to S.B. and J.O.L.-S.); the National Institutes of Health, Fogarty International Center (funding to S.B. and J.O.L.-S.); the National Science Foundation (grant EF-0928690 to J.O.L.-S.); and the De Logi Chair in Biological Sciences (funding to J.O.L.-S.).
Portions of this research have been presented at the American Public Health Association annual meeting on November 2–6, 2013, in Boston, Massachusetts, and at Epidemics4 (the Fourth International Conference on Infectious Disease Dynamics) on November 19–22, 2013, in Amsterdam, the Netherlands.
Conflict of interest: none declared.
REFERENCES
- 1.World Health Organization. Global eradication of measles: report by the Secretariat. 2010. http://www.who.int/iris/handle/10665/2387. Published March 25, 2010. Accessed November 9, 2013.
- 2.Grabowsky M. The beginning of the end of measles and rubella. JAMA Pediatr. 2014;168(2):108–109. doi: 10.1001/jamapediatrics.2013.4603. [DOI] [PubMed] [Google Scholar]
- 3.Katz SL, Hinman AR. Summary and conclusions: measles elimination meeting, 16–17 March 2000. J Infect Dis. 2004;189(suppl 1):S43–S47. doi: 10.1086/377696. [DOI] [PubMed] [Google Scholar]
- 4.Papania MJ, Orenstein WA. Defining and assessing measles elimination goals. J Infect Dis. 2004;189(suppl 1):S23–S26. doi: 10.1086/381556. [DOI] [PubMed] [Google Scholar]
- 5.Gay NJ, De Serres G, Farrington CP, et al. Assessment of the status of measles elimination from reported outbreaks: United States, 1997–1999. J Infect Dis. 2004;189(suppl 1):S36–S42. doi: 10.1086/377695. [DOI] [PubMed] [Google Scholar]
- 6.Parker Fiebelkorn A, Redd SB, Gallagher K, et al. Measles in the United States during the postelimination era. J Infect Dis. 2010;202(10):1520–1528. doi: 10.1086/656914. [DOI] [PubMed] [Google Scholar]
- 7.Jansen VAA, Stollenwerk N, Jensen HJ, et al. Measles outbreaks in a population with declining vaccine uptake. Science. 2003;301(5634):804. doi: 10.1126/science.1086726. [DOI] [PubMed] [Google Scholar]
- 8.Omer SB, Salmon DA, Orenstein WA, et al. Vaccine refusal, mandatory immunization, and the risks of vaccine-preventable diseases. N Engl J Med. 2009;360(19):1981–1988. doi: 10.1056/NEJMsa0806477. [DOI] [PubMed] [Google Scholar]
- 9.Centers for Disease Control and Prevention. Documentation and verification of measles, rubella and congenital rubella syndrome elimination in the region of the Americas. United States National Report, March 28, 2012. Posted October, 2012 http://www.cdc.gov/measles/stats-surv.html. Accessed September 23, 2013.
- 10.Papania MJ, Wallace GS, Rota PA, et al. Elimination of endemic measles, rubella, and congenital rubella syndrome from the western hemisphere: the US experience. JAMA Pediatr. 2014;168(2):148–155. doi: 10.1001/jamapediatrics.2013.4342. [DOI] [PubMed] [Google Scholar]
- 11.De Serres G, Gay NJ, Farrington CP. Epidemiology of transmissible diseases after elimination. Am J Epidemiol. 2000;151(11):1039–1048. doi: 10.1093/oxfordjournals.aje.a010145. [DOI] [PubMed] [Google Scholar]
- 12.McQuillan GM, Kruszon-Moran D, Hyde TB, et al. Seroprevalence of measles antibody in the US population, 1999–2004. J Infect Dis. 2007;196(10):1459–1464. doi: 10.1086/522866. [DOI] [PubMed] [Google Scholar]
- 13.Black CL, Wooten KG, Yankey D, et al. National and state vaccination coverage among children aged 19–35 months—United States, 2010. Morb Mortal Wkly Rep. 2011;60(34):1157–1163. [PubMed] [Google Scholar]
- 14.Lloyd-Smith JO, Schreiber SJ, Kopp PE, et al. Superspreading and the effect of individual variation on disease emergence. Nature. 2005;438(7066):355–359. doi: 10.1038/nature04153. [DOI] [PMC free article] [PubMed] [Google Scholar]
- 15.Blumberg S, Lloyd-Smith JO. Comparing methods for estimating R0 from the size distribution of subcritical transmission chains. Epidemics. 2013;5(3):131–145. doi: 10.1016/j.epidem.2013.05.002. [DOI] [PMC free article] [PubMed] [Google Scholar]
- 16.Blumberg S, Lloyd-Smith JO. Inference of R0 and transmission heterogeneity from the size distribution of stuttering chains. PLoS Comput Biol. 2013;9(5):e1002993. doi: 10.1371/journal.pcbi.1002993. [DOI] [PMC free article] [PubMed] [Google Scholar]
- 17.Harpaz R, Papania MJ, McCauley MM, et al. Has surveillance been adequate to detect endemic measles in the United States? J Infect Dis. 2004;189(suppl 1):S191–S195. doi: 10.1086/381126. [DOI] [PubMed] [Google Scholar]
- 18.Ferguson NM, Fraser C, Donnelly CA, et al. Public health risk from the avian H5N1 influenza epidemic. Science. 2004;304(5673):968–969. doi: 10.1126/science.1096898. [DOI] [PubMed] [Google Scholar]
- 19.Nishiura H, Yan P, Sleeman CK, et al. Estimating the transmission potential of supercritical processes based on the final size distribution of minor outbreaks. J Theor Biol. 2012;294:48–55. doi: 10.1016/j.jtbi.2011.10.039. [DOI] [PMC free article] [PubMed] [Google Scholar]
- 20.Bolker BM. Ecological Models and Data in R. Princeton, NJ: Princeton University Press; 2008. 408 pp. [Google Scholar]
- 21.Mann HB. Nonparametric tests against trend. Econometrica. 1945;13(3):245–259. [Google Scholar]
- 22.Stokley S, Stanwyck C, Avey B, et al. Vaccination coverage among children in Kindergarten—United States, 2009–10 school year. Morb Mortal Wkly Rep. 2011;60(21):700–704. [PubMed] [Google Scholar]
- 23.Schwartzman K, Oxlade O, Barr RG, et al. Domestic returns from investment in the control of tuberculosis in other countries. N Engl J Med. 2005;353(10):1008–1020. doi: 10.1056/NEJMsa043194. [DOI] [PubMed] [Google Scholar]
- 24.van Boven M, Koopmans M, Du Ry van Beest Holle M, et al. Detecting emerging transmissibility of avian influenza virus in human households. PLoS Comput Biol. 2007;3(7):e145. doi: 10.1371/journal.pcbi.0030145. [DOI] [PMC free article] [PubMed] [Google Scholar]
- 25.Minor PD. Polio vaccines and the eradication of poliomyelitis. Lancet. 2012;380(9840):454–455. doi: 10.1016/S0140-6736(12)60921-0. [DOI] [PubMed] [Google Scholar]
- 26.O'Reilly KM, Durry E, ul Islam O, et al. The effect of mass immunisation campaigns and new oral poliovirus vaccines on the incidence of poliomyelitis in Pakistan and Afghanistan, 2001–11: a retrospective analysis. Lancet. 2012;380(9840):491–498. doi: 10.1016/S0140-6736(12)60648-5. [DOI] [PMC free article] [PubMed] [Google Scholar]