

Background: DNA-binding protein from starved cells (Dps) are nano-compartments that can oxidize and store iron rendering protection from free radicals.
Results: A histidine-aspartate ionic cluster in mycobaterial Dps2 modulates the rate of iron entry and exit in these proteins.
Conclusion: Substitutions that disrupt the cluster interface alter the iron uptake/release properties with localized structural changes.
Significance: Identifying important gating residues can help in designing nano-delivery vehicles.
Keywords: DNA-binding Protein, Ion Channels, Iron, Mycobacterium, X-ray Crystallography, Mycobacterium smegmatis, Ionic Cluster, Iron Oxidation
Abstract
Dps (DNA-binding protein from starved cells) are dodecameric assemblies belonging to the ferritin family that can bind DNA, carry out ferroxidation, and store iron in their shells. The ferritin-like trimeric pore harbors the channel for the entry and exit of iron. By representing the structure of Dps as a network we have identified a charge-driven interface formed by a histidine aspartate cluster at the pore interface unique to Mycobacterium smegmatis Dps protein, MsDps2. Site-directed mutagenesis was employed to generate mutants to disrupt the charged interactions. Kinetics of iron uptake/release of the wild type and mutants were compared. Crystal structures were solved at a resolution of 1.8–2.2 Å for the various mutants to compare structural alterations vis à vis the wild type protein. The substitutions at the pore interface resulted in alterations in the side chain conformations leading to an overall weakening of the interface network, especially in cases of substitutions that alter the charge at the pore interface. Contrary to earlier findings where conserved aspartate residues were found crucial for iron release, we propose here that in the case of MsDps2, it is the interplay of negative-positive potentials at the pore that enables proper functioning of the protein. In similar studies in ferritins, negative and positive patches near the iron exit pore were found to be important in iron uptake/release kinetics. The unique ionic cluster in MsDps2 makes it a suitable candidate to act as nano-delivery vehicle, as these gated pores can be manipulated to exhibit conformations allowing for slow or fast rates of iron release.
Introduction
Iron, a metal in the first transition series, is one of the most abundant elements on Earth, and composes 5% of Earth's crust. It acts as a cofactor and is found in active sites of many enzymes. Capable of serving both as an electron source and an electron sink, iron has a central role in many cellular processes including metabolism, nucleotide synthesis, respiration, and gene regulation. In living organisms, free iron exists in two oxidation states, ferrous (Fe2+) and ferric (Fe3+). The ferrous state being more soluble is readily assimilated in biological systems, but the highly insoluble ferric form is not as easily available for physiological functions. The tendency of Fe2+ to readily oxidize to Fe3+ further limits the availability of iron for aerobic life. H2O2, a product of oxidative respiration reacts with Fe2+ to generate toxic hydroxyl free radicals by a process known as the Fenton reaction (1).
In pathogenic bacteria iron starvation is one of the first physiological obstacles that bacteria must overcome before successfully colonizing a host (2). Therefore, iron starvation and oxidative stress are two barriers that bacteria must circumvent to establish growth. To simultaneously store iron and protect the cells from the deleterious effects of iron, prokaryotes have evolved proteins belonging to the ferritin family.
Ferritins are roughly spherical nanocages that oxidize and accumulate iron as ferric oxide in the central cavity. The ferritin-like proteins are widely categorized as 24-mer maxiferritins and 12-subunit miniferritins. Miniferritins have been recognized only in eubacteria and archaeabacteria, unlike maxiferritins that are present in bacteria, archaea, and eukaryotes. Also, in contrast to ferritins that can store >4000 iron atoms per protein shell, miniferritins can store only around 500 iron atoms per dodecamer because of their smaller size (3, 4).
Miniferritins are dodecameric spherical proteins that can oxidize and store iron in the form of ferrous oxide in the protein cavity, like their larger counterparts the ferritins. But unlike ferritins where dioxygen is the major electron acceptor, miniferritins use hydrogen peroxide as the preferred reagent for iron oxidation (5). DNA-binding protein under starvation (Dps) is a name for miniferritins and was first discovered in starved Escherichia coli cells (6) and subsequently, homologs have been found in many Gram-positive as well as Gram-negative bacteria (7–10).
Many Dps proteins bind DNA in a sequence independent manner. A number of diverse roles have been assigned to this class of proteins in various organisms. In E. coli, Dps protects the cell from UV and γ radiations, metal toxicity, oxidative stress, etc. during stationary phase. In addition, cells lacking the protein show a pleiotropic pattern of protein synthesis during starvation (11, 12). In Haemophilus ducreyi it is a constituent of fine-tangled pili (13), and elicits immune response being a part of the antigen in Helicobacter pylori, Treponema pallidum, and Borrelia burgdorferi (14–16). In certain thermophiles like Streptococcus thermophilus, it is a cold shock protein (17). The presence of more than one Dps homolog is also observed in some bacteria. Bacillus anthracis has BaDps1, which is involved in iron sequestration, and BaDps2 conferring protection against H2O2 damage (18, 19). In Deinococcus radiodurans, Dps1 binds DNA but is unable to protect the organism from H2O2-mediated degradation, whereas Dps2 binds DNA and also protects the bacterium against reactive oxygen species-mediated damage (20, 21).
In Mycobacterium smegmatis, the first Dps (MsDps1) was isolated from cells in stationary phase (22). A search of TIGR database with the MsDps1 sequence led to the identification of the second Dps namely MsDps2 (23). MsDps1 has a long C-terminal tail rich in positively charged residues for DNA binding unlike MsDps2, which lacks any N- or C-terminal extensions, despite which it can still bind to DNA. In M. smegmatis, these proteins were also found to be differentially regulated at the transcriptional and translational levels. Transcription analysis showed MsDps1 to be recognized by stationary phase sigma factors σF and σH, and MsDps2 expression was driven by housekeeping sigma σA and alternative sigma σB (24). Atomic force microscopic studies of the protein bound to DNA revealed MsDps1 to form stable toroids with DNA. On the other hand, MsDps2 binds to DNA in a loosely formed toroid (25).
MsDps1 has a stable trimeric form that can oligomerize into a dodecamer, whereas MsDps2 has only a dodecameric form. With 12 identical α helical subunits, both homologs exhibit a tetrahedral (23) symmetry. The protein is roughly spherical with a hollow core and pores at the 3-fold axes. The dodecamer exhibits two types of 3-fold interfaces namely, the ferritin-like interface and the dps-like interface (23). The ferritin-like symmetrical interface is thought to channel iron into the protein cavity. The pore enclosed by this trimeric interface is funnel-shaped having a wide mouth facing the solvent side, and constricts toward the interior (Fig. 1). This pore is lined by hydrophilic residues, mainly negatively charged species like aspartate, which are thought to trap and encourage the internalization of iron.
FIGURE 1.

Ferritin-like pore harbors a funnel shaped channel leading into the protein cavity. A, the MsDps2 protein has a dodecameric form of which three subunits form the ferritin-like interface lined by many conserved negatively charged amino acids, thought to be crucial for iron uptake/release. The pathway for iron entry is represented by the arrows. The iron is further oxidized and stored as a ferric hydroxide mineral. B, the residues mutated in the current study are highlighted: magenta represents the amino acids at the widest region of the pore facing the solvent side; yellow shows the residues lining the narrowest point of the pore and opening into the protein cavity.
In ferritins, a number of studies point to the importance of this ferritin-like pore in the gating of iron (26, 27). Dps proteins, also known as miniferritins, are less well studied in this respect. Mutagenic analysis in Streptococcus suis and Listeria innocua Dps proteins indicate the importance of conserved aspartate residues in this channel (28, 29). Electrostatic potential at the pores and their effect on the ferroxidation properties of Dps family proteins was studied by Ceci et al. (30). But the absence of structural information to explain the functional changes in the mutants hampers a clearer understanding of the gating mechanism. In human H-chain ferritin, it was shown that the negative outer entrance of the 3-fold pore is surrounded by patches of positive potential, and these conflicting forces operating on the incoming cations guide them with great precision to the ferroxidation site (31).
To deduce the gating machinery in Dps molecules, we have used as our model the second Dps from M. smegmatis. Earlier we had explored the concepts of graph theory to identify groups (clusters) of highly interacting residues, strong interfaces in terms of noncovalent global connectivity from protein structures (32–34). Using such an approach, here we have identified a tight histidine-aspartate cluster at the ferritin-like trimeric pore. This assembly of oppositely charged residues was seen to guard the narrowest point of the pore. Site-specific variants of MsDps2 were generated to disrupt this ionic knot, and the mutants were further assayed for ferroxidation, iron release properties and the structures were solved by x-ray crystallography. Our studies in MsDps2 show the importance of counteracting positive and negatively charged residues for efficient assimilation and dispersion of iron. The gating mechanism happens by alterations in side chain configuration at the pore and does not alter the overall stability of the proteins. This is not surprising, because large conformational changes are destabilizing and therefore energetically unfavorable.
EXPERIMENTAL PROCEDURES
Mutagenesis
Site-specific mutations were introduced by the Phusion site-directed mutagenesis protocol for point mutations. The mutants D138N, H141D, and D138H were generated with the template M. smegmatis dps gene, cloned in pET21b. The double mutant H126D/H141D was created using as template, the H141D point mutant in pET21b. The oligonucleotides used for the mutagenic PCR are as given in Table 1. The mutations were confirmed by DNA sequencing. Furthermore, LC-ESI-MS of the intact proteins were also performed, wherein the purified samples were passed through a reverse phase column (Zorbax 300 SB C8, 2.1 × 100 mm, 3.5 μm) attached to an ESI4 mass spectrometer. A gradient elution using water and acetonitrile each containing 0.1% formic acid was used to separate the proteins, at a flow rate of 0.2 ml/min.
TABLE 1.
Primer sequences used to generate MsDps2 variants
| Mutant | Primer | Sequence (5′-3′) |
|---|---|---|
| D138N | D138N-F | 5′-AGCACGGCCAATCTGCTGCACGGGCTGAT-3′ |
| D138N-R | 5′-GGGATCCTCGGCGTCCACCGCGTCGTGGAC-3′ | |
| H141D | H141D-F | 5′-GCCGATCTGCTGGACGGGCTGATCGACGG-3′ |
| H141D-R | 5′-CGTGCTGGGATCCTCGGCGTCCACCGCGT-3′ | |
| D138H | D138H-F | 5′-AGCACGGCCCATCTGCTGCACGGGCTGATC-3′ |
| D138H-R | 5′-GGGATCCTCGGCGTCCACCGCGTCGTGGAC-3′ | |
| H126D/H141D | H126/141D-F | 5′-ATCCGGCGCGTCGACGACGCGGTGGAC-3′ |
| H126/141D-R | 5′-GGTGTCGACCGTGGCGTTGATACGGGT-3′ |
Protein Preparation
MsDps2 and mutants D138N, H141D, D138H, and H126D/H141D were overexpressed in the E. coli BL21(DE3) strain. The cells harboring the recombinant plasmids were grown in Luria Bertani (LB) medium containing ampicillin (100 μg/ml) at 37 °C to an optical density of 0.6 at 600 nm. After inducing with 1 mm isopropyl β-d-1-thiogalactopyranoside, the cultures were allowed to grow for a period of 3–4 h. The cells were harvested by centrifugation at 15,000 rpm for 15 min, suspended in 50 mm Tris-HCl, pH 7.0, 150 mm NaCl, and disrupted by sonication for 15 min at 30% amplitude (2.0 s on and 4.0 s off). The lysate was centrifuged at 15,000 rpm for 15 min and a final concentration of 30% ammonium sulfate was added to the supernatant at 4 °C and left overnight to achieve precipitation. The precipitate was dialyzed overnight against 20 mm Tris-HCl, pH 7.0, and 50 mm NaCl, then applied on DEAE-cellulose (anion exchanger) equilibrated with the same buffer. Ten column volumes of wash were carried out with equilibration buffer and the proteins were eluted in 200 mm NaCl. The proteins were assayed for purity on a 15% polyacrylamide gel, and the dodecameric status was confirmed by a 10% native PAGE gel in Tris glycine buffer, pH 8.5, for all the proteins. Protein concentrations were determined by the Bradford method (35) and spectrophotometrically at A280 using the molar absorptivity coefficient (36).
Confirmation of Asp → Asn Mutation by LC-ESI-MS/MS
The purified MsDsp2 and D138N proteins were run on a 12% SDS-PAGE gel and corresponding band at 18 kDa was excised, destained, and subjected to in-gel tryptic digestion overnight in 50 mm ammonium bicarbonate, pH 7.5, at 37 °C. The tryptic digests were then extracted from the gel and characterized by conventional MS (LC-ESI-MS) and MS/MS (LC-ESI-MS/MS) according to the protocol reported in Sabareesh et al. (37).
Staining of Iron Binding Proteins on Polyacrylamide Gel
MsDps2 has been shown to bind to iron on staining with potassium ferricyanide solution in polyacrylamide gel-based assays (38). 100 μg of MsDps2 and the respective mutants in their purified form (20 mm Tris-HCl, pH 7.0, 200 mm NaCl) were incubated with 1 mm ferrous sulfate for 1 h at room temperature. The proteins were then resolved on a 10% native PAGE gel and stained with 100 mm potassium ferricyanide solution for 10 min in the dark. Staining with potassium ferricyanide will give a brown coloration with Fe(III). The gel was subsequently destained with 10% trichloroacetic acid/methanol solution. In this acidic condition the ferric ferricyanide reaction happens, which depends on the reduction of ferric to ferrous ions in the presence of ferricyanide, with the production of Turnbull's Blue (39, 40). After recording the image of the gel it was subjected to Coomassie Blue staining to detect total proteins. The experiment was done using 4–5 independent protein preparations and a representative image is presented here.
Quantification of Iron in Purified Protein
To calculate the amount of iron incorporated in the proteins during the 3-h overexpression in E. coli and subsequent purification stages, the formation of a colored complex by Fe(II) with 2,2′-bipyridyl was estimated after reducing the Fe(III) present in the protein by sodium dithionite (4). The values given here are from reactions done in triplicates from two protein preparations, in final volumes of 1 ml having 1 mg of protein (4 μm), 0.4% (w/v) sodium dithionite, and 4 mm 2,2′-bipyridyl in 20 mm Tris-HCl, pH 7.0, and 200 mm NaCl. After overnight incubation at 4 °C the amount of Fe(2,2′-bipyridyl)32+ was measured at 522 nm (ϵmax522 = 8430 liter/mol/cm). The assay can quantitate iron in the ppm range.
Ferroxidation Assay
The iron mineralization kinetics was monitored at room temperature in a Varian Cary 100 Bio UV-visible spectrophotometer. Changes in absorbance values were recorded at 350 nm after mixing solutions of MsDps2 and its mutants in 20 mm Tris-HCl, pH 7.0, and 200 mm NaCl, with ferrous sulfate. The reaction was followed in aerobic conditions for 1 h. The final concentrations in the assay were, 2.0 μm protein, 500 μm FeSO4 in 20 mm Tris-HCl, pH 7.0, 200 mm NaCl. Time taken for the reactions to reach half-saturation (t½) was used for comparison of kinetics in all cases where the progress curves attained saturation at the end of 1 h. Because D138H and H126D/H141D did not reach saturation in 1 h, specific activity expressed as change in absorbance per min/mg of protein was used for comparison. Specific activity was calculated from the linear portion of the curves between 2 and 7 min from three sets of readings from three separate protein preparations. The plots were fitted to a Hill's equation for cooperative binding to calculate the Hill coefficient n given by the formula,
 |
Iron Release Assay
Dps proteins have the capacity for holding up to 480 iron atoms per dodecamer (9, 28). The iron to protein ratio was maintained to half this capacity, such that each dodecamer incorporated ∼240 iron atoms. This was achieved by reacting 2.0 μm protein in 20 mm Tris-HCl, pH 7.0, 200 mm NaCl, and 500 μm FeSO4 at RT for 1 h, followed by overnight incubation at 4 °C. Atomic absorption spectroscopy showed the proteins to have incorporated 266.6 ± 7.4 (MsDps2), 249.5 ± 18.8 (D138N), 265.77 ± 7.5 (H141D), 257.2 ± 13.7 (D138H), and 269.5 ± 6.9 (H126D/H141D) iron atoms/dodecamer under these reaction conditions. The values are the averages obtained from 3–4 readings from two independent protein preparations.
Proteins thus loaded with iron to half-saturation were reacted with 2.5 mm sodium dithionite and 2.5 mm 2,2′-bipyridyl. The protein solutions were in 20 mm Tris-HCl, pH 7.0, 200 mm NaCl and a final concentration of 0.2 μm. The reactions were monitored for 20 min in a Jasco V-630 UV-visible spectrophotometer and the absorbance change at 522 nm was followed corresponding to the formation of the Fe(2,2′-bipyridyl)32+ complex (Equation 2). Time taken for 60% of the iron to be reduced and complexed with the chelator was compared. The readings were obtained from an average of three reaction profiles from three independent protein preparations.
To monitor early phases of the reaction, the formation of colored complex was recorded using a stopped flow spectrophotometer with a setup of three syringes (SFM-300, Biologic, France) at 24 °C. The volume of each assay mixture was 202 μl with enzyme and substrate mixed at a ratio of 1:1 by volume. 0.2 μm protein solutions in 20 mm Tris-HCl, pH 7.0, at RT, 200 mm NaCl were mixed with 2.5 mm sodium dithionite and 2.5 mm 2,2′-bipyridyl. Total flow rate was maintained at 14 ml/s with 7 ml/s from each syringe. Total duration of each assay was 15.99 s with a total of 8000 data points and 2-ms sampling period. Dead time or time delay before data acquisition was 2.2 ms and the reaction was monitored from a time point, which was 10 ms before hard stop. Each time course was fitted to a multiexponential equation (Equation 3) to estimate the values of slope over the linear regions of the traces.
where, a is the slope, b is the offset Ci is the amplitude or total change in absorbance, ki is the rate constant, and t is the time. Both a and b correspond to the time course of the reaction trace obtained at infinite time. The rates have been calculated from a set of three reactions from two different protein preparations. Each progress curve was an average of 10–15 scans. A total of 5000 iterations were performed in each progress curve to obtain the best-fit with the minimum possible χ2 value. The progress curves presented in the figures are representative from one of the three reaction sets.
Protein Crystallization
Crystals were obtained for the modified MsDps2 proteins by mixing 2 μl of protein solution (10 mg/ml, 20 mm Tris-HCl, pH 7.8, at 4 °C and 200 mm NaCl) with an equal volume of the precipitant solution (50–200 mm MgCl2, 0.1 m sodium cacodylate, pH 6.5, and 20% PEG 3350). Crystallization was performed at 293 K under oil by a microbatch method using a 1:1 ratio of silicone and paraffin oil in a 72-well microbatch plate. Under these conditions, diffraction quality crystals appeared in a week.
Data Collection and Refinement
X-ray diffraction data were collected on a MAR 345 image plate, mounted on a Bruker Microstar Ultra 2 rotating anode generator at 100 K. The crystals were submerged for 10 min in the precipitant solution containing 20% glycerol as a cryoprotectant before data acquisition. The intensity data were processed and merged using MOSFLM and SCALA in the CCP4 program suite (41, 42). Structure factor amplitudes were obtained from the intensities using TRUNCATE (43). Data collection statistics are summarized in Table 2.
TABLE 2.
Data collection and refinement statistics
| Protein | D138N | H141D | D138H | H126/141D |
|---|---|---|---|---|
| Data collection | ||||
| Wavelength (Å) | 1.54179 | 1.54179 | 1.54179 | 1.54179 |
| Space group | H32 | H32 | H32 | H32 |
| Unit cell (a = b ≠ c, Å) | a = b = 89.65, c = 421.07 | a = b = 90.67, c = 419.69 | a = b = 89.49, c = 420.40 | a = b = 90.23, c = 420.31 |
| Resolution range (Å) | 43.57–1.85 | 30.0–2.21 | 30.0–2.03 | 30.0–2.03 |
| Rmergea | 0.064 (0.232)b | 0.134 (0.328)b | 0.042 (0.101)b | 0.053 (0.139)b |
| Number of unique reflections | 55,022 (6,777)b | 33,223 (4,251)b | 41,333 (4,911)b | 41,264 (4,752)b |
| <I/σI> | 15.3 (5.6)b | 15.6 (6.9)b | 37.0 (18.5)b | 25.6 (11.7)b |
| Completeness (%) | 97.3 (83.0)b | 98.1 (87.5)b | 97.2 (81.1)b | 95.8 (76.9)b |
| Multiplicity | 4.6 (5.0)b | 11.1 (9.3)b | 8.8 (8.3)b | 7.0 (6.4)b |
| Refinement | ||||
| R (%) | 18.05 | 17.53 | 16.59 | 17.46 |
| Rfree (%) | 20.77 | 21.29 | 20.47 | 20.64 |
| R.m.s. deviations bond lengths (Å) | 0.006 | 0.007 | 0.007 | 0.007 |
| R.m.s. deviations bond angles (deg) | 0.815 | 0.907 | 0.839 | 0.855 |
| Number of atoms | ||||
| Protein atoms | 5469 | 5337 | 5253 | 5329 |
| Iron | 4 | 4 | 4 | 4 |
| Magnesium | 3 | 6 | 5 | 2 |
| Chloride | 2 | 2 | 2 | 2 |
| Water | 429 | 365 | 332 | 388 |
| Ramachandran statistics (%) | ||||
| Core regions | 96 | 97.1 | 96.6 | 96.9 |
| Generously allowed regions | 4 | 2.9 | 3.4 | 3.1 |
a Rmerge = ΣhklΣi|Ii (hkl) − 〈I(hkl)〉|/Σhkl Σi Ii (hkl), where Ii(hkl) is the ith observation of reflection hkl and 〈I(hkl)〉 is the weighted average intensity for all “i” observations of reflection hkl.
b Highest resolution shell.
The protein atoms of the native MsDps2 structure (PDB code 2Z90) (23) were used as the starting model for refinement. Initially the structures were subjected to 10 rounds of rigid body refinement, followed by positional refinement using REFMAC (44) from the CCP4 suite. Manual model building was carried out using the interactive graphics program COOT (45) with σ weighted 2Fo − Fc maps, and positional refinement was done until the R and Rfree values were in acceptable ranges. Water molecules were assigned based on the 2Fo − Fc map contoured at 1.0σ and Fo − Fc map at 3σ. Positions of metal atoms were deduced from relatively high electron density. The Mg2+ and Cl− ions were assigned in positions corresponding to the MsDps2 structure. Refinement parameters for the structures are given in the Table 2. The model was validated using PROCHECK (46) and the RCSB validation server. Atomic coordinates and structure factor have been deposited in the Protein Data Bank, the accession codes being 4M32 (D138N), 4M33 (H141D), 4M34 (D138H), and 4M35 (H126D/H141D).
Structural Analysis and Comparisons
All structural superpositions and r.m.s. deviation calculations were carried out using ALIGN (47). Atomic distance calculations in the structure were done using COOT. PyMol and COOT were used for visualizing the structures (48). Figures were prepared using PyMol. Interactions were predicted with the protein interaction calculator (49).
Network Analyses
Identification of interface clusters from the structure of the wild type and mutant Dps and detection of the pore sizes in the milieu of global connectivity, from the structures of mutants were carried out by graph theoretic analysis. The details of methodology and its application to the problems in structural biology such as oligomerization, allostery, etc. were presented earlier (32, 33). A brief description of the methodology is presented here.
Protein structure graphs (PSGs) are defined as nodes (amino acids) connected by edges, which are drawn on the basis of interaction strengths (Iij) between the nodes. The interaction strength Iij between any two nodes i and j is defined as,
 |
where nij is the number of unique atom pairs between i and j within a distance of 4.5 Å. Nx is the normalization value for residue type x (Equation 4).
PSG topology is represented by an adjacency matrix (Equation 5), defined with every element of the matrix satisfying the rule,
 |
where Imin is the minimal interaction strength. The nodes i and j are connected if the Aij is 1. Clusters or groups of autonomously interacting residues for a PSG can be obtained by employing Depth First Search algorithm (50). An interface cluster is defined if the participating nodes in the cluster are from different monomers of the multimeric protein. PSG remains a highly connected network at low Imin (0–3%) and resembles a scale-free network with islands of densely connected subnetworks at high Imin (5–9%).
RESULTS
Identification of a His-Asp Ionic Cluster
To identify the clusters present near the iron passage of MsDps2, we used a graph theoretical approach (32) in which the protein is represented as protein structure graphs or PSGs. By this, the interactions and connectivity patterns were mapped in both trimeric interfaces (Dps-like and ferritin-like). Protein structure graphs for the native trimers were generated at Imin = 6% (PSG6) and the interface clusters were obtained. There are two crystallographic trimeric interfaces present in Dps, namely the Dps-like and ferritin-like trimeric interfaces (8). Although both trimers had interface clusters, the Dps-like interface is too small and highly clustered (Glu58, Gln55, Arg50, Glu157, Asp51, and Asn48) for iron trafficking. Whereas, the pore size of the ferritin-like trimeric interface allows for iron transport, and additionally the pore cluster stabilizing the interface is composed of charged interactions of the His141–Asp138 pair forming a convenient cloud of opposite charges (Figs. 1B, 2A, and 6A). This pair of ionic interactions extend from each monomeric subunit comprising the trimer, forming a single compact cluster at the pore opening. To further investigate the role of this cluster in the stability of the pore, which in turn may affect the uptake and retention of iron in the protein core, we employed site-directed mutagenesis to generate D138N, H141D, and D138H site-specific mutants. Through clues obtained from the crystal structures of these mutants, as will be discussed in the later sections, we also created a double mutant H126D/H141D.
FIGURE 2.

The histidine aspartate ionic lock in MsDps2 and structure-based sequence alignment with known Dps sequences. A, the 3-fold pore is shown with the residues comprising the ionic lock shown as spheres. The three subunits are shown in magenta, beige, and green; the corresponding residues are also colored in the same way. The nitrogen atoms in histidine 141 are blue, and the carboxyl group of aspartate 138 is shown in red. B, the residues at the outer surface are marked in yellow and the inner residues are in magenta. The histidines are not conserved in Dps homologs, but the aspartates at these positions are highly conserved (Asp138), and in the case of Asp127, substitutions are seen by glutamates in some cases.
FIGURE 6.

Prediction of interface clusters from the 3-fold interface with graph theory. A–E, interface clusters in the Protein Structure graphs (PSG6) of the ferritin-like interface of the MsDps2 (A, MsDps2 protein (PDB 2z90) and mutants; B, D138H (PDB 4M34); C, D138N (PDB 4M32); D, H126/141D (PDB 4M35); and E, H141D (PDB 4M33)) are represented as van der Waals spheres of each color representing a separate cluster. The pore clusters are absent in H141D and H126D/H141D variants. The residue composition of each cluster (vertical axis) for each cluster (horizontal axis) are provided below each of the schematic representations. Presence of a residue in a cluster is marked by a black dot. The clusters are named from C1 to C12 based on their occurrence in the respective PSG and are arbitrary.
Structure-based sequence alignment using MUSTANG (51) with known structures of MsDps2 homologs (Fig. 2B) showed that Asp127 and Asp138 were highly conserved, although Asp127 showed substitutions with glutamate in a few cases. Comparatively, the histidines are less well conserved across the homologs, and coupled with the fact that it is a quintessential moiety in the pore cluster, provided us with an interesting site for mutation.
A Gel-based Iron Binding Assay
To visualize the binding capacity of the mutants with respect to MsDps2 to iron added externally in the protein solution, proteins under native conditions or with loaded iron were resolved on a native PAGE gel and stained with K3(Fe(CN)6). Potassium ferricyanide reacts with protein-bound iron atoms to form royal blue complexes and can be visualized as blue bands in native polyacrylamide gels (40). Because the iron added to Dps proteins are internalized through the protein channel, the ferricyanide binds to iron atoms within the protein shell. This correlates to the fact the iron-bound proteins can be detected on the gel with ferricyanide staining. The proteins without any iron added in vitro, stained with a lesser intensity, and iron incorporated during the 3-h overexpression period in E. coli were quantified by spectrophotometric methods. For the proteins that were incubated with ferrous sulfate and having sufficient iron to give prominent bands in the gel, it was observed that with the exception of H126D/H141D, all proteins showed iron sequestration capacity (Fig. 3A). In the case of H126D/H141D, the protein with iron showed a smear as it migrated in the electric field applied across the gel, with the iron (positively charged) complexed with ferricyanide moving toward the negative electrode. Because it is seen that free iron does not enter the gel (data not shown), the smear is produced due to iron leaking out as the protein moves toward the positive electrode. H141D, although quite stable in its capacity to retain iron, showed a fuzzy appearance in the band that corresponds to the iron-loaded state. This indicates loss of iron from the protein, but to a lesser extent as compared with H126D/H141D.
FIGURE 3.
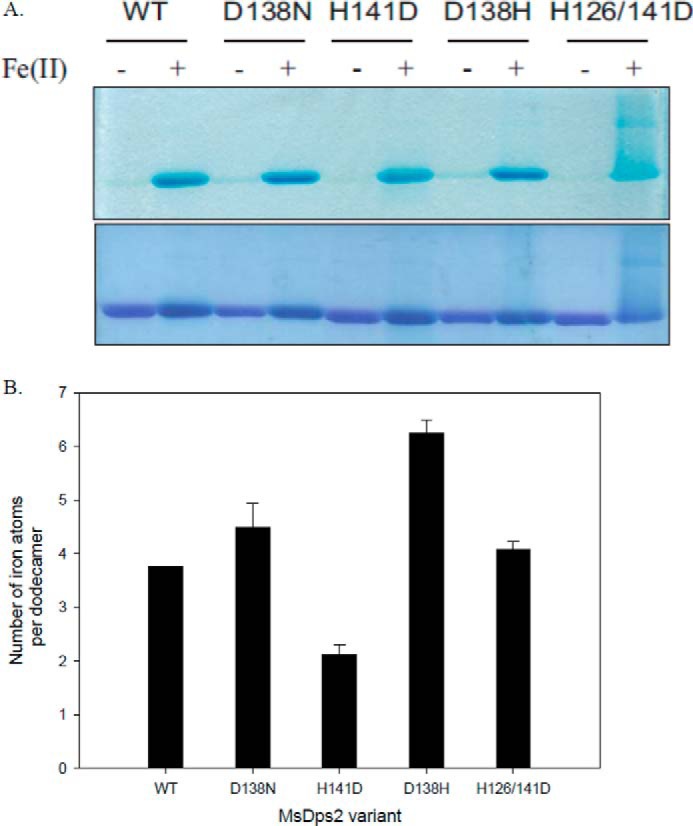
A, gel-based iron binding assay. MsDps2, D138N, H141D, D138H, and H126D/H141D proteins were loaded onto a 10% native PAGE, with (+) or without (−) added iron. The gel was stained with potassium ferricyanide (top panel), destained, and further stained with Coomassie Blue (bottom panel) to detect all the proteins. B, iron assimilated by the proteins in the expression and purification steps. After purification, the proteins were treated with sodium dithionite and 2,2′-bipyridyl, which forms a complex, [Fe(2,2′-bipyridyl)32+] with Fe(II). This complex can be assayed at 522 nm and the number of iron atoms assimilated per dodecamer was calculated and is given as a bar graph. Numerical values are given in the text. The values are averaged over 4–5 experiments with 2–3 different protein preparations.
Iron Incorporated by the Proteins in their Native Purified State
For comparison of the iron captured by MsDps2 and its mutants during production in the host heterologous expression system, the purified proteins were assayed for bound iron by quantifying the colored complex (Fe(2,2′-bipyridyl)32+), which is formed by reduced iron on the addition of 2,2′-bipyridyl. The amount of iron incorporated per dodecamer during the different stages of overexpression and purification is plotted in Fig. 3B and the numbers are given below. MsDps2 (3.75 ± 0.1), D138N (4.50 ± 0.35), and H126D/H141D (4.0 ± 0.14) showed an approximately similar number of iron atoms per dodecameric protein molecule, whereas D138H showed an increase by a magnitude of two (6.25 ± 0.20) and H141D (2.10 ± 0.15) incorporated twice as less iron as compared with that of the wild type. Although these numbers are well below the 480 iron atoms per dodecamer that Dps proteins can carry in vitro, it is similar to the values observed in purified proteins of S. suis (9.9 ± 1.6) and Streptococcus mutans (10.8–27.5 iron atoms per dodecamer) Dps homologs (29, 52).
Comparison of Ferroxidation Kinetics
Dps proteins can store up to 480 iron atoms per dodecamer when the iron is added in vitro (52, 53). Ferroxidation can happen with hydrogen peroxide or oxygen as the oxidizing agent. Faster ferroxidation rates are observed with H2O2 rather than oxygen as the reagent (5). Iron supplied as ferrous sulfate is oxidized and stored in the protein cavity as a microcrystalline ferric hydroxide core. This time course measurement of ferroxidation by oxygen was carried out at 350 nm with concentrations of iron adjusted to reach half-saturation for the proteins (i.e. around 240 iron/dodecamer). The kinetics of core formation is characterized by a sigmoidal curve (Fig. 4A) representing a slow nucleation step, followed by a fast cooperative phase (10) (Hill coefficient “n” given in brackets for all the proteins). This trend was followed by MsDps2 (n = 1.64), D138N (n = 1.54), and H141D (n = 1.46), although the two mutants showed a reduction in cooperativity; and the time taken for the reaction to reach half-saturation (t½) was extended in the case of D138N (9.04 ± 0.08 min) and H141D (12.85 ± 0.05), the wild type being 7.44 ± 0.32 min (Table 3). Interestingly, D138H (n = 0.93) and the double mutant H126D/H141D (n = 0.66) showed a reduction in cooperativity in their ferroxidation curves suggesting an abrogation in the cooperative kinetics with no distinction between the slow and fast phases. A comparison of the proteins with respect to their specific activity showed a four to five times reduction in D138H and H126D/H141D as compared with that of the MsDps2 native protein (Table 3). However, with prolonged incubation both mutants were seen to attain saturation with the iron supplied to them. Because the accessibility of iron to the ferroxidation center is limited because of the changed pore environment, it can be assumed that mutations that disassemble the cluster at this interface will directly affect the iron oxidation properties of Dps to a different extent depending on the level of disruption caused by the mutation.
FIGURE 4.
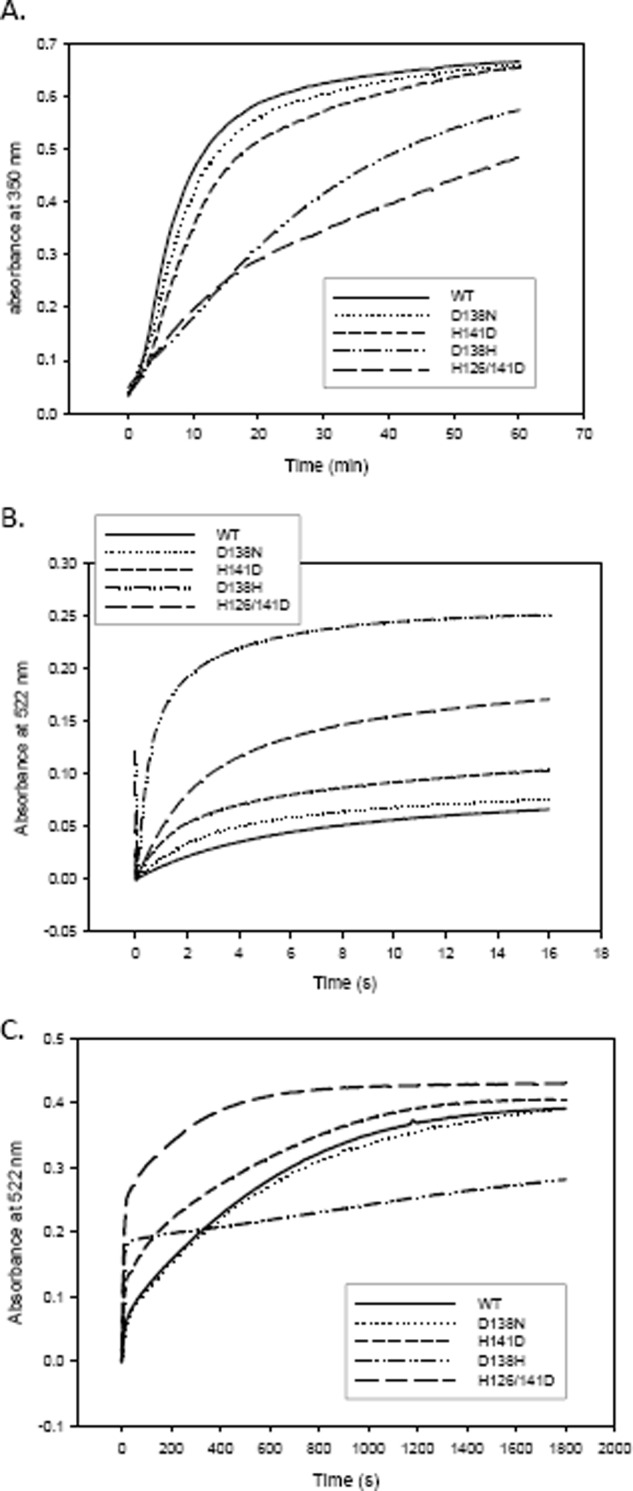
A, comparison of ferroxidation kinetics among the MsDps2 and mutants. Graphical representation of the progress curves showing ferroxidation for the various proteins as a function of time. Ferroxidation is triggered by the addition of ferrous sulfate to the protein solutions and monitored for a period of 60 min. The specific activity thus calculated is given in Table 3. B, comparison of iron release kinetics among MsDps2 and its variants. The rate of release of iron from proteins loaded with iron to half-capacity is monitored in a stopped flow instrument for a time period of 15 s to calculate the initial rate of release. The release was initiated by the addition of sodium dithionite (reduces Fe(III) to Fe(II)) and subsequent chelation by 2,2′-bipyridyl to form a pink colored complex with absorbance maxima at 522 nm. C, shows the reaction followed to 20 min where all iron is exited from the pores (except in case of D138H). This was used to calculate the time taken for the reduction and complexing of 60% of iron from the various proteins. The numerical values are shown in Table 3.
TABLE 3.
Comparison of ferroxidation and iron release kinetics of MsDps2 and its variants
| Ferroxidation kinetics |
Iron release kinetics |
||
|---|---|---|---|
| Proteina | SA (ΔA350[Fe3+]/min/mg of protein)b | Initial rate of Fe exitc | Time taken for 60% dissolution of iron core |
| nmol/s | min | ||
| MsDps2 | 0.116 ± 0.008 | 0.205 ± 0.017 | 7.42 ± 2.7 |
| D138N | 0.095 ± 0.007 | 0.201 ± 0.018 | 7.5 ± 1.8 |
| H141D | 0.078 ± 0.004 | 0.365 ± 0.053 | 4.75 ± 0.82 |
| D138H | 0.026 ± 0.002 | 4.47 ± 0.45 | 16.06 ± 1.97 |
| H126D/H141D | 0.035 ± 0.006 | 0.570 ± 0.028 | 0.44 ± 0.14 |
a MsDps2 and its pore variants, in 20 mm Tris-HCl, pH 7.0, 200 mm NaCl, expressed and purified from E. coli cells.
b Iron was added in the form of [FeII] and ferroxidation was monitored by change in absorbance at 350 nm over a period of 60 min. Specific activity was calculated from the linear portion (2–7 min) of the sigmoidal curve.
c Proteins half-saturated with iron were subjected to reductants and chelators to dissolve the ferric mineral. The exited iron forms a colored complex Fe(2,2′-bipyridyl)32+ with an abosrption maxima at 522 nm and the reaction was followed for 15 s, the inital rates were calculated from the slopes of the linear part of the curves (0.04–2.0 s for MsDps2, D138N, H141D, and H126D/H141D and 0.04–0.4 s for D138H).
Comparison of Iron Release Kinetics
Proteins that had accumulated iron to half their capacity were treated with the reducing agent sodium dithionite. The reduced iron was then chelated with 2,2′-bipyridyl, which forms a pink colored complex Fe(bipyridyl)32+ with an absorption maxima at 522 nm (Fig. 4B). The iron release kinetics has a rapid first-order release kinetics for the iron released from the surface of the core and is followed by a slower kinetics for the release of iron at the core (54). The initial rates were calculated from the linear portion of the burst phase obtained by stopped flow experiments, by fitting the curves to a multiexponential equation (Equation 3) (Table 3). The initial rate was highest for D138H being ∼10–15 times as that of the wild type. H126D/H141D exhibited a rate that was three times as fast, but the second phase of iron release exhibited the steepest slope and hence the fastest rates among all the proteins. In D138N the rates showed little deviation from the parent protein. H141D had a higher rate of initial release than the parent protein.
The reaction was also followed for a period of 20 min, where all the iron is reduced and complexed with 2,2′-bipyridyl except in case of D138H where only about 60–70% of iron was discharged in the given time period (Fig. 4C). Table 3 shows the time taken for 60% of the iron to exit the protein cage in each case to compare all the variant proteins with MsDps2. The disintegration of 60% of the mineral core was ∼20 times faster in the case of H126D/H141D as compared with the native protein. D138H exhibited the longest time for core dissolution, being an average of 16 min as compared with 7.5 min for the native protein.
Substitution at the Pore Disrupts the Ionic Lock and Dilates the Exit Channel
The crystal structures of the mutants were analyzed against the backdrop of the wild type for any structural deviations from the native dodecameric form. It was seen that all the mutants retained the ability to form dodecamers and crystallized in the same space group H32 as that of the wild type. The r.m.s. deviations of the Cα atoms were less than 0.2 Å in all cases, which implied that there were no major distortions in their structures with respect to the native protein. The interactions of the side chains, in the altered scenario of mutations, were mapped with the help of the protein interaction calculator (49). The substitutions in all cases resulted in the disruption of the His141–Asp138 ionic cluster at the channel. The altered conformations of the side chains in the Dps2 variants are represented in Fig. 5, A and B.
FIGURE 5.
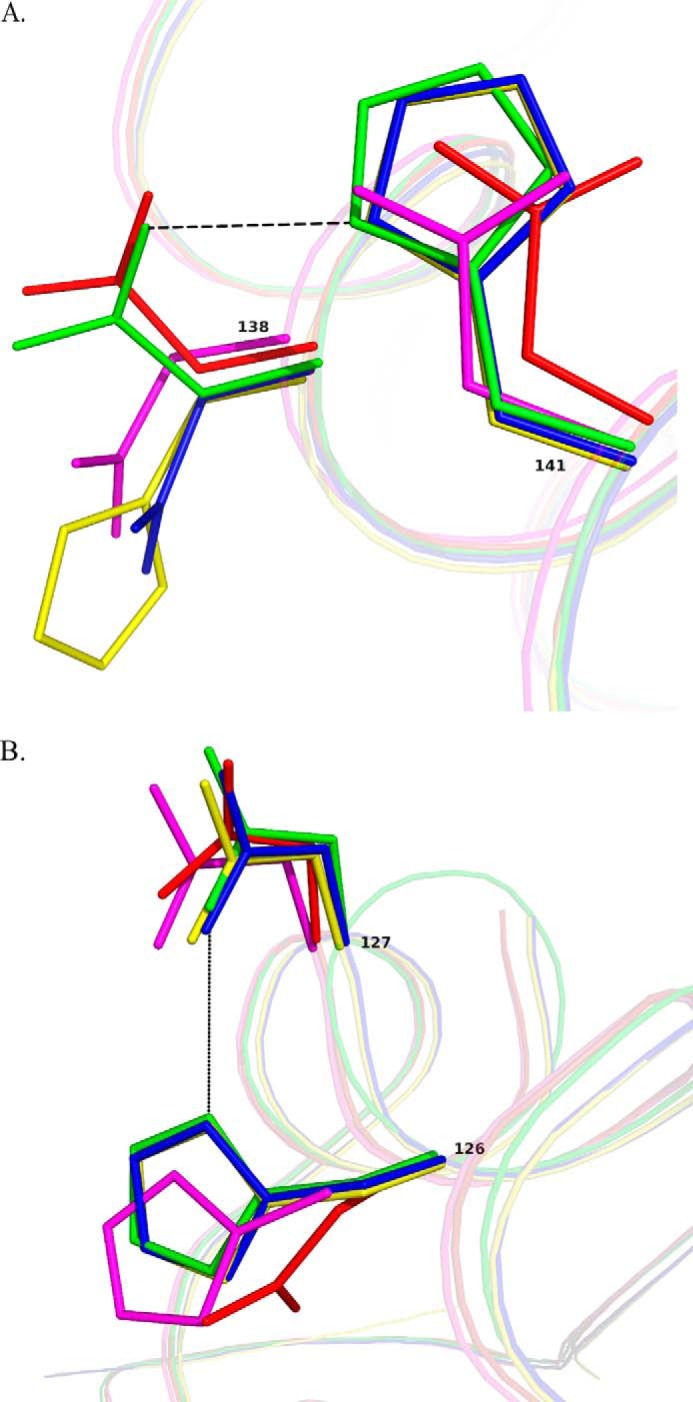
Superposition of the proteins with mutated residues on MsDps2 showing side chain conformational changes. The following color codes have been given for the residues from the various proteins; MsDps2, green; D138N, blue; H141D, magenta; D138H, yellow; and H126D/H141D, red. A, the residues of the mutant proteins has been overlaid with Asp138 and His141 from the MsDps2. The residues at position 141 remains more or less unaltered, with a translational shift exhibited by mutated aspartates in H141D and H126D/H141D. Mutations at the 138th position alter the side chain conformation in all cases. B, residues at 126 and 127 positions superposed on the MsDps2 His126 and Asp127 amino acids. Major shifts in side chain conformations are exhibited by mutants H141D and H126D/H141D at the 126th position, as described in the text.
In case of D138N (PDB code 4M32) and D138H (PDB code 4M34) where a negatively charged residue was replaced by a neutral residue like asparagine or a positively charged residue like histidine, respectively, both ionic interactions as well as hydrogen bonding between the side chains were disrupted. When the histidine was replaced by an aspartate that resulted in six aspartate residues at the inner surface of the pore (H141D, PDB code 4M33), there was an additional breakage of Asp130–His141 charged interaction. Also, the repulsive forces due to the aspartates introduced at the pore were stabilized by the formation of a new interaction with histidine (His126–Asp141) in the mutant. To further destabilize the channel we constructed a double mutant H126D/H141D (PDB code 4M35), having a total of 12 aspartates at the trimeric interface. This preponderance of negatively charged aspartates at the pore resulted in an extensive disruption of the His–Asp bonds (His141–Asp138, His141–Asp130, His126–Asp130, and His126–Asp127) in the double mutant. Thus in this case a local concentration of charged interactions was caused to disassemble resulting in a locally destabilized state, whereby the iron was easily accessible to chelators added in vitro.
The repulsion between proximally placed aspartates would cause them to move away from each other and the opening of the channel, thereby causing the pathway to widen. This was observed in H141D, H126D/H141D, and to some extent in D138N. In D138H the presence of six positively charged bulky histidines at the pore obstructs the passage and results in less easy access to the iron inside. Also H141D and H126D/H141D having more aspartate residues form a negatively charged gradient at the pore, which guides the iron to the exterior more easily in the presence of chelators.
Interface Cluster Analysis Using Graph Theory
We generated the PSG6 (as described under “Experimental Procedures”) of the mutants from the crystal structures and compared the cluster compositions of the mutants among themselves and with the wild type to identify mutation-induced changes in the interaction networks. Analysis shows that the effect of mutation on the structure is localized as expected, with the clusters of the D138H mutant being very similar to that of the wild type (Fig. 6, A and B). Although the D138N mutant has lost the true trimeric interface cluster, it still maintains the interface cluster through dimeric clusters (Fig. 6C, C5, C9, and C12), whereas on the other hand, both H141D and H126D/H141D lost their interface clusters (Fig. 6, E and D). The native and mutant PSG were further analyzed at different Imin (3–8%). In case of D138H at different Imin, we find that the interactions in D138H seem to have increased as compared with the native (details not shown). We observed that H141D has interactions at the pore only at low interaction strength (3%), whereas the double mutant H126D/H141D (Fig. 7, A and B) has completely lost its interface interactions. The loss of the interface cluster correlates very well with the increase in iron release dynamics re-affirming our proposal that this is a functional cluster involved in iron trafficking. The network analysis also shows that significant biological changes can take place by practically no change at the overall protein backbone conformation level, but by subtle rearrangement of side chain interactions.
FIGURE 7.


PSG of Ms-Dps2 ferritin-like interface (native and mutant). A comparison is shown of the native protein and mutant H126D/H141D showing the highest rate of iron release. Here the interactions of the ferritin-like trimeric interface are represented as nodes and edges. Each node represents an amino acid (naming nomenclature, [Chain][Residue number][Residue type]) and the edges are colored based on their interaction strength. The table below shows the color code for each type of node. This helps us in deeper understanding of the effects of mutations (B, H126D/H141D) on MsDps2 Ferritin-like interface (A, native). The residues mutated in H126D/H141D are assigned red font color. Only the interactions important in maintaining the pore interface are labeled for clarity. Asp130 is omitted in the mutant protein due to the absence of any interactions. Interaction strength (Equation 4): dark red, I > 8; red, 8 > I > 7; green, 7 > I > 6; yellow, 6 > I > 5; deep sky blue, 5 > I > 4; cyan, 4 > I > 3.
Surface Representation of the Trimeric Interface Showing van der Waals Radii and Electrostatic Potential
A molecular van der Waals surface, also called a van der Waals envelope, is a common representation of proteins to show binding “cavities” in the structure. Here, we generated a van der Waals surface area of the proteins to compare pore dimensions (Fig. 8). The Asp138–His141 cluster lining the opening can be readily visualized by this representation. An equilateral triangle with side “a” was constructed connecting atoms of the residues framing the aperture in a way as to adequately represent the width of the opening. The opening was narrowest in MsDps2 (a = 3.3 Å) and D138H (a = 3.8 Å). D138N (a = 6.6 Å) and H141D (a = 7.4 Å) showed similar patterns with the 138th position residue obstructing the otherwise widened pore. H126D/H141D (a = 8.5 Å) showed maximum distension of the pore, agreeing well with the heightened rate of iron release it exhibits.
FIGURE 8.

Van der Waals representation of the trimeric interface showing pore dimensions. A–E, the opening of the pore is measured by lines connecting the atoms nearest to each other in the pore to give approximate measurements of size in each case. A, MsDps2 protein (PDB 2Z90); B, D138N (PDB 4M32); C, H141D (PDB 4M33); D, D138H (PDB 4M34); and E, H126D/H141D (PDB 4M35). The gating residues are represented as sticks; the subunits of the trimer are colored blue, green, and magenta.
Mass Analysis Shows a Substitution at Position 138 from Aspartate to Asparagine
One of the substitutions at the pore interface, which was the replacement of an aspartate residue at the 138 position with asparagine (D138N), resulting in a drop of the average molecular mass by 0.98–1 Da, was confirmed by ESI-tandem mass spectroscopy (MS/MS). Because many of the biochemical properties of D138N were similar to MsDps2, it was necessary to ascertain that there was no reversal of the mutation.
After in-gel trypsin digestion, the peptides were subjected to LC-ESI-MS/MS. The peptide having a amino acid of interest showed a mass of 2631.1 and 2630.2 Da for the native and mutant, respectively (data not shown). The data were acquired by including only the doubly, triply, and quadruply protonated species (m/z values). LC-ESI-CID MS/MS spectra of a [M + 2H]2+ precursor ion m/z 1316.0 and 1315.6 for MsDps2 and D138N was acquired. The blown up spectrum of the doubly charged precursor ions of MsDps2 (Fig. 9A) and mutant (Fig. 9B) showing signals of b15, b16, b21, y13, y14, and y15 along with their isotopic peaks show a shift by 1 Da in peptide fragments having the substitution.
FIGURE 9.

Expansion of CID MS/MS spectra of the precursor [M + 2H]2+ showing the difference of 1 Da between m/z values of b15, b16, b21, y13, y14, and y15 of MsDps2 (A) and D138N (B). The signals of b15, b16, b21, y13, y14, and y15 are shown with their isotopic peaks. The theoretical m/z values of MsDps2 are: b15 = 1536.6, b16 = 1649.7, b21 = 2185.91, y13 = 1393.74, y14 = 1495.82, y15 = 1582.97; D138N: b15 = 1535.69.6, b16 = 1648.78, b21 = 2184.91, y13 = 1392.79, y14 = 1493.78, and y15 = 1581.85. The ions having the mutated residue are indicated by an asterisk.
DISCUSSION
The two Dps homologs of M. smegmatis namely MsDps1 and MsDp2 both have the properties of DNA binding and ferroxidation, which are central features of most Dps molecules, with a few exceptions. MsDps1 is the only Dps that has been shown to exist as a trimer and a dodecamer in solution (55). MsDps2 on the other hand exhibits a stable dodecameric form in vitro (23). In this study, we have used as our model MsDps2 to study the mechanism of iron uptake and release in mycobacterial Dps molecules. This protein has a novel histidine aspartate ionic cluster present in the ferritin-like interface, acting as a clamp that allows for the free passage of iron. Here we show that substitutions at these loci affect the dynamics of iron storage in these proteins.
The funnel-shaped pore enclosed by the ferritin-like interface is wider at the solvent side and constricts toward the interior of the protein cavity. The outer exposed surface of this funnel has residues His126 and Asp127, of which the latter is likely to be the first negatively charged residue that an iron atom will encounter in the channel on its way to the protein cavity. In Listeria monocytogenes Dps, molecular dynamics were used to simulate the motion of cations into the protein cage. There it was shown that most of the interactions that cations made with the residues were transient, and the strongest interaction was seen with Asp121, where the ions spent around 25% of their time in its vicinity (56). In M. smegmatis, Asp127 may act as a pathfinder for the ions, helping to guide them toward the channel. From here ion is passed on to Asp130, which is the structural counterpart of L. monocytogenes Dps Asp121.
The narrowest part of the pore is guarded by interacting residues Asp138 and His141 to form a tight cluster, as observed from its structure network, thereby selectively regulating the passage of solutes across the protein cage. Apart from these there are a number of aspartate residues like Asp130, Asp133, and Asp145 etc., which form a negatively charged electrostatic gradient to facilitate the movement of iron. The role of these charged residues in iron translocation has been documented in L. innocua Dps (28).
The residues at active sites of proteins can be rigid or flexible in nature. This is a property of the site at which the residue is present in the protein and does not always depend on the nature of the amino acid. In analyzing the structures of the mutant proteins, it was seen in all cases that the mutations did not affect the conformation of residue at position 141, whereas the residue at the 138th position showed a shift in side chain orientation. A lateral shift at position 141 was seen in H141D and H126D/H141D, but the substituted residues remained in the same plane as His141 (the mutants had similar χ angles as that of the native). Therefore, the disruptive mutations caused residues at the 138th position to make amendments by adjusting to the altered environment. Also, the histidines in this area are not conserved across the Dps species. In MsDps2, the role of these histidines could be to position the aspartates favorably for the iron uptake/release processes. This role in other Dps molecules may be taken up by different neighboring residues. The aspartates, on the other hand can flip freely in their positions, altering the pore size to allow rapid entry or exit of iron.
The ferritin family proteins are considered very stable and structurally rigid. Pioneering work in the role of conserved residues at the interhelix and loop sites near the 3-fold junction for iron release was carried out in frog H-chain ferritins. Here, an ion pair Arg72/Asp122 was identified as important in controlling the rate of iron expulsion. Replacing this with another ion pair Arg122/Asp72 did not restore the phenotype suggesting that charge repulsion alone does not account for this (57, 58). Furthermore, structural studies of these mutants showed that fluctuations of the cytoplasmic gates in the pore structure control iron entry and exit (27). MsDps2 also has patches of positive-negative potentials for gating at the pore similar to that observed in ferritins. In the MsDps2 Asp138–His141 ion pair, we observe that the site of the aspartate residue is flexible and the histidines are located in a more rigid “area.” Therefore the charge as well as the location of the charged amino acid residues are critical for the iron uptake/release processes to be optimal.
The ferroxidation curve of Dps follows a sigmoidal shape suggesting a cooperative mode of iron binding and oxidation (28). Mutation of His141 to an aspartate increases the t½ of the reaction, but saturation is attained at the end of an hour like MSDps2. On substituting Asp138 with an asparagine, there is no evident change with respect to the native protein. But replacement with a positively charged bulky residue like histidine in this position causes a marked reduction in the specific activity of the enzyme, although the iron binding assay shows that it can stably bind and retain iron. On the other hand in the double mutant H126D/H141D, having a high preponderance of aspartate residues at the pore, there is reduced ferroxidation and iron retention capacity. The increased negative potential at the gate shifts the equilibrium of iron intake by exerting an additional attractive force on the positively charged iron, thereby retaining them near the pore and delaying the time taken to reach the ferroxidation center.
Iron that is oxidized and stored in the protein can be released by the addition of reductants and chelators externally. This kinetics exhibits an initial fast rate that corresponds to the release of iron bound near to the exit pores, followed by a slower release rate that is the dissolution of the iron oxide in the protein core (28). Here substitutions with charged residues showed maximal change with respect to native Dps2. Histidine to aspartate (H141D, H126D/H141D) changes resulted in an increased rate of iron release. Replacement with a neutral residue (as in case of D138N), did not alter the protein function. Substitution with histidines (D138H) showed a high initial rate, but the second phase of release was much slower. The initial fast rate of release can be attributed to the repulsion contributed by histidine residues to the positively charged iron atoms, making them easier for chelation with the bipyridyl moiety, as compared with the aspartate residue at this position in the wild type, which exerts a greater attractive force on the iron atoms. The second phase of release of the iron at the interior core of the protein showed a slow rate of release. This core is less easily accessible to the reductant-chelator reagents, and may require them to enter physically into the protein shell. The expulsion of iron atoms at this stage may also be hampered by the bulky histidine residues during the second phase of release where the reagents have to reach the core of the protein cavity.
An interface cluster analysis of the native protein and the variants showed disruption of the pore cluster in H141D and H126D/H141D and an overall correlation between the presence of interface clusters and iron dynamics. A van der Waals surface representation indicated that the pore size was increased in these mutants. An increase in pore size and absence of clusters, which keeps the pore intact may result in easier access of reductants/chelators to the protein cavity. Whether the chemicals enter physically into the protein or the reduction of iron oxide is rendered by an electron transfer process across the protein shell is not very clear. Evidence supporting both views have been reported in ferritins, which are 24-mer Dps homologs (59, 60). If it is the latter, then the increased rate of iron release can still be explained by the fact that more numbers of iron atoms can exit a bigger pore at a given time than a pore of lesser dimensions. A histidine aspartate cluster is interesting in the view that histidine is ionizable near physiological pH. With a pKa of 6.0, slight variations in the pH can result in a loss or gain of positive charge. Keeping in mind that the pKa values of charged residues may be affected by the surrounding residues in a protein we have predicted the pKa of His141 (pKa of 6.5) and Asp138 (pKa of 3.95) in MsDp2 by the PROPKA method (61). These predicted pKa values were found to be close to model pKa values of these amino acids. If the histidines at the pore lose their positive charge on the R group, the ionic cluster at the pore will be disrupted and now the pore environment will be akin to that of the mutant H126D/H141D. By positioning the MsDps2 pore cluster residues in the same conformation as that of this mutant showing maximum widening of the pore, we have arrived at a relaxed conformation of MsDps2 (Fig. 10, A and B). This “open” conformation allows for easier removal of iron from the protein and more access to chelators/reductants present in the solution in line with its bigger pore size.
FIGURE 10.
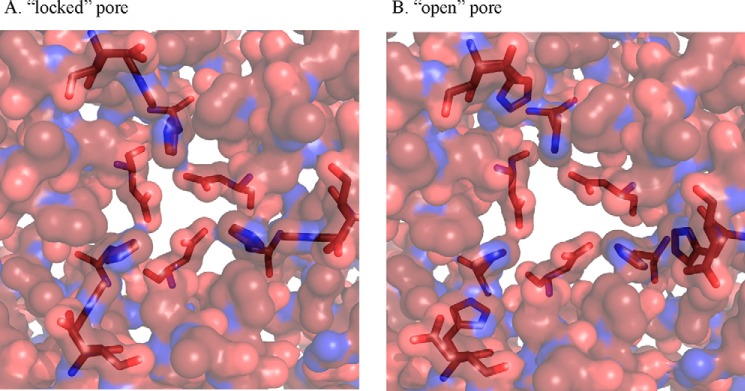
Model demonstrating the gating mechanism at the ferritin-like pore in MsDps2. Both figures are represented by their van der Waals radii. A shows the pore in its “closed” conformation. This is obtained from the MsDps2 PDB structure. B, the pore is in its open conformation. This was obtained by placing the MsDps2 gating residues in the side chain configurations exhibited by the H126D/H141D mutant, which showed the highest rate of iron release.
Understanding the gating mechanism of ions in Dps proteins has more than a biological significance. Natural proteins rival most synthetic molecules in their diversity, larger size, flexibility, and catalytic applications. Dps is a member of the ferritin superfamily, which includes multisubunit cage-like proteins with a hollow interior. These nano-compartments can be exploited to encapsulate nanoparticles (62, 63) or for building higher order assemblies (64, 65). Also, the surface of these nano-vehicles can be modified to target tissue systems in vivo, forming suitable carriers for drug delivery (66). An understanding of the residues important in loading and unloading processes in these systems is therefore important in employing these proteins as nano-delivery vehicles.
Acknowledgments
The data collection was carried out at The Facility for Protein X-ray Structure Determination and Protein Design, supported by the Department of Science and Technology (DST). We thank Sunita Prakash for help in acquiring the mass spectrometric data and the IISc-Bruker MS facilty where the experiments were carried out.
This work was supported in part by a grant from the Department of Biotechnology (DBT) infrastructure program for basic biological research.
- ESI
- electrospray ionization
- r.m.s. deviation
- root mean square deviation
- PSG
- protein structure graph
- PDB
- Protein Data Bank.
REFERENCES
- 1. Aisen P., Enns C., Wessling-Resnick M. (2001) Chemistry and biology of eukaryotic iron metabolism. Int. J. Biochem. Cell Biol. 33, 940–959 [DOI] [PubMed] [Google Scholar]
- 2. Benjamin J. A., Desnoyers G., Morissette A., Salvail H., Massé E. (2010) Dealing with oxidative stress and iron starvation in microorganisms: an overview. Can. J. Physiol. Pharmacol. 88, 264–272 [DOI] [PubMed] [Google Scholar]
- 3. Bevers L. E., Theil E. C. (2011) Maxi- and mini-ferritins: minerals and protein nanocages. Prog. Mol. Subcell. Biol. 52, 29–47 [DOI] [PMC free article] [PubMed] [Google Scholar]
- 4. Bozzi M., Mignogna G., Stefanini S., Barra D., Longhi C., Valenti P., Chiancone E. (1997) A novel non-heme iron-binding ferritin related to the DNA-binding proteins of the Dps family in Listeria innocua. J. Biol. Chem. 272, 3259–3265 [DOI] [PubMed] [Google Scholar]
- 5. Zhao G., Ceci P., Ilari A., Giangiacomo L., Laue T. M., Chiancone E., Chasteen N. D. (2002) Iron and hydrogen peroxide detoxification properties of DNA-binding protein from starved cells. A ferritin-like DNA-binding protein of Escherichia coli. J. Biol. Chem. 277, 27689–27696 [DOI] [PubMed] [Google Scholar]
- 6. Martinez A., Kolter R. (1997) Protection of DNA during oxidative stress by the nonspecific DNA-binding protein Dps. J. Bacteriol. 179, 5188–5194 [DOI] [PMC free article] [PubMed] [Google Scholar]
- 7. Kauko A., Haataja S., Pulliainen A. T., Finne J., Papageorgiou A. C. (2004) Crystal structure of Streptococcus suis Dps-like peroxide resistance protein Dpr: implications for iron incorporation. J. Mol. Biol. 338, 547–558 [DOI] [PubMed] [Google Scholar]
- 8. Ilari A., Stefanini S., Chiancone E., Tsernoglou D. (2000) The dodecameric ferritin from Listeria innocua contains a novel intersubunit iron-binding site. Nat. Struct. Biol. 7, 38–43 [DOI] [PubMed] [Google Scholar]
- 9. Ceci P., Ilari A., Falvo E., Chiancone E. (2003) The Dps protein of Agrobacterium tumefaciens does not bind to DNA but protects it toward oxidative cleavage: x-ray crystal structure, iron binding, and hydroxyl-radical scavenging properties. J. Biol. Chem. 278, 20319–20326 [DOI] [PubMed] [Google Scholar]
- 10. Chiancone E., Ceci P. (2010) The multifaceted capacity of Dps proteins to combat bacterial stress conditions: detoxification of iron and hydrogen peroxide and DNA binding. Biochim. Biophys. Acta 1800, 798–805 [DOI] [PubMed] [Google Scholar]
- 11. Choi S. H., Baumler D. J., Kaspar C. W. (2000) Contribution of dps to acid stress tolerance and oxidative stress tolerance in Escherichia coli O157:H7. Appl. Environ. Microbiol. 66, 3911–3916 [DOI] [PMC free article] [PubMed] [Google Scholar]
- 12. Nair S., Finkel S. E. (2004) Dps protects cells against multiple stresses during stationary phase. J. Bacteriol. 186, 4192–4198 [DOI] [PMC free article] [PubMed] [Google Scholar]
- 13. Brentjens R. J., Ketterer M., Apicella M. A., Spinola S. M. (1996) Fine tangled pili expressed by Haemophilus ducreyi are a novel class of pili. J. Bacteriol. 178, 808–816 [DOI] [PMC free article] [PubMed] [Google Scholar]
- 14. Thumiger A., Polenghi A., Papinutto E., Battistutta R., Montecucco C., Zanotti G. (2006) Crystal structure of antigen TpF1 from Treponema pallidum. Proteins 62, 827–830 [DOI] [PubMed] [Google Scholar]
- 15. Zanotti G., Papinutto E., Dundon W., Battistutta R., Seveso M., Giudice G., Rappuoli R., Montecucco C. (2002) Structure of the neutrophil-activating protein from Helicobacter pylori. J. Mol. Biol. 323, 125–130 [DOI] [PubMed] [Google Scholar]
- 16. Li X., Pal U., Ramamoorthi N., Liu X., Desrosiers D. C., Eggers C. H., Anderson J. F., Radolf J. D., Fikrig E. (2007) The Lyme disease agent Borrelia burgdorferi requires BB0690, a Dps homologue, to persist within ticks. Mol. Microbiol. 63, 694–710 [DOI] [PubMed] [Google Scholar]
- 17. Nicodème M., Perrin C., Hols P., Bracquart P., Gaillard J. L. (2004) Identification of an iron-binding protein of the Dps family expressed by Streptococcus thermophilus. Curr. Microbiol. 48, 51–56 [DOI] [PubMed] [Google Scholar]
- 18. Papinutto E., Dundon W. G., Pitulis N., Battistutta R., Montecucco C., Zanotti G. (2002) Structure of two iron-binding proteins from Bacillus anthracis. J. Biol. Chem. 277, 15093–15098 [DOI] [PubMed] [Google Scholar]
- 19. Liu X., Kim K., Leighton T., Theil E. C. (2006) Paired Bacillus anthracis Dps (mini-ferritin) have different reactivities with peroxide. J. Biol. Chem. 281, 27827–27835 [DOI] [PubMed] [Google Scholar]
- 20. Kim S. G., Bhattacharyya G., Grove A., Lee Y. H. (2006) Crystal structure of Dps-1, a functionally distinct Dps protein from Deinococcus radiodurans. J. Mol. Biol. 361, 105–114 [DOI] [PubMed] [Google Scholar]
- 21. Cuypers M. G., Mitchell E. P., Romão C. V., McSweeney S. M. (2007) The crystal structure of the Dps2 from Deinococcus radiodurans reveals an unusual pore profile with a non-specific metal binding site. J. Mol. Biol. 371, 787–799 [DOI] [PubMed] [Google Scholar]
- 22. Gupta S., Pandit S. B., Srinivasan N., Chatterji D. (2002) Proteomics analysis of carbon-starved Mycobacterium smegmatis: induction of Dps-like protein. Protein Eng. 15, 503–512 [DOI] [PubMed] [Google Scholar]
- 23. Roy S., Saraswathi R., Chatterji D., Vijayan M. (2008) Structural studies on the second Mycobacterium smegmatis Dps: invariant and variable features of structure, assembly and function. J. Mol. Biol. 375, 948–959 [DOI] [PubMed] [Google Scholar]
- 24. Chowdhury R. P., Gupta S., Chatterji D. (2007) Identification and characterization of the dps promoter of Mycobacterium smegmatis: promoter recognition by stress-specific extracytoplasmic function σ factors σH and σF. J. Bacteriol. 189, 8973–8981 [DOI] [PMC free article] [PubMed] [Google Scholar]
- 25. Ghatak P., Karmakar K., Kasetty S., Chatterji D. (2011) Unveiling the role of Dps in the organization of mycobacterial nucleoid. PLoS One 6, e16019. [DOI] [PMC free article] [PubMed] [Google Scholar]
- 26. Takagi H., Shi D., Ha Y., Allewell N. M., Theil E. C. (1998) Localized unfolding at the junction of three ferritin subunits. A mechanism for iron release? J. Biol. Chem. 273, 18685–18688 [DOI] [PubMed] [Google Scholar]
- 27. Tosha T., Behera R. K., Ng H. L., Bhattasali O., Alber T., Theil E. C. (2012) Ferritin protein nanocage ion channels: gating by N-terminal extensions. J. Biol. Chem. 287, 13016–13025 [DOI] [PMC free article] [PubMed] [Google Scholar]
- 28. Bellapadrona G., Stefanini S., Zamparelli C., Theil E. C., Chiancone E. (2009) Iron translocation into and out of Listeria innocua Dps and size distribution of the protein-enclosed nanomineral are modulated by the electrostatic gradient at the 3-fold “ferritin-like” pores. J. Biol. Chem. 284, 19101–19109 [DOI] [PMC free article] [PubMed] [Google Scholar]
- 29. Pulliainen A. T., Kauko A., Haataja S., Papageorgiou A. C., Finne J. (2005) Dps/Dpr ferritin-like protein: insights into the mechanism of iron incorporation and evidence for a central role in cellular iron homeostasis in Streptococcus suis. Mol. Microbiol. 57, 1086–1100 [DOI] [PubMed] [Google Scholar]
- 30. Ceci P., Di Cecca G., Falconi M., Oteri F., Zamparelli C., Chiancone E. (2011) Effect of the charge distribution along the “ferritin-like” pores of the proteins from the Dps family on the iron incorporation process. J. Biol. Inorg. Chem. 16, 869–880 [DOI] [PubMed] [Google Scholar]
- 31. Douglas T., Ripoll D. R. (1998) Calculated electrostatic gradients in recombinant human H-chain ferritin. Protein Sci. 7, 1083–1091 [DOI] [PMC free article] [PubMed] [Google Scholar]
- 32. Chowdhury R. P., Vijayabaskar M. S., Vishveshwara S., Chatterji D. (2008) Molecular mechanism of in vitro oligomerization of Dps from Mycobacterium smegmatis: mutations of the residues identified by “interface cluster” analysis. Biochemistry 47, 11110–11117 [DOI] [PubMed] [Google Scholar]
- 33. Kannan N., Chander P., Ghosh P., Vishveshwara S., Chatterji D. (2001) Stabilizing interactions in the dimer interface of α-subunit in Escherichia coli RNA polymerase: a graph spectral and point mutation study. Protein Sci. 10, 46–54 [DOI] [PMC free article] [PubMed] [Google Scholar]
- 34. Kannan N., Vishveshwara S. (1999) Identification of side-chain clusters in protein structures by a graph spectral method. J. Mol. Biol. 292, 441–464 [DOI] [PubMed] [Google Scholar]
- 35. Bradford M. M. (1976) A rapid and sensitive method for the quantitation of microgram quantities of protein utilizing the principle of protein-dye binding. Anal. Biochem. 72, 248–254 [DOI] [PubMed] [Google Scholar]
- 36. Simonian M. H. (2002) Spectrophotometric determination of protein concentration. Curr. Protoc. Cell Biol. 15, A.3B.1–A.3B.7 [DOI] [PubMed] [Google Scholar]
- 37. Sabareesh V., Sarkar P., Sardesai A. A., Chatterji D. (2010) Identifying N60D mutation in omega subunit of Escherichia coli RNA polymerase by bottom-up proteomic approach. Analyst 135, 2723–2729 [DOI] [PubMed] [Google Scholar]
- 38. Saraswathi R., Pait Chowdhury R., Williams S. M., Ghatak P., Chatterji D. (2009) The Mycobacterial MsDps2 protein is a nucleoid-forming DNA binding protein regulated by sigma factors σA and σB. PLoS One 4, e8017. [DOI] [PMC free article] [PubMed] [Google Scholar]
- 39. Lillie R. D., Donaldson P. T. (1974) The mechanism of the ferric ferricyanide reduction reaction. Histochem. J. 6, 679–684 [DOI] [PubMed] [Google Scholar]
- 40. Leong L. M., Tan B. H., Ho K. K. (1992) A specific stain for the detection of nonheme iron proteins in polyacrylamide gels. Anal. Biochem. 207, 317–320 [DOI] [PubMed] [Google Scholar]
- 41. Collaborative Computational Project (1994) The CCP4 suite: programs for protein crystallography. Acta Crystallogr. D. Biol. Crystallogr. 50, 760–763 [DOI] [PubMed] [Google Scholar]
- 42. Leslie A. G. (2006) The integration of macromolecular diffraction data. Acta Crystallogr. D Biol. Crystallogr. 62, 48–57 [DOI] [PubMed] [Google Scholar]
- 43. French S., Wilson K. (1978) On the treatment of negative intensity observations. Acta Crystallogr. A 34, 517–525 [Google Scholar]
- 44. Murshudov G. N., Vagin A. A., Dodson E. J. (1997) Refinement of macromolecular structures by the maximum-likelihood method. Acta Crystallogr. D Biol. Crystallogr. 53, 240–255 [DOI] [PubMed] [Google Scholar]
- 45. Emsley P., Cowtan K. (2004) Coot: model-building tools for molecular graphics. Acta Crystallogr. D Biol. Crystallogr. 60, 2126–2132 [DOI] [PubMed] [Google Scholar]
- 46. Laskowski R. A., Moss D. S., Thornton J. M. (1993) Main-chain bond lengths and bond angles in protein structures. J. Mol. Biol. 231, 1049–1067 [DOI] [PubMed] [Google Scholar]
- 47. Cohen G. H. (1997) ALIGN: a program to superimpose protein coordinates, accounting for insertions and deletions. J. Appl. Crystallogr. 30, 1160–1161 [Google Scholar]
- 48. Delano W. (2002) PyMol Molecular Graphics System, Schroedinger, LLC, New York [Google Scholar]
- 49. Tina K. G., Bhadra R., Srinivasan N. (2007) PIC: Protein Interactions Calculator. Nucleic Acids Res. 35, W473–476 [DOI] [PMC free article] [PubMed] [Google Scholar]
- 50. Dezso Z., Barabási A. L. (2002) Halting viruses in scale-free networks. Phys. Rev. E Stat. Nonlin. Soft Matter Phys. 65, 055103 [DOI] [PubMed] [Google Scholar]
- 51. Konagurthu A. S., Reboul C. F., Schmidberger J. W., Irving J. A., Lesk A. M., Stuckey P. J., Whisstock J. C., Buckle A. M. (2010) MUSTANG-MR structural sieving server: applications in protein structural analysis and crystallography. PLoS One 5, e10048. [DOI] [PMC free article] [PubMed] [Google Scholar]
- 52. Yamamoto Y., Poole L. B., Hantgan R. R., Kamio Y. (2002) An iron-binding protein, Dpr, from Streptococcus mutans prevents iron-dependent hydroxyl radical formation in vitro. J. Bacteriol. 184, 2931–2939 [DOI] [PMC free article] [PubMed] [Google Scholar]
- 53. Lewin A., Moore G. R., Le Brun N. E. (2005) Formation of protein-coated iron minerals. Dalton Trans. 22, 3597–3610 [DOI] [PubMed] [Google Scholar]
- 54. Ilari A., Ceci P., Ferrari D., Rossi G. L., Chiancone E. (2002) Iron incorporation into Escherichia coli Dps gives rise to a ferritin-like microcrystalline core. J. Biol. Chem. 277, 37619–37623 [DOI] [PubMed] [Google Scholar]
- 55. Gupta S., Chatterji D. (2003) Bimodal protection of DNA by Mycobacterium smegmatis DNA-binding protein from stationary phase cells. J. Biol. Chem. 278, 5235–5241 [DOI] [PubMed] [Google Scholar]
- 56. Jolley C. C., Douglas T. (2010) Ion accumulation in a protein nanocage: finding noisy temporal sequences using a genetic algorithm. Biophys. J. 99, 3385–3393 [DOI] [PMC free article] [PubMed] [Google Scholar]
- 57. Liu X., Jin W., Theil E. C. (2003) Opening protein pores with chaotropes enhances Fe reduction and chelation of Fe from the ferritin biomineral. Proc. Natl. Acad. Sci. U.S.A. 100, 3653–3658 [DOI] [PMC free article] [PubMed] [Google Scholar]
- 58. Jin W., Takagi H., Pancorbo B., Theil E. C. (2001) “Opening” the ferritin pore for iron release by mutation of conserved amino acids at interhelix and loop sites. Biochemistry 40, 7525–7532 [DOI] [PubMed] [Google Scholar]
- 59. Jones T., Spencer R., Walsh C. (1978) Mechanism and kinetics of iron release from ferritin by dihydroflavins and dihydroflavin analogues. Biochemistry 17, 4011–4017 [DOI] [PubMed] [Google Scholar]
- 60. Watt G. D., Jacobs D., Frankel R. B. (1988) Redox reactivity of bacterial and mammalian ferritin: is reductant entry into the ferritin interior a necessary step for iron release? Proc. Natl. Acad. Sci. U.S.A. 85, 7457–7461 [DOI] [PMC free article] [PubMed] [Google Scholar]
- 61. Rostkowski M., Olsson M. H., Søndergaard C. R., Jensen J. H. (2011) Graphical analysis of pH-dependent properties of proteins predicted using PROPKA. BMC Struct. Biol. 11, 6. [DOI] [PMC free article] [PubMed] [Google Scholar]
- 62. Swift J., Wehbi W. A., Kelly B. D., Stowell X. F., Saven J. G., Dmochowski I. J. (2006) Design of functional ferritin-like proteins with hydrophobic cavities. J. Am. Chem. Soc. 128, 6611–6619 [DOI] [PubMed] [Google Scholar]
- 63. Yoshimura H. (2006) Protein-assisted nanoparticle synthesis. Colloids and Surfaces A: Physicochemical and Engineering Aspects 282–283, 464–470 [Google Scholar]
- 64. Jeong G.-H., Yamazaki A., Suzuki S., Yoshimura H., Kobayashi Y., Homma Y. (2007) Production of single-walled carbon nanotubes with narrow diameter distribution using iron nanoparticles derived from DNA-binding proteins from starved cells. Carbon 45, 978–983 [Google Scholar]
- 65. Kim H.-J., Oh E., Lee J., Shim D.-S., Lee K.-H. (2011) Synthesis of carbon nanotubes with catalytic iron-containing proteins. Carbon 49, 3717–3722 [Google Scholar]
- 66. Uchida M., Flenniken M. L., Allen M., Willits D. A., Crowley B. E., Brumfield S., Willis A. F., Jackiw L., Jutila M., Young M. J., Douglas T. (2006) Targeting of cancer cells with ferrimagnetic ferritin cage nanoparticles. J. Am. Chem. Soc. 128, 16626–16633 [DOI] [PubMed] [Google Scholar]