

Background: β-Amyloid aggregates are at the basis of Alzheimer disease development. Short synthetic peptides are seen to inhibit polymerization.
Results: Various synthetic peptides have been studied by MD simulations and tested experimentally.
Conclusion: Combined results indicate Ac-LPFFN-NH2 as an effective lead compound able to slow down Aβ1–40 aggregation.
Significance: Designing potential Aβ aggregation inhibitors will help fight Alzheimer disease.
Keywords: Alzheimer Disease, Fluorescence, Mass Spectrometry (MS), Molecular Dynamics, Protein Misfolding, Amyloid β Peptide, β-Sheet Breakers
Abstract
In this work we present and compare the results of extensive molecular dynamics simulations of model systems comprising an Aβ1–40 peptide in water in interaction with short peptides (β-sheet breakers) mimicking the 17–21 region of the Aβ1–40 sequence. Various systems differing in the customized β-sheet breaker structure have been studied. Specifically we have considered three kinds of β-sheet breakers, namely Ac-LPFFD-NH2 and two variants thereof, one obtained by substituting the acetyl group with the sulfonic amino acid taurine (Tau-LPFFD-NH2) and a second novel one in which the aspartic acid is substituted by an asparagine (Ac-LPFFN-NH2). Thioflavin T fluorescence, circular dichroism, and mass spectrometry experiments have been performed indicating that β-sheet breakers are able to inhibit in vitro fibril formation and prevent the β sheet folding of portions of the Aβ1–40 peptide. We show that molecular dynamics simulations and far UV circular dichroism provide consistent evidence that the new Ac-LPFFN-NH2 β-sheet breaker is more effective than the other two in stabilizing the native α-helix structure of Aβ1–40. In agreement with these results thioflavin T fluorescence experiments confirm the higher efficiency in inhibiting Aβ1–40 aggregation. Furthermore, mass spectrometry data and molecular dynamics simulations consistently identified the 17–21 Aβ1–40 portion as the location of the interaction region between peptide and the Ac-LPFFN-NH2 β-sheet breaker.
Introduction
Alzheimer disease belongs to a class of pathologies, generically known as amyloidoses, whose common feature is the switching of endogenous proteins or peptides from their physiological soluble configuration to a pathological fibrillar insoluble state (1, 2). The main proteinaceous component of amyloid deposition, detected in Alzheimer disease patient brains, is the so-called amyloid β peptide (Aβ),2 normally from 39 to 43 amino acids long, that is produced by the cleavage of the amyloid precursor protein (APP).
The Aβ self-association process that appears to be responsible for amyloidogenesis and highly toxic fibril formation is preceded by a conformational modification in which the peptide partially loses its random coil or α-helical native structure that is locally replaced by a β-sheet structure (3–5).
The observation that short synthetic peptides called β-sheet breaker peptides (BSBps) are able to establish a direct interaction with soluble oligomers or amyloid aggregates, destabilizing the amyloidogenic conformer and thus precluding amyloid polymerization (6), was at the origin of a significant scientific effort with the ultimate hope of arriving at the development of an effective pharmacological strategy (7, 8).
The main idea driving these investigations is that fibril formation could be strongly suppressed if the residues belonging to the hydrophobic central region of the Aβ1–40 sequence could interact with short peptides (9). This line of research was actively pursued by the Soto and co-workers (10). These authors have studied the effect of Ac-LPFFD-NH2 (also known in the literature as iAβ5p) on the Aβ aggregation process. The Ac-LPFFD-NH2 (customized with N- and C-terminal protections) specifically differs from the 17–21 (LVFFA) Aβ1–40 fragment by having valine and alanine residues substituted by a proline and an aspartic acid residue, respectively. iAβ5p has been shown to possess a number of promising properties like the ability of crossing the blood-brain barrier and inhibiting (and disassembling) the formation of amyloid fibrils in vitro as well as in vivo. It has also been shown to prevent Aβ neurotoxicity in cell culture by blocking amyloid deposition and inducing dissolution of preformed plaques in amyloidosis rat brain models (11–13).
Recently Giordano et al. (14, 15) reported new iAβ5p analogues with several chemical modifications introduced to improve BSBps activity and metabolic stability. In particular the taurine customized Tau-LPFFD-NH2 peptide turned out to better bind Aβ1–40 and to be more resistant to proteolysis.
To gain some insight in the effectiveness of such chemical modifications, it is necessary to understand at an atomistic level the nature of the interaction between Aβ1–40 and different types of BSBps. With the purpose of establishing what determines the BSBp-specific chemical activity, we performed extensive classical molecular dynamics (MD) simulations on model systems where Aβ1–40 in water is in interaction with different BSBps, specifically Ac-LPFFD-NH2, Tau-LPFFD-NH2, and the newly proposed Ac-LPFFN-NH2.
MD simulations represent a powerful tool in the study of many interesting biological systems as they provide a description of the system physicochemical properties in terms of microscopic degrees of freedom. In particular MD simulations (classical (16), density functional theory (DFT) (17, 18), quantum mechanical (19)) have been largely employed in the study of proteins with the purpose of investigating their folding properties and, more recently, in the emerging field of metalloproteins and protein-metal interactions (20, 21). In the case of the Aβ peptide, MD results have been employed not only to guide experiments but have also been instrumental in designing potential Aβ aggregation inhibitors (22).
A key strategic feature of this work was to combine theoretical information from MD simulations with experimental results coming from a number of complementary techniques, such as thioflavin T (ThT) fluorescence, far UV circular dichroism (CD), and electrospray ionization mass spectrometry (ESI-MS). From this comparison it emerges that, among the three different kinds of BSBps we have studied and simulated, Ac-LPFFN-NH2 appears to be the most efficient BSBp in slowing down and possibly preventing Aβ1–40 aggregation. We regard this conclusion as an important result that encourages the use of MD simulations as a valuable tool for selecting potential lead compounds against fibril formation.
MATERIALS AND METHODS
We start by discussing the computational methods employed to perform classical MD simulations of systems made by one Aβ1–40 in water in interactions with different BSBps. In the next subsections we will describe the experimental techniques we have set up to check the results of the theoretical investigations.
Computational Methods
We have performed extensive classical MD simulations of four different model systems. Three of them are prepared by dissolving in water 1 Aβ1–40 and 10 copies of the 3 different BSBps we have considered, namely Ac-LPFFD-NH2 and two variants of it, one obtained by substituting the acetyl group with taurine (Tau-LPFFD-NH2) and the second by substituting the aspartic acid with an asparagine (Ac-LPFFN-NH2). For comparison, a fourth model system with Aβ1–40 in water in the absence of BSBps is simulated. We list in Table 1 the detailed chemical composition of the four systems we have studied with the nicknames we will be using all along the paper.
TABLE 1.
Simulated systems: nicknames (left column); simulated systems composition (right column)
| System name | Composition |
|---|---|
| abeta | Aβ1–40 + 3 Na++ water |
| lpffd | Aβ1–40 + 10 Ac-LPFFD-NH2 + 3 Na++ water |
| taulpffd | Aβ1–40 + 10 Tau-LPFFD-NH2 + 3 Na++ water |
| lpffn | Aβ1–40 + 10 Ac-LPFFN-NH2 + 3 Na++ water |
The Aβ1–40 configuration that is used as a starting point in all the simulations is taken from the NMR structure of Crescenzi et al. (Ref. 23; Protein Data Bank ID 1IYT). It displays 2 α-helix regions (residues from 8–25 and residues 28–38) linked by a turn region (residues 26–27).
In each one of the three systems, the 10 copies of BSBps are initially inserted in an all-trans configuration. Their position and orientation are randomly chosen but are kept the same in the three systems. The simulation box is filled with a number of water molecules so as to have an ∼400 mm Aβ1–40 concentration. An appropriate number of Na+ counter-ions is also added to have globally neutral systems.
Classical MD simulations are performed using the GROMACS package (24–27) with the inclusion of the GROMOS53A6 force field (28). The non-standard taurine force field is computed by using the Automated Topology Builder and Repository (29) and implemented within the GROMOS53A6 force field. Simulations are performed at neutral pH3 in the NpT-ensemble. The temperature is kept constant (and equal to 300 K) by using the v-rescale thermostat (30) with a 0.1-ps coupling time. Pressure is kept constant at 1 bar by using the Berendsen barostat (31) with a 1-ps coupling time and an isothermal compressibility of 4.5 × 10⁻⁵ bar−1. The single point charge (SPC) model is used for water molecules. Periodic boundary conditions are imposed to the system, and the Particle Mesh Ewald algorithm is employed in dealing with the long-range Coulomb interactions (32). The MD integration time step is 2 fs. A non-bond pair list (with a 1.4-nm cutoff) is updated every 10 steps. For each system in the study we collected trajectories as long as 80 ns.
The simulation strategy we used, identical in all the four cases, is the following. First of all, each system was relaxed in a vacuum via a steepest descent minimization. Then, after the appropriate number of counter-ions and water molecules was added, the solvent was relaxed by a few steps (10 ps) of NVT MD at 200 K leaving the solute untouched. At this point the whole system, solute and solvent, was equilibrated as a whole for 50 ps in the NVT ensemble at 300 K, and the final 80-ns-long NpT MD simulation at 300 K was started. To eliminate from the analysis possible unphysical transients due to lack of equilibration, only the last 50 ns were employed to extract structural information on the simulated systems. The analysis of MD trajectories was carried out by using both standard GROMACS tools as well as some expressly designed homemade codes.
Experimental Methods
Peptide Synthesis
Aβ1–40 was purchased from the PolyPeptide Laboratories France SAS. The Aβ17–21 and Aβ25–35 fragments are synthesized by conventional solid phase chemistry (33) starting from Fmoc-Ala- and Fmoc-Met-Wang resin (150- mmol scale, 250 mg), respectively. Ac-LPFFD-NH2, Ac-LPFFN-NH2, and Tau-LPFFD-NH2 peptides are synthesized on Rink amide resin (65-mmol scale, 100 mg). Fmoc-amino acids-OH (Fmoc-AA-OH), diisopropylcarbodiimide (DIC), and hydroxybenzotriazole (HOBt) (3 eq, respectively) in N-methyl-2-pyrrolidinone are used for couplings. The Fmoc-taurylsulfonyl chloride, required for the preparation of the Tau-containing derivative, was prepared according to Liskamp and co-workers (34) and coupled to the resin-bound protected pentapeptide in dichloromethane in the presence of 4-methylmorpholine (7 eq). The coupling mixture was shaken overnight. After cleavage, the crude peptides were purified by reverse phase-HPLC on a Waters 600E liquid chromatography system by using a Waters Bondapac C-18 column (1.9 × 30 cm, 5 μm, 300 Å) for semi-preparative scale with elution at 8 ml/min by a linear gradient of 10–60% acetonitrile in 0.1% aqueous trifluoroacetic acid in 30 min. Peptide purity is >97% by analytical HPLC (Waters μ-Bondapack C-18 column, 0.39 × 30 cm, 5 μm, 300 Å). The peptides were characterized on a Q-TOF MICRO spectrometer (Micromass, now Waters, Manchester, UK) equipped with an ESI source, in the positive ion mode, and data were analyzed using the MassLynx software (Waters). In Table 2 we compared the theoretical expected numbers with the values of m/z for the [M+H]+molecular ions associated to the Aβ17–21, Aβ25–35, Ac-LPFFD-NH2, Tau-LPFFD-NH2, and Ac-LPFFN-NH2 peptides.
TABLE 2.
m/z experimental and theoretical values of Aβ17–21, Aβ25–35, and BSBps
| Peptide fragments | Molecular formula |
m/z for [M+H]+ |
|
|---|---|---|---|
| Theoretical | Observed | ||
| Aβ17–21 | C32H45N5O6 | 596.3448 | 596.3497 |
| Aβ25–35 | C45H81N13O14S | 1060.5824 | 1060.5815 |
| Ac-LPFFD-NH2 | C35H46N6O8 | 679.3455 | 679.3429 |
| Tau-LPFFD-NH2 | C35H49N7O9S | 744.3391 | 744.3379 |
| Ac-LPFFN-NH2 | C35H47N7O7 | 678.3615 | 678.3658 |
ThT Binding Assay
Aβ1–40 aggregation was studied using a ThT binding assay (35). ThT fluorescence intensity was followed continuously in a PerkinElmer Life Sciences LS 50 B spectrofluorimeter thermostated at 293 K with excitation and emission wavelengths set at 450 and 484 nm, respectively. Fluorescence changes were monitored in a 1-ml cuvette under continuous stirring at 484 nm every 6 s with 5-s integration times over at least 3000 min. 1 mm ThT stock solution in water was prepared, aliquoted, and stored at 253 K. Before each experiment, an aliquot of ThT stock solution was thawed at 277 K shielded from light. A solution of 16.0 μm lyophilized Aβ1–40 in 20 mm Tris-HCl, pH 7.4 (1 ml final volume), alone or in the presence of a 12 m excess Ac-LPFFD-NH2 or Ac-LPFFN-NH2, was transferred to a 1-ml cuvette, and 10 μl of 1 mm ThT was added. Dead time for measurements of fluorescence changes did not exceed 12 s. In the absence of Aβ1–40, intensity at 484 nm of ThT alone was identical to that measured in the presence of any of the tested BSBps and did not change over 3000 min (data not shown).
Far UV CD Spectroscopy
Far UV CD (190–250 nm) measurements were performed with a Jasco J-720 spectropolarimeter in a 0.1-cm path length quartz cuvette thermostated at 293 K. The results are expressed in terms of the mean residue ellipticity [ϴ] assuming a mean residue weight of 110 daltons per amino acid residue. Ac-LPFFD-NH2 or Ac-LPFFN-NH2 were dissolved in ultra high quality water, lyophilized, and stored at 253 K. For far UV CD spectral measurements, each lyophilized compound was dissolved in ultra high quality water. Aliquots of lyophilized Aβ1–40 were dissolved in 20 mm Tris-HCl, pH 7.4, at 16.0 μm final concentration in the absence or presence of a 12 m excess of BSBp, and the far UV CD spectral changes, occurring upon fibril formation, were monitored at 293 K at increasing times from 0 to 50 h. The far UV CD spectra of Ac-LPFFD-NH2 or Ac-LPFFN-NH2 monitored from 0 to 50 h did not show any change as a function of time. Far UV CD spectra of Aβ1–40 in the presence or in the absence of BSBps were analyzed by singular value decomposition (36–38) using the MATLAB (MathWorks, South Natick, MA) software.
Mass Spectrometry
All the mass spectrometry experiments were performed on a Q-TOF MICRO spectrometer (Waters) equipped with an ESI source in the positive ion mode, adjusting the operating parameters as follows: rate of sample infusion into the mass spectrometer 20 μl/min, capillary voltage 2.8 kV, source temperature 353 K, source pressure 1.30 mbar, cone voltage 35 V, collision energy 10 eV. Full scan MS spectra were recorded in the m/z range between 800 and 2500, with 100 acquisitions per spectrum. Data were analyzed using the MassLynx software developed by Waters. Aβ1–40 spectra were obtained from samples dissolved in water at a 50 μm final concentration and pH 3.5. After the binding equilibrium was established, methanol (20% v/v) was added to the mixture just before injection to obtain a stable electrospray signal. The final volume of the sample was 200 μl. As a reference, a sample containing only Aβ1–40 was prepared. The spectra of the 17–21 and 25–35 fragments were also taken in the same conditions except that a neutral pH was used. To minimize statistical errors, each experiment was repeated at least three times under the same experimental conditions.
RESULTS AND DISCUSSION
Computational Results
To identify the specific Aβ1–40-BSBps structural features arising in the different physicochemical situations we have studied, we have found it useful to look at the evolution with the MD simulation time of a number of geometrical indicators and chemical properties.
Configuration Distance Indicator
Detailed and direct information on the time evolution of the Aβ1–40 configuration can be extracted from the study of the root mean square displacement, r.m.s.d., evolution defined by the formula
 |
where N is the number of selected (see after) atoms of Aβ1–40, whose displacement with respect to the initial (t = t0) configuration we wish to compute. As a reference configuration we take the initial Protein Data Bank Aβ1–40 peptide structure, where the peptide is in a fully α-helix secondary structure. The coordinates {ri(t); i = 1, …, N} in Equation 1 were obtained after minimizing r.m.s.d.(t) over the rigid roto-translations of the current atomic configuration. r.m.s.d. was computed with the help of the g_rms (39) GROMACS tool.
In Fig. 1 the time behavior (from 30 ns on) of the r.m.s.d. of the Aβ1–40 backbone atoms is displayed. For completeness, in the right panel of Fig. 1 we show the whole evolution where the transient phase is also visible.
FIGURE 1.
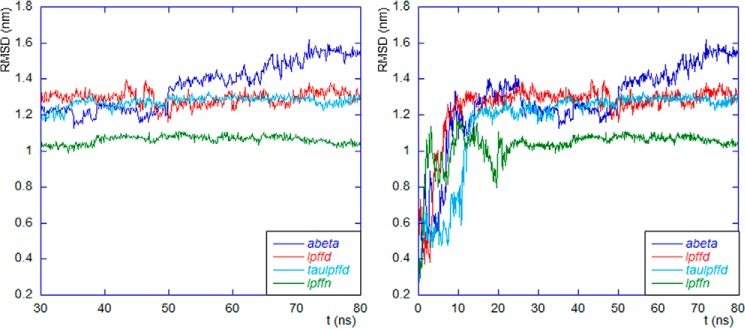
Left panel, the last 50 ns of the r.m.s.d. time evolution of all systems are shown. The Protein Data Bank structure is taken as reference configuration. The sum in Equation 1 is restricted to the Aβ1–40 backbone atoms. Right panel, the full r.m.s.d. evolution where the initial time transient is also visible. Color code (see Table 1) is blue for Aβ; red for lpffd, light blue for taulpffd, and green for lpffn.
We note that Aβ1–40 in the lpffn system (green curve) shows the lowest values of r.m.s.d. This finding confirms that the Aβ1–40 backbone undergoes the smallest structural change when in the presence of Ac-LPFFN-NH2.
It is interesting to note that around 50 ns the r.m.s.d. of Aβ1–40 in the abeta system suddenly jumps to a higher value that remains the highest till the end of our simulation. The r.m.s.d. jump occurs in coincidence with the appearance of a short β-sheet strand (see panel a of Fig. 2). Taken together, the two results suggest that the intramolecular β-sheet forms at the expense of a quite dramatic change of the global Aβ1–40 configuration. Such a change was not observed when, as shown in panels b and c of Fig. 2, an intermolecular β-sheet formed between Aβ1–40 and one of the BSBps in the lpffd and taulpffd systems or when an intermolecular β-sheet was formed between two BSBps, as happens in the case of the lpffn system (see panel d of Fig. 2). As will be confirmed under “Secondary Structure Analysis” below, this short β-sheet strand is located in front of the conserved 17–21 Aβ1–40α-helix segment.
FIGURE 2.
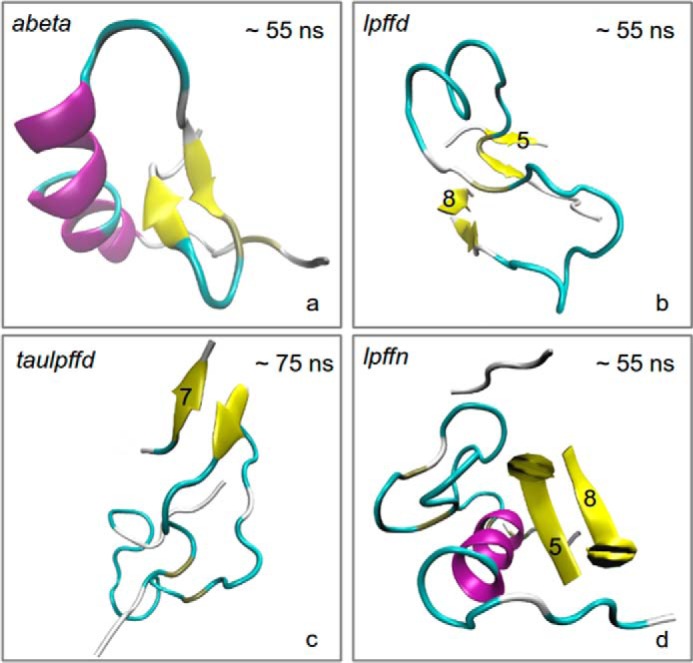
For each one of the four simulated systems (see Table 1) a representative structural configuration (as defined by the g_cluster GROMACS tool) is drawn. The time intervals where these structures were taken were selected among those within which a stable β-sheet structure was visible. These are 50–60 ns for systems abeta (a), lpffd (b), and lpffn (d) and 70–80 ns for the taulpffd system (c). The numbers in panels b–d identify the BSBps lying nearer to Aβ1–40 (see also Fig. 4).
Residue Mobility
The residue mobility, σR, of each amino acid along the sequence can be computed from the formula,
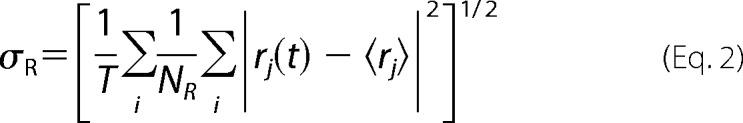 |
where T is the time length of the MD trajectory (here the last 50 ns), {rj(t); i = 1, …, NR} are the positions of the NR atoms belonging to the residue R at time t, and 〈rj〉 is the average position of each residue atom along the trajectory. The residue mobility was computed making use of the g_rmsf GROMACS tool.
In Fig. 3, σR was plotted against the residue position along Aβ1–40 sequence. The color code used for the four panels is the same as in Fig. 1. It is pretty clear that the abeta system shows the highest σR values all along the sequence. In other words, one can say that Aβ1–40 residue mobility is always reduced by the presence of any of the three BSBps. In this respect, again the most effective BSBp seems to be Ac-LPFFN-NH2.
FIGURE 3.

Mobility of Aβ1–40 residues,σR (see Equation 2), is plotted against the residue number. The color code is as in Fig. 1.
BSBp Docking
An important related structural question is where along the Aβ1–40 sequence BSBps preferentially come in interaction with the peptide. In many existing numerical studies (40) simulations are started from configurations where BSBps, or other similar molecules, are located in the vicinity of preassigned peptide segments. In view of the strong biasing effect that such an a priori decision can have on simulation results, it is of the highest importance to examine the reliability of this strategy.
Thanks to the fact that we started our MD trajectories from configurations where BSBps are randomly distributed within the simulation box, we are able to check whether there are preferred docking regions for BSBps along Aβ1–40 sequence in an unbiased way.
To this end we have monitored the time evolution of the distance from Aβ1–40 of each of the 10 BSBps in the three-model systems, lpffd, taulpffd, and lpffn. We constructed plots (see Fig. 4) where for each 1 of the 10 BSBps a dot is drawn if its center of mass is within 8 Å from anyone of the Aβ1–40 backbone atoms. In these plots the whole 80 ns trajectory is displayed. From the 3 panels of Fig. 4 one concludes that, although the 10 BSBps in each model system start from the same position, those that come closer to the peptide are not always the same. Thus in the lpffd model system BSBps 5 and 8 come in contact with Aβ1–40, and in the taulpffd system it is the BSBp 7 that after about 15 ns get stuck to the peptide, whereas in the case of lpffn the dynamics situation was more varied, but after a transient phase, the BSBps that finally come stably closer to the peptide are 1 5, and, for a long fraction of the simulation time, also 8 and 9.
FIGURE 4.
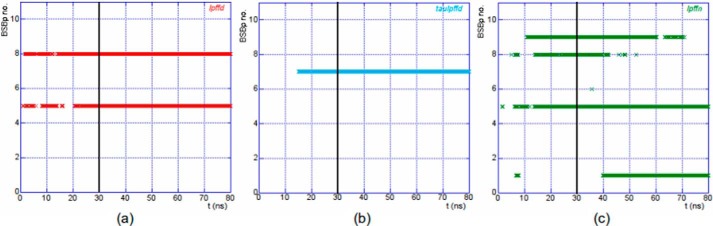
BSBps lying within 8 Å from the Aβ1–40 backbone are plotted as a function of simulation time. The black vertical line marks the time t = 30 ns. The color code is as in Fig. 1.
Another important information is where the BSBp docking region along the peptide sequence is located. We can extract this information by monitoring the Aβ1–40 residues to which the BSBps in the various systems tend to come closer. In the six panels of Fig. 5 we display as a function of time the residues to which BSBps lie within 8 Å from the peptide. It is interesting to remark that, although the docking region is not always the same, in all the three model systems (lpffd, taulpffd, and lpffn) the region 25–35 (i.e. the Aβ1–40 most hydrophobic region) was always capable of attracting one of the BSBps. A reassuring conclusion from all the above analysis is that the initial BSBp configuration has little biasing effect on the long-time history of the system.
FIGURE 5.

Aβ1–40 residues within 8 Å from the BSBps are displayed in Fig. 4, plotted as a function of simulation time. In the panels we report data for the whole 80-ns MD trajectory. The black vertical line marks the time t = 30 ns. The color code is as in Fig. 1.
Secondary Structure Analysis
Using the standard protocol for the Definition of Secondary Structure of Proteins (DSSP) proposed by Kabsch and Sander (41), we plot in Fig. 6 the fraction of residues in different secondary structures (α-helix, coil, β-sheet, β-bridge, bend, turn, 5-helix, 3-helix) as a function of simulation time (the last 50 ns are shown).
FIGURE 6.

Aβ1–40 secondary structure time evolution (last 50 ns) in the four simulated systems. In the vertical axis we plot the amino acid number along the Aβ1–40 sequence. The color code of secondary structures is as follows: white for coil, red for β-sheet, black for β-bridge, green for bend, yellow for turn, blue for α-helix, purple for 5-helix, and gray for 3-helix structure.
The interesting pattern emerging from the comparison of the four plots needs some discussion. We start by noticing that in all cases Aβ1–40 has the tendency of loosing its initial (Protein Data Bank) α-helix structure (Fig. 6; blue points). This phenomenon, however, occurs at different degrees depending on the system. In the lpffd and taulpffd system the α-helix structure is completely absent (it was lost already in the first 30 ns of simulation; data not shown). In the case of the abeta system (peptide in the absence of BSBps) the α-helix remained confined to the 8–13 segment and was partially replaced (13–18 region) by the quite similar 5-helix structure (purple points).4 Finally, the longest sequence of residues (11–20 segment) that conserves an α-helix structure was found in the lpffn system, i.e. where Aβ1–40 is in interaction with Ac-LPFFN-NH2 (see panel d of Fig. 2). If the formation of (small) Aβ1–40 aggregates is to be ascribed to the loss of the native α-helix structure, again the new Ac-LPFFN-NH2BSBp appears to be in a better position than the other BSBps in suppressing peptide aggregation.
The Definition of Secondary Structure of Proteins analysis confirms the presence of short β-sheet strands (visible in Fig. 2, panels a–c) both in the case of Aβ1–40 in the absence of BSBps in the time range between 52 and 58 ns and when the peptide was in interaction with Ac-LPFFD-NH2, almost all along the trajectory.5
Because a β-sheet structure was supposed to favor aggregation, one might ask by which mechanism Ac-LPFFD-NH2 is able to contrast peptide aggregation. We think that the answer can be found by looking at the overall structural arrangement of the peptide with the BSBps that come close to it along the MD trajectory. Indeed, one notices that the β-sheet structure visible in the lpffd and taulpffd systems gets formed between an Aβ1–40 segment and one of the BSBps (intermolecular β-sheet) and not within the peptide (intramolecular β-sheet).
The situation concerning the lpffn system was even more interesting. In fact, as shown in Fig. 2, panel d, now the β-sheet strand formed between two BSBps (5 and 8). The inter-BSBp β-sheet strand was located exactly in front of the conserved Aβ1–40 α-helix region (residues 11–17), which in the lowest panel of Fig. 6 is represented by the blue strip extending all along the trajectory. We are led to the conclusion that the peptide α-helix stability in the 11–17 region is related to the formation of a β-sheet strand between two BSBps.
Our detailed simulations allow us to conclude that the first two tested BSBps (Ac-LPFFD-NH2 and Tau-LPFFD-NH2) act by somehow saturating (or hindering) the dangling bonds of a nascent β-sheet structure so that the latter are not available anymore for Aβ1–40 aggregation. The third BSBp (Ac-LPFFN-NH2), instead, in the very high BSBp:Aβ molar ratio (larger than 10:1) in which simulations and experiments (see next section) were carried out, act more by stabilizing the Aβ1–40 α-helix structure (44, 45).
Experimental Results; ThT Binding Assay
The in vitro anti-aggregation activity of Ac-LPFFD-NH2 or Ac-LPFFN-NH2BSBps was monitored by measuring the changes in the relative fluorescence activity in the ThT binding assay. In Fig. 7 we show the results of the measurements of the relative fluorescence intensity at 484 nm as a function of time of three samples containing 16.0 μm Aβ1–40 either alone or in the presence of 12 m excess of Ac-LPFFD-NH2 or Ac-LPFFN-NH2 BSBps.6 Fluorescence measurements have been followed for a total time ranging from about 50 to 100 h.
FIGURE 7.
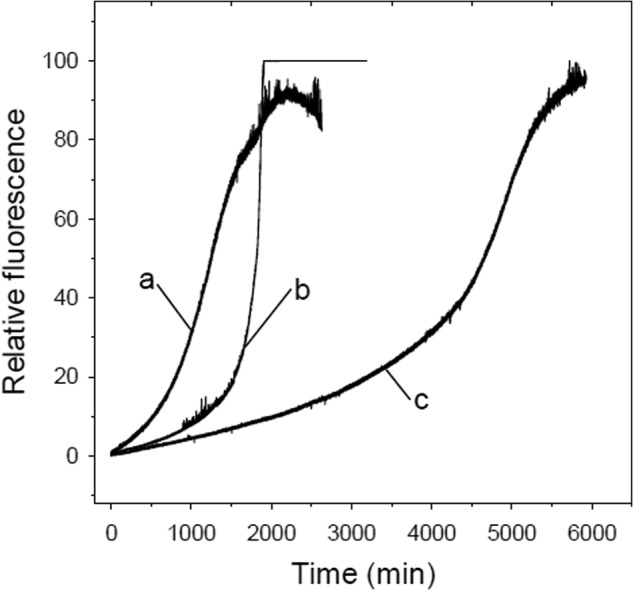
In vitro activity of the Ac-LPFFD-NH2 or Ac-LPFFN-NH2 BSBps. Fluorescence changes were monitored continuously at 393 K at 484 nm (450-nm excitation wavelength) in a 1-ml final volume containing 10 μm ThT, 16.0 μm Aβ1–40 in 20 mm Tris-HCl, pH 7.4, alone (a) and in the presence of a 12 m excess of Ac-LPFFD-NH2 (b) or Ac-LPFFN-NH2 (c).
The amplitude of ThT fluorescence (and thus the kinetics of Aβ1–40 aggregation) is characterized by a time-dependent sigmoidal profile in which one can identify three phases, characterized by three different slopes: the lag phase, the growth exponential phase, and the final phase. ThT fluorescence amplitudes of all three samples increase with time and reach the same maximum. The length of the lag phase has been widely used in the literature as a diagnostic indicator of inhibition of Aβ1–40 aggregation, as the longer the lag phase, the higher the BSBp inhibition activity. The main difference among the three sets of data is clearly in the lag phase. Indeed, when Aβ1–40 is incubated with Ac-LPFFD-NH2 or Ac-LPFFN-NH2 the lag phase, namely the time needed to reach 20% of the maximal amplitude, passes from 600 min for the Aβ1–40 in the absence of BSBps to 1000 min in the presence of Ac-LPFFD-NH2 and up to 3000 min in the presence of Ac-LPFFN-NH2.
Far UV CD Spectroscopy
Conformational studies on the synthetic lyophilized Aβ1–40 in the absence or in the presence of BPBps were performed by monitoring the far UV CD spectral changes as a function of time, in parallel with the ThT binding assay and over the same time extent. Typically, Aβ1–40 alone displayed the far UV CD spectral changes reported in Fig. 8, panel A.
FIGURE 8.

Far UV CD spectra of 16.0 μm Aβ1–40 in 20 mm Tris-HCl, pH 7.4, at 293 K is plotted as a function of time in the interval from 0 to 50 h (A). The first (B) and the second (C) spectral components of the far UV CD spectra of 16.0 μm Aβ1–40 in 20 mm Tris-HCl, pH 7.4, at 293 K are identified by singular value decomposition and plotted as a function of time in the interval from 0 to 50 h. The effect of BSBps on the far UV CD changes of Aβ1–40 is monitored at 198 and 215 nm. The changes at 198 nm (D) and at 215 nm (E) of the first and second spectral component, respectively, of 16 μm Aβ1–40 dissolved in 20 mm Tris-HCl, pH 7.4, are followed in the absence (full dots) and presence of a 12 m excess of Ac-LPFFD-NH2 (full triangles) from 0 to 3500 min and of Ac-LPFFN-NH2 (full squares) from 0 to 6800 min.
The spectral changes of Aβ1–40 in the absence of BSBps monitored over 50 h can be ascribed to an overall decrease of the negative molar ellipticity at around 198 nm, typical of turns-containing structure regions (46), accompanied by an increase of the negative molar ellipticity at around 215 nm, characteristic of β-sheet structure.
Two main spectral components are identified by singular value decomposition of the far UV CD spectra of Aβ1–40 alone monitored over 50 h. The decrease of the negative molar ellipticity at around 198 nm (Fig. 8, panel B) can be mainly referred to the disappearance of turns-containing structure; the appearance of a β-sheet structure is revealed by the increase of the negative molar ellipticity at 215 nm and of the positive ellipticity at around 195 nm of the second spectral component (Fig. 8, panel C).
The in vitro inhibitory activity of Ac-LPFFD-NH2 and Ac-LPFFN-NH2 was tested by monitoring their efficacy in preventing and/or interfering with the Aβ1–40 secondary structure conformational transition that is considered to precede the formation of fibrils and visible aggregates. The far UV CD spectra of Aβ1–40 in the presence of Ac-LPFFD-NH2 and Ac-LPFFN-NH2BSBps were monitored from time 0 to about 3500 min and from time 0 to about 6800 min, respectively. The spectra have been analyzed by singular value decomposition, revealing two main spectral components centered at around 198 and 215 nm, respectively, similarly to what was observed in the case of the Aβ1–40 alone. The changes at 198 nm and 215 nm visible in the first (panel D of Fig. 8) and the second (panel E of Fig. 8) spectral component were significantly reduced in amplitude in the presence of both BSBps.
A plot of the changes of molar ellipticity at 198 nm of the first spectral component of Aβ1–40 alone as a function of time shows a sigmoidal profile with a jump of about 1.2 × 10⁴ deg·cm2·dmol−1 (see Fig. 8, panel D). In the presence of Ac-LPFFD-NH2 or Ac-LPFFN-NH2, the amplitude of the jump at 198 nm was significantly reduced with respect to that observed for Aβ1–40 alone (see Fig. 8, panel D). As for the changes at 215 nm of the second spectral component in the presence of Ac-LPFFD-NH2 or Ac-LPFFN-NH2, they appeared to be negligible in comparison with those observed in Aβ1–40 alone (Fig. 8, panel E). These results suggest that the interaction between Aβ1–40 and Ac-LPFFD-NH2 or Ac-LPFFN-NH2 reduces the peptide conformational transition propensity.
When either Ac-LPFFD-NH2 or Ac-LPFFN-NH2 was present, there was an apparent discrepancy between ThT binding assay and far UV CD changes as a function of time (Fig. 8, panels D and E, full triangles and full squares stand for Aβ1–40 in the presence of Ac-LPFFD-NH2 and of Ac-LPFFN-NH2, respectively). However, such results should be interpreted with caution at the high molar ratio (Aβ1–40:BSBp = 1:12) at which experiments have been performed, as BSBps alone give far UV CD contribution in the same spectral range as Aβ1–40 alone. The conformational changes of the BSBps in the presence of Aβ1–40 are not known; thus the spectral changes of the samples simultaneously containing Aβ1–40 and (a high concentration of) BSBps may be due to changes in Aβ1–40 and/or BSBp. Results in this direction were reported in Laczkó et al. (47). In addition, it has been proposed (44, 45) that different pathways may lead to fibril formation and in the presence of certain inhibitors fibrillization may occur even in the absence of oligomerization/aggregation. Thus, the two processes may well proceed independently.
Mass Spectrometry
With the main purpose of identifying the site(s) where the interaction between Aβ and BSBps takes place and thus verifying MD simulations results, ESI-MS (48) was employed to directly detect Aβ-BSBp non-covalent complexes. The ESI-MS technique is a powerful diagnostic tool, as it is not only able to detect the existence of such complexes, but it also provides information on a number of interesting details about the BSBp Aβ1–40 interaction. Because bound complexes can be transferred into the gas phase without the breaking of non-covalent bonds, the ESI MS technique allowed us to determine the location of the binding site(s), providing a measure of association ratio and interaction strength.
The mass spectrum of Aβ1–40 in acetate buffer (1.0 mm with 0.5% acetic acid) at a 50 μm final concentration and pH 3.5 (data not shown) shows the typical peaks (49) at m/z = 866.6 (+5), 1083.1 (+4), 1443.8 (+3), and 2166.0 (+2) corresponding to the molecule with the ionization charges indicated in parentheses. These numbers are consistent with a 4330.0-Da molecular mass. At neutral pH the mass spectrum shows, instead, the bell-shaped behavior typical of a polymerized amyloid from which no useful conclusions about the interaction properties of BSBp-Aβ1–40 complexes can be drawn.
After the addition of Ac-LPFFD-NH2 to freshly prepared Aβ1–40 solution in equimolar ratio (both prepared in acetate buffer at pH 3.5), the mass spectrum displays, besides the previously mentioned Aβ1–40 peaks, new ion signals corresponding to the multiply charged Aβ-BSBp states (1:1 association ratio) with charge +4 and +3 as well as peaks that can be attributed to multiply charged (Aβ)2-BSBp states (2:1 association ratio) with charges +5, +6, and +7 (data not shown).
On the basis of these findings and with the aim of identifying which region of the Aβ1–40 interacts with the ligand, we have studied the non-covalent interactions of Ac-LPFFD-NH2 and of its two derivatives, Ac-LPFFN-NH2 and Tau-LPFFD-NH2, with the two peptide fragments, Aβ25–35 and Aβ17–21.
In Tables 3 and Table 4, the K1, K2, and K3 constants refer to the three association reactions, respectively,
where a-b stands for the 25–35 (Table 3) or 17–21 (Table 4) fragment, and BSBpj,j = 1, 2, and 3, are the three BSBps considered in this paper. The percentage of bound amyloid, given in the fifth column of the Tables 3 and 4, was computed as the ratio of the concentration of (single or pairs of) Aβa-b fragments, bound with one or two BSBps with respect to the total Aβa-b concentration. In the last column the fractions of bound Aβa-b in reactions 3, 4, and 5 are reported.
TABLE 3.
Incubated BSBp (first column), K1, K2, and K3 constants for equations 3, 4, and 5 (second, third, and fourth column), percentage of bound Aβ25–35 (fifth column), and fraction percentage of bound Aβ25–35 in equations 3, 4, and 5
| BSBp | K1 | K2 | K3 | Bound Aβ25–35 | % |
|---|---|---|---|---|---|
| m−1 | m−1 | m−1 | % | ||
| Ac-LPFFD-NH2 | 3.92·10−7 | 4.34·10−7 | 1.55·10−6 | 3.44 | 82/9/9 |
| Tau-LPFFD-NH2 | 0.80·10−7 | 6.57·10−7 | 5.03·10−7 | 2.80 | 77/14/9 |
| Ac-LPFFN-NH2 | 1.55·10−7 | 3.68·10−7 | 1.66·10−6 | 6.29 | 65/7/28 |
TABLE 4.
Incubated BSBp (first column), K1, K2, and K3 constants for equations 3, 4, and 5 (second, third, and fourth column), percentage of bound Aβ17–21 (fifth column), and fraction percentage of bound Aβ17–21 in equations 3, 4, and 5
| BSBp | K1 | K2 | K3 | Bound Aβ17–21 | % |
|---|---|---|---|---|---|
| m−1 | m−1 | m−1 | % | ||
| Ac-LPFFD-NH2 | 4.62·10−7 | 6.07·10−7 | 1.65·10−6 | 6.31 | 75/13/12 |
| Tau-LPFFD-NH2 | 3.97·10−7 | 1.66·10−7 | 2.25·10−7 | 7.49 | 91/5/4 |
| Ac-LPFFN-NH2 | 9.20·10−7 | 3.07·10−7 | 4.69·10−7 | 21.66 | 84/7/9 |
From Tables 3 and 4 we see that the ESI-MS analysis exhibits an interesting distribution of multiply charged ions of Aβ17–21 and Aβ25–35 fragments and their complexes with BSBps in various stoichiometric combinations. In particular, the intensity of the observed peaks, corresponding to the various complexes formed by Aβ fragments bound to BSBps (data not shown), indicate that Ac-LPFFN-NH2 binds more strongly than Ac-LPFFD-NH2 and Tau-LPFFD-NH2. In addition, Ac-LPFFN-NH2 is seen to bind preferentially to the Aβ17–21 fragment. All these experimental findings nicely confirm the MD simulations results we have previously presented.
Conclusions
MD simulation results show that essentially all the tested BSBps have the ability of reducing Aβ1–40 residues mobility, with Ac-LPFFN-NH2 as the most effective BSBp in this respect. A possible explanation for this feature is the following. In all the simulated systems one notices that, after the initial transient, some of the BSBps tend to approach the hydrophobic 25–35 region of Aβ1–40, but the newly considered Ac-LPFFN-NH2BSBp is also able to interact with the key hydrophobic 17–21 region. This significantly helps in preserving the native Aβ1–40 α-helix secondary structure as it is confirmed by the persistency of the α-helix secondary structure throughout the whole MD simulation, visible in the 11–20 region of the lpffn system (see the bottom panel of Fig. 6).
Stimulated by the above MD results, we performed the same kind of experiments that were previously carried out on Ac-LPFFD-NH2 and Tau-LPFFD-NH2 in Giordano et al. (14, 15) on Ac-LPFFD-NH2 and on the new Ac-LPFFN-NH2BSBp. As detailed under “Experimental Results,” one finds that in the presence of Ac-LPFFN-NH2 the formation of Aβ1–40 fibrils was significantly delayed as indicated by the lag phase increase in ThT fluorescence experiments. Moreover, far UV CD measurements show that Ac-LPFFN-NH2 stabilizes the Aβ1–40 secondary structure, thus reducing the peptide β-sheet formation propensity. This stability may be considered the basis of the slowing-down of Aβ1–40 aggregation indicated by ThT fluorescence experiments. Finally ESI-MS data clearly demonstrate that Ac-LPFFN-NH2 preferentially interacts with the 17–21 hydrophobic Aβ1–40 region.
All the collected experimental results are in very good agreement with MD simulations. In particular, MD simulations show that Ac-LPFFN-NH2 binds via H-bonds to the 17–21 segment of Aβ1–40 (consistently with what is suggested by ESI-MS data), precisely within the region where the native Aβ1–40 α-helix secondary structure appears to survive solvation. We regard the overall consistency between experimental evidence and MD simulation results as a fairly strong indication that Ac-LPFFN-NH2 can be an effective lead compound in preventing and/or destabilizing Aβ1–40 aggregation.
Acknowledgment
We thank the AuroraScience project (funded by PAT and INFN) for allocating the computing resources for this project.
By “neutral pH” we mean that the protonation state of the peptide is chosen so as to have N terminus, arginine, and lysine protonated and positively charged and the C terminus, glutamic, and aspartic acid deprotonated and negatively charged. This choice corresponds to the expected protonation state of free amino acids at neutral pH.
This result may seem in contradiction with the simulation studies of Refs. 42 and 43, where it is claimed that the native α-helix structure of the peptide is completely lost in water. The reason for the discrepancy is most probably due to the different temperature at which simulations have been carried out, namely 300 K in our case and 360 K in Refs. 42 and 43.
We did not see here the β-sheet structure visible at the end of the trajectory in panel c of Fig. 2 that refers to the case of Aβ1–40 in the presence of Tau-LPFFD-NH2. This difference was most probably due to the fact that the Definition of Secondary Structure of Proteins algorithm was slightly different from the one used by VMD that was employed to produce Figure 2.
- Aβ
- amyloid β peptide
- APP
- amyloid precursor protein
- BSBp
- β-sheet breaker peptide
- Tau
- taurine
- MD
- molecular dynamics
- ThT
- thioflavin T
- ESI-MS
- electrospray ionization-MS
- Fmoc
- N-(9-fluorenyl)methoxycarbonyl
- r.m.s.d.
- root mean square deviation.
REFERENCES
- 1. Prusiner S. B. (2001) Shattuck lecture. Neurodegenerative diseases and prions. N. Engl. J. Med. 344, 1516–1526 [DOI] [PubMed] [Google Scholar]
- 2. Pepys M. B. (2001) Pathogenesis, diagnosis, and treatment of systemic amyloidosis. Philos. Trans. R. Soc. Lond. B. Biol. Sci. 356, 203–210 [DOI] [PMC free article] [PubMed] [Google Scholar]
- 3. Serpell L. (2000) Alzheimer's amyloid fibrils. Structure and assembly. Biochim. Biophys. Acta 1502, 16–30 [DOI] [PubMed] [Google Scholar]
- 4. Soto C., Castaño E. M., Frangione B., Inestrosa N. C. (1995) The α-helical to β-strand transition in the amino-terminal fragment of the amyloid β-peptide modulates amyloid formation. J. Biol. Chem. 270, 3063–3067 [DOI] [PubMed] [Google Scholar]
- 5. Tomaselli S., Esposito V., Vangone P., van Nuland N. A., Bonvin A. M., Guerrini R., Tancredi T., Temussi P. A., Picone D. (2006) The α-to-β conformational transition of Alzheimer's Aβ-(1–42) peptide in aqueous media is reversible. A step by step conformational analysis suggests the location of β conformation seeding. Chembiochem 7, 257–267 [DOI] [PubMed] [Google Scholar]
- 6. Soto C. (1999) Plaque busters. Strategies to inhibit amyloid formation in Alzheimer's disease. Mol. Med. Today 5, 343–350 [DOI] [PubMed] [Google Scholar]
- 7. Ghanta J., Shen C. L., Kiessling L. L., Murphy R. M. (1996) A strategy for designing inhibitors of β-amyloid toxicity. J. Biol. Chem. 271, 29525–29528 [DOI] [PubMed] [Google Scholar]
- 8. Gordon D. J., Meredith S. C. (2003) Probing the role of backbone hydrogen bonding in β-amyloid fibrils with inhibitor peptides containing ester bonds at alternate positions. Biochemistry 42, 475–485 [DOI] [PubMed] [Google Scholar]
- 9. Hilbich C., Kisters-Woike B., Reed J., Masters C. L., Beyreuther K. (1992) Substitutions of hydrophobic amino acids reduce the amyloidogenicity of Alzheimer's disease β A4 peptides. J. Mol. Biol. 228, 460–473 [DOI] [PubMed] [Google Scholar]
- 10. Adessi C., Frossard M. J., Boissard C., Fraga S., Bieler S., Ruckle T., Vilbois F., Robinson S. M., Mutter M., Banks W. A., Soto C. (2003) Pharmacological profiles of peptide drug candidates for the treatment of Alzheimer's disease. J. Biol. Chem. 278, 13905–13911 [DOI] [PubMed] [Google Scholar]
- 11. Soto C., Kindy M. S., Baumann M., Frangione B. (1996) Inhibition of Alzheimer's amyloidosis by peptides that prevent β-sheet conformation. Biochem. Biophys. Res. Commun. 226, 672–680 [DOI] [PubMed] [Google Scholar]
- 12. Permanne B., Adessi C., Saborio G. P., Fraga S., Frossard M. J., Van Dorpe J., Dewachter I., Banks W. A., Van Leuven F., Soto C. (2002) Reduction of amyloid load and cerebral damage in a transgenic mouse model of Alzheimer's disease by treatment with a β-sheet breaker peptide. FASEB J. 16, 860–862 [DOI] [PubMed] [Google Scholar]
- 13. Soto C., Sigurdsson E. M., Morelli L., Kumar R. A., Castaño E. M., Frangione B. (1998) β-Sheet breaker peptides inhibit fibrillogenesis in a rat brain model of amyloidosis. Implications for Alzheimer's therapy. Nat. Med. 4, 822–826 [DOI] [PubMed] [Google Scholar]
- 14. Giordano C., Masi A., Pizzini A., Sansone A., Consalvi V., Chiaraluce R., Lucente G. (2009) Synthesis and activity of fibrillogenesis peptide inhibitors related to the 17–21 β-amyloid sequence. Eur. J. Med. Chem. 44, 179–189 [DOI] [PubMed] [Google Scholar]
- 15. Giordano C., Sansone A., Masi A., Masci A., Mosca L., Chiaraluce R., Pasquo A., Consalvi V. (2012) Inhibition of amyloid peptide fragment Aβ25–35 fibrillogenesis and toxicity by N-terminal β-amino acid-containing esapeptides. Is taurine moiety essential for in vivo effects? Chem. Biol. Drug. Des. 79, 30–37 [DOI] [PubMed] [Google Scholar]
- 16. Allen M., Tildesley D. (1987) Computer Simulations of Liquids, Clarendon Press, Oxford [Google Scholar]
- 17. Hohenberg P., Kohn W. (1964) Inhomogeneous electron gas. Phys. Rev. 136, 864–871 [Google Scholar]
- 18. Kohn W., Sham L. J. (1965) Self-consistent equations including exchange and correlation effects. Phys. Rev. 140, 1133–1138 [Google Scholar]
- 19. Car R., Parrinello M. (1985) Unified approach for molecular dynamics and density-functional theory. Phys. Rev. Lett. 55, 2471–2474 [DOI] [PubMed] [Google Scholar]
- 20. Giannozzi P., Jansen K., La Penna G., Minicozzi V., Morante S., Rossi G., Stellato F. (2012) Zn induced structural aggregation patterns of β-amyloid peptides by first-principle simulations and XAS measurements. Metallomics 4, 156–165 [DOI] [PubMed] [Google Scholar]
- 21. Miller Y., Ma B., Nussinov R. (2010) Zinc ions promote Alzheimer Aβ aggregation via population shift of polymorphic states. Proc. Natl. Acad. Sci. U.S.A. 107, 9490–9495 [DOI] [PMC free article] [PubMed] [Google Scholar]
- 22. Novick P. A., Lopes D. H., Branson K. M., Esteras-Chopo A., Graef I. A., Bitan G., Pande V. S. (2012) Design of β-amyloid aggregation inhibitors from a predicted structural motif. J. Med. Chem. 55, 3002–3010 [DOI] [PMC free article] [PubMed] [Google Scholar]
- 23. Crescenzi O., Tomaselli S., Guerrini R., Salvadori S., D'Ursi A. M., Temussi P. A., Picone D. (2002) Solution structure of the Alzheimer's disease Amyloid β peptide(1–42). Eur. J. Biochem. 269, 5642–5648 [DOI] [PubMed] [Google Scholar]
- 24. Berendsen H. J. C., van der Spoel D., van Drunen R. (1995) GROMACS. A message-passing parallel molecular dynamics implementation. Comp. Phys. Comm. 91, 43–56 [Google Scholar]
- 25. Lindahl E., Hess B., van der Spoel D. (2001) GROMACS 3.0. A package for molecular simulation and trajectory analysis. J. Mol. Model. 7, 306–317 [Google Scholar]
- 26. Van Der Spoel D., Lindahl E., Hess B., Groenhof G., Mark A. E., Berendsen H. J. (2005) GROMACS. Fast, flexible, and free. J. Comput. Chem. 26, 1701–1718 [DOI] [PubMed] [Google Scholar]
- 27. Hess B., Kutzner C., van der Spoel D., Lindahl E. (2008) GROMACS 4. Algorithms for highly efficient, load-balanced, and scalable molecular simulation. J. Chem. Theory Comput. 4, 435–447 [DOI] [PubMed] [Google Scholar]
- 28. Oostenbrink C., Villa A., Mark A. E., van Gunsteren W. F. (2004) A biomolecular force field based on the free enthalpy of hydration and solvation. The GROMOS force-field parameter sets 53A5 and 53A6. J. Comput. Chem. 25, 1656–1676 [DOI] [PubMed] [Google Scholar]
- 29. Malde A. K., Zuo L., Breeze M., Stroet M., Poger D., Nair P. C., Oostenbrink C., Mark A. E. (2011) An automated force field topology builder (ATB) and repository. Version 1.0. J. Chem. Theo. Comp. 7, 4026–4037 [DOI] [PubMed] [Google Scholar]
- 30. Bussi G., Donadio D., Parrinello M. (2007) Canonical sampling through velocity rescaling. J. Chem. Phys. 126, 014101 [DOI] [PubMed] [Google Scholar]
- 31. Berendsen H. J. C., Postma J. P. M., DiNola A., Haak J. R. (1984) Molecular dynamics with coupling to an external bath. J. Chem. Phys. 81, 3684–3690 [Google Scholar]
- 32. Darden T., York D., Pedersen L. (1993) Particle mesh Ewald. An Nlog(N) method for Ewald sums in large systems. J. Chem. Phys. 98, 10089–10092 [Google Scholar]
- 33. Atherton E., Sheppard R. (1989) Solid Phase Synthesis. A Practical Approach. IRL Press, Oxford [Google Scholar]
- 34. Brouwer A. J., Monnee M. C. F., Liskamp R. M. J. (2000) An efficient synthesis of N-protected β-aminoethanesulfonyl chlorides. Versatile building blocks for the synthesis of oligopeptidosulfonamides. Synthesis 11, 1579–1584 [Google Scholar]
- 35. Naiki H., Higuchi K., Hosokawa M., Takeda T. (1989) Fluorometric determination of amyloid fibrils in vitro using the fluorescent dye thioflavine T. Anal. Biochem. 177, 244–249 [DOI] [PubMed] [Google Scholar]
- 36. Henry E. R., Hofrichter J. (1992) Singular value decomposition. application to analysis of experimental data. Methods Enzymol. 210, 129–192 [Google Scholar]
- 37. Johnson W. C., Jr. (1992) Analysis of circular dichroism spectra. Methods Enzymol. 210, 426–447 [DOI] [PubMed] [Google Scholar]
- 38. Ionescu R. M., Smith V. F., O'Neill J. C., Jr., Matthews C. R. (2000) Multistate equilibrium unfolding of Escherichia coli dihydrofolatereductase. Thermodynamic and spectroscopic description of the native, intermediate, and unfolded ensembles. Biochemistry 39, 9540–9550 [DOI] [PubMed] [Google Scholar]
- 39. Maiorov V. N., Crippen G. M. (1995) Size-independent comparison of protein three-dimensional structures. Proteins 22, 273–283 [DOI] [PubMed] [Google Scholar]
- 40. Lemkul J. A., Bevan D. R. (2012) The role of molecular simulations in the development of inhibitors of amyloid β-peptide aggregation for the treatment of Alzheimer's disease. ACS Chem. Neurosci. 3, 845–856 [DOI] [PMC free article] [PubMed] [Google Scholar]
- 41. Kabsch W., Sander C. (1983) Dictionary of protein secondary structure. Pattern recognition of hydrogen-bonded and geometrical features. Biopolymers 22, 2577–2637 [DOI] [PubMed] [Google Scholar]
- 42. Ito M., Johansson J., Strömberg R., Nilsson L. (2011) Unfolding of the amyloid β-peptide central helix. Mechanistic insights from molecular dynamics simulations. PLoS ONE 6, e17587. [DOI] [PMC free article] [PubMed] [Google Scholar]
- 43. Ito M., Johansson J., Strömberg R., Nilsson L. (2012) Effects of ligands on unfolding of the amyloid β-peptide central helix. Mechanistic insights from molecular dynamics simulations. PLoS ONE 7, e30510. [DOI] [PMC free article] [PubMed] [Google Scholar]
- 44. Bartolini M., Bertucci C., Bolognesi M. L., Cavalli A., Melchiorre C., Andrisano V. (2007) Insight into the kinetic of amyloid β (1–42) peptide self-aggregation. Elucidation of inhibitors' mechanism of action. Chembiochem 8, 2152–2161 [DOI] [PubMed] [Google Scholar]
- 45. Necula M., Kayed R., Milton S., Glabe C. G. (2007) Small molecule inhibitors of aggregation indicate that amyloid β oligomerization and fibrillization pathways are independent and distinct. J. Biol. Chem. 282, 10311–10324 [DOI] [PubMed] [Google Scholar]
- 46. Woody R. W., Dunker A. K. (1996) in Circular Dichroism and the Conformational Analysis of Biomolecules. Plenum Press, New York [Google Scholar]
- 47. Laczkó I., Vass E., Soós K., Fülöp L., Zarándi M., Penke B. (2008) Aggregation of Aβ(1–42) in the presence of short peptides. Conformational studies. J. Pept. Sci. 14, 731–741 [DOI] [PubMed] [Google Scholar]
- 48. Loo J. A. (2000) Electrospray ionization mass spectrometry. A technology for studying noncovalent macromolecular complexes. Int. J. Mass Spectrom. 200, 175–186 [Google Scholar]
- 49. Bazoti F. N., Tsarbopoulos A., Markides K. E., Bergquist J. (2005) Study of the non-covalent interaction between amyloid-β-peptide and melatonin using electrospray ionization mass spectrometry. J. Mass Spectrom. 40, 182–192 [DOI] [PubMed] [Google Scholar]