

Background: G proteins couple receptor binding to nucleotide release via an allosteric network.
Results: Mutation of allosteric sites of Gαi1 stabilizes a transient signaling conformation and may highlight an allosteric connection between receptor and nucleotide.
Conclusion: The P-loop interacts with Switch I in the K345L variant of Gαi1.
Significance: G protein signaling is critical for numerous cellular functions, and GDP release is the rate-limiting step of the cycle.
Keywords: Allosteric Regulation, G Protein-coupled Receptors (GPCR), G Proteins, Heterotrimeric G Proteins, Rhodopsin, Signal Transduction
Abstract
Receptor-mediated activation of the Gα subunit of heterotrimeric G proteins requires allosteric communication between the receptor binding site and the guanine nucleotide binding site, which are separated by >30 Å. Structural changes in the allosteric network connecting these sites are predicted to be transient in the wild-type Gα subunit, making studies of these connections challenging. In the current work, site-directed mutants that alter the energy barriers between the activation states are used as tools to better understand the transient features of allosteric signaling in the Gα subunit. The observed differences in relative receptor affinity for intact Gαi1 subunits versus C-terminal Gαi1 peptides harboring the K345L mutation are consistent with this mutation modulating the allosteric network in the protein subunit. Measurement of nucleotide exchange rates, affinity for metarhodopsin II, and thermostability suggest that the K345L Gαi1 variant has reduced stability in both the GDP-bound and nucleotide-free states as compared with wild type but similar stability in the GTPγS-bound state. High resolution x-ray crystal structures reveal conformational changes accompanying the destabilization of the GDP-bound state. Of these, the conformation for Switch I was stabilized by an ionic interaction with the phosphate binding loop. Further site-directed mutagenesis suggests that this interaction between Switch I and the phosphate binding loop is important for receptor-mediated nucleotide exchange in the wild-type Gαi1 subunit.
Introduction
Heterotrimeric G proteins (Gαβγ) switch between activation states to elicit cellular responses (1). In the Gα subunit, signaling competence is encoded into surface conformations that reflect the identity of bound guanine nucleotide. The GTP-bound form of the Gα subunit is considered the activated state as its Switch regions adopt conformations that can interact with effector molecules. Hydrolysis of GTP to GDP changes the conformations of these regions and converts the Gα subunit to a state that instead associates with Gβγ. GDP-bound Gαβγ then traffics to the membrane where it can interact with G protein-coupled receptor (GPCR).3 The GPCR in turn facilitates release of GDP from the Gα subunit. Subsequent binding of GTP both completes the G protein signaling cycle and is the rate-limiting step of G protein signaling (1).
Biochemical, kinetic, and structural characterizations have identified binding sites for GPCR on the Gα subunit (2–15). This contiguous surface includes the N terminus (2–7), the α4-β6 loop (8–13), the α3-β5 loop (14), and the C terminus of Gα (3) and is located >30 Å away from the guanine nucleotide binding site (15–17) (Fig. 1). Of these receptor-interacting elements, perhaps the best studied is the C terminus, with EPR spectroscopy (18, 19) and x-ray crystallography (15), both indicating that the terminal helix (α5) undergoes a roto-translation upon receptor binding that is critical for nucleotide release.
FIGURE 1.
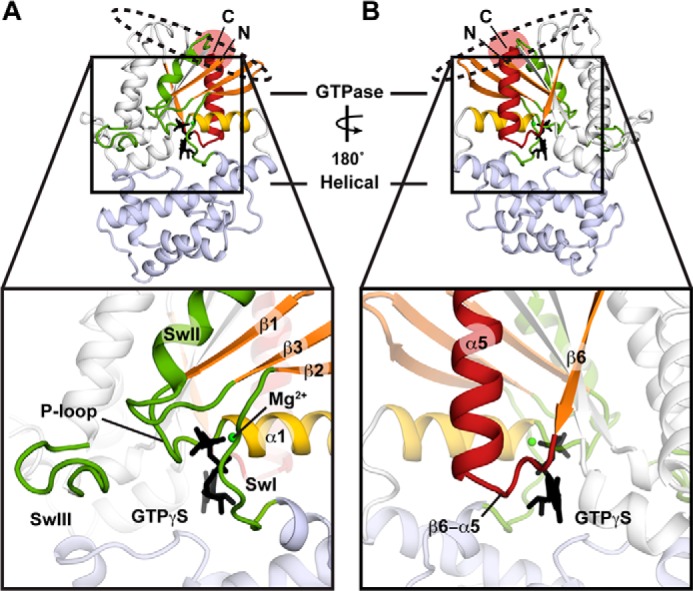
Overview of structural and functional motifs of Gαi1. Elements important to the allosteric regulation of Gαi1 are shown mapped onto the structure of GTPγS-bound Gαi1 (PDB entry 1GIA (47)). The location of Lys-345 is highlighted with a red circle. The contiguous receptor binding site is highlighted with a dashed circle. Structural elements are colored as follows: α5 helix (red), β1, β2, β3, and β6 strands (orange), α1 helix (yellow), P-loop and Switch regions (SwI, SwII, SwIII; green). The inset in A highlights the orientations of the β1, β2, and β3 strands (orange), the α1 helix (yellow), the nucleotide-flanking P-loop (green), and Switch regions (SwI, SwII, SwIII; green). The inset in B highlights the α5 helix (red), the β6 strand (orange), and the β6-α5 loop (green) orientations relative to the GTP binding site.
The importance of the C terminus in receptor binding was first revealed using peptide mimetics of various regions of the G protein (3). Interestingly, combinatorial libraries of peptide mimetics of the Gαt C terminus containing systematic sequence substitutions identified mutations with improvements in affinity for rhodopsin over the parent sequence (20). The greatest increase in affinity was ∼200-fold and was associated with a lysine-to leucine substitution (K341L in Gαt, K345L in Gαi1) (20, 21). Later, a Gαt peptide harboring this substitution was used as a tool to stabilize opsin and metarhodopsin II for structure determination (22–25).
Surprisingly, however, when the K341L mutation was introduced into chimeric Gαt/Gαi1, it did not similarly improve the affinity for receptor (26). Because both G proteins and cognate GPCRs transmit signals via allosteric networks, one possibility for this apparent contradiction is that this C-terminal mutation influences the allosteric network within the Gα subunit in a way that disfavors the receptor binding state and thus reduces receptor coupling efficiency and GDP release. Here, we used the K345L variant of Gαi1 to probe the allosteric pathway linking receptor binding to guanine nucleotide exchange. Our results combine measurements of basal and receptor-catalyzed nucleotide exchange, receptor binding studies, high resolution crystallography, and stability measurements to demonstrate how the K345L mutation alters the different nucleotide-bound states of the Gα subunit. An interaction between the P-loop and Switch I in the crystal structure of the K345L Gαi1 subunit identifies one potential conformational intermediate of nucleotide exchange. This allows us to propose a new connection between structural elements of Gα subunits, and suggests how the P-loop and Switch I help to coordinate nucleotide release.
EXPERIMENTAL PROCEDURES
Gαi1 Expression and Purification
The cDNA encoding Rattus norvegicus Gαi1 was amplified from the pPAL7 vector (generously donated by Dr. Ongun Onaran (Ankara University)) using appropriate primers and subcloned into the pSV277 expression vector (Vanderbilt University) to include an N-terminal hexahistidine tag and a thrombin cleavage site. The E43A and K345L mutations were introduced using the QuikChange Lightning site-directed mutagenesis ki (Stratagene) and confirmed by DNA sequencing (GenHunter).
Gαi1 was expressed in Escherichia coli BL21-Gold (DE3) as described (27). Briefly, cultures were grown at 37 °C in 2× YT medium with 50 μg/ml kanamycin A until the A600 reached 0.6. Expression was induced with 30–60 μm isopropyl 1-thio-β-d-galactopyranoside for 18–20 h at 22 °C. Cells were harvested by centrifugation and frozen at −80 °C.
Before purification, cell pellets were thawed and resuspended in ice-cold lysis buffer (50 mm NaHPO4, 300 mm NaCl, 2 mm MgCl2, 5 mm β-mercaptoethanol, 20 μm GDP, pH 8.0) supplemented with 0.1 mm PMSF or 1 mm Pefabloc and 1 μg/ml aprotinin, leupeptin, and pepstatin. The resuspended cells were disrupted by sonication, and the lysate was clarified by centrifugation for 1 h at 220,000 × g (50,000 rpm in a Ti70 rotor). The supernatant was treated with 10 μg/ml DNase and RNase, filtered, and added in batch to TALON Cobalt affinity resin equilibrated in lysis buffer. After 1 h at 4 °C, the resin was transferred to a gravity flow column and washed with lysis buffer, then lysis buffer supplemented with 5 mm imidazole pH 8.0. Protein was eluted with lysis buffer supplemented with 100 mm imidazole, pH 8.0, concentrated using an Amicon 10-kDa molecular weight cutoff centrifugal concentrator at 2000 × g, then diluted 20-fold. Thrombin was added (1 unit/mg of purified protein), and the sample was incubated overnight at 4 °C to cleave the N-terminal affinity tag. The protein sample was further purified over TALON Cobalt affinity resin equilibrated in lysis buffer and by size exclusion chromatography on a Superdex S200 10/300GL column equilibrated in storage buffer (50 mm Tris-Cl, 200 mm NaCl, 2 mm MgCl2, 1 mm EDTA, 1 mm DTT, 20 μm GDP, pH 8.0). Purified Gαi1 was concentrated to 10 mg/ml as determined by the BCA assay (Pierce) in triplicate, and glycerol was added to 10% (v/v) before storage at −80 °C. The purified protein contained two additional N-terminal residues (Gly-Ser) derived from the thrombin recognition sequence.
Rhodopsin and Transducin Purification
Endogenous rhodopsin and transducin were purified as previously described (28). Briefly, dark-adapted rhodopsin was stored as aliquots of urea-washed rod outer segment (ROS) membranes that were prepared by washing retinas twice with EDTA buffer (10 mm Tris-Cl, 1 mm EDTA, 1 mm DTT, pH 7.5) and once with urea buffer (10 mm Tris-Cl, 1 mm EDTA, 1 mm DTT, 7 m urea, pH 7.5). Pelleted membranes were then resuspended in 10 mm MOPS, 200 mm NaCl, 2 mm MgCl2, 1 mm DTT, 100 μm PMSF, pH 7.5, and aliquots stored at −80 °C.
Transducin was purified from light-adapted bovine ROS membranes. Membranes were washed 4 times with isotonic buffer (5 mm Tris-Cl, 130 mm KCl, 0.6 mm MgCl2, 1 mm EDTA, 1 mm DTT, pH 8.0) and two times with hypotonic buffer (5 mm Tris-Cl, 0.6 mm MgCl2, 1 mm EDTA, 1 mm DTT, pH 8.0). Transducin was then released into the supernatant by resuspending ROS membranes with hypotonic buffer containing 0.1 mm GTP. The membranes were pelleted by centrifugation, and the supernatant containing transducin was dialyzed against transducin storage buffer (20 mm Tris-Cl, 200 mm NaCl, 10 μm GDP, 5 mm β-mercaptoethanol, 10% glycerol, pH 7.5). Purified transducin was stored at −80 °C.
Basal and Receptor-mediated Nucleotide Exchange
The rate of GDP exchange for GTPγS in Gαi1 was determined by monitoring the increase in intrinsic tryptophan fluorescence (λex = 290 nm, λem = 340 nm) using a Varian Cary Eclipse fluorescence spectrometer. The fluorescence signal from basal nucleotide exchange was measured at 21 °C. In this assay the basal fluorescence from 500 nm wild-type or variant Gαi1 (in 50 mm Tris-Cl, 200 mm NaCl, 2 mm MgCl2, 1 mm DTT, pH 7.5) was collected for 5 min, after which time 10 μm GTPγS was added and mixed by pipetting. The fluorescence was then recorded for a minimum of 60 min. Receptor-mediated nucleotide exchange was monitored for heterotrimeric G protein, Gαi1β1γ1, reconstituted by incubating wild-type or variant Gαi1 with Gβ1γ1 purified from endogenous transducin in a 1:1 molar ratio for at least 20 min. 2 μm dark rhodopsin in urea-washed ROS membranes was added to 500 nm heterotrimeric G protein in assay buffer and incubated in the dark for a minimum of 20 min to allow complex association. GTPγS was added to a final concentration of 10 μm mixed by pipetting and fluorescence-monitored for an additional 5 min to measure the basal signal. Finally, the samples were light-activated and mixed by pipetting, and the fluorescence signal from receptor-mediated nucleotide exchange was monitored at 21 °C for a minimum of 60 min. Time courses for both basal and receptor-mediated nucleotide exchange experiments were determined empirically by monitoring fluorescence signal decay after the addition of GTPγS and were 60 and 90 min, respectively, in the experiments reported here. Nucleotide exchange rates were calculated from data for three independent experiments with four replicates per experiment and fit in Prism Version 6.0c using a one-site exponential association equation of the form
where t is time (min), Fo is the magnitude of the fluorescence signal at t = 0, Fmax is the maximum fluorescence signal, F is the fluorescence signal observed at time = t, and k is the rate constant (min−1). Values were normalized to wild-type Gαi1.
Rhodopsin Binding
Wild-type and variant Gαi1 binding to rhodopsin was measured in urea-washed ROS membranes as previously described (29). Gαi1 (5 μm) was incubated with Gβγ (10 μm) and rhodopsin (50 μm) in binding buffer (50 mm Tris-Cl, 100 mm NaCl, 2 mm MgCl2, pH 8.0) for 30 min at 4 °C and assessed under three different conditions: dark-adapted, after light activation, and after light activation with the addition of GTPγS (100 μm). Supernatants were separated from membranes by centrifugation at 200,000 × g for 1 h, and the dark-adapted supernatants were removed under dim red light. Isolated fractions were boiled, visualized by Coomassie-stained SDS-PAGE, and quantified by densitometry using a Bio-Rad Multimager. Quantities of 37-kDa Gαi1 in either the soluble or insoluble fraction are expressed as a percentage of the total protein in both. Data reported are the average of at least three independent experiments.
Extra Metarhodopsin II Formation
The formation of metarhodopsin II in ROS membranes was measured on an Aminco DW2000 spectrophotometer in the presence of increasing concentrations of G proteins previously described (4). Heterotrimeric G protein was reconstituted from purified wild-type or variant Gαi1 in the same manner as used for receptor-mediated nucleotide exchange measurements. Rhodopsin (2 μm) in dark-adapted urea-washed ROS membranes were incubated with varying concentrations of wild-type or K345L Gαi1β1γ1 in Extra Meta II buffer (50 mm HEPES, 100 mm NaCl, 1 mm MgCl2, 1 mm DTT, pH 8.0) on ice for ∼10 min. Absorption spectra for both dark and light-adapted samples were then collected at 4 °C. After collection of a dark-adapted spectrum, samples were exposed to 2 quick flashes of light ∼30 s apart. The light-adapted spectrum was then immediately collected. The extra meta II signal was calculated as the change in meta II formation (ΔA380 nm − ΔA440 nm) before and after light activation at 4 °C. The EC50 values for wild-type and mutant Gαi1 were calculated by plotting data as a function of the Gαi1β1γ1 concentration and fit to a four-parameter, variable slope equation (21) of the form
 |
where Y is the meta II signal, top is the Y value at the top plateau, bottom is the Y value at the bottom plateau, x is the log of the concentration of Gαi1βγ, and hill slope is the slope factor or the Hill slope (unit-less).
In Silico Modeling of Gα C Terminus Binding to Rhodopsin
The structure of opsin bound to the high affinity peptide of the Gα C terminus (PDB entry 3DQB (22)) and the structure of the β2-adrenergic receptor bound to Gαs (PDB entry 3SN6 (15)) were superimposed and prepared for in silico analysis in Maestro (Schrödinger LLC) (30). The position equivalent to Gαi1-345 in peptide and in Gαs was mutated in silico to either the amino acid originally in the structure (Arg or Leu) or the converse and set to the most favorable rotamer. A truncated-Newton energy minimization of all four structures was performed in the Maestro Workspace GUI using the program Prime (31, 32) and the OPLS_2005 all atom molecular mechanics force field (33). The Surface Generalized Born (VSGB) continuum solvation model (34) was also applied. To relax the structures around the mutations, the side chains were left unrestrained during the minimization. The energy minimizations were performed for two iterations and 65 steps per iteration. Resultant changes in receptor-Gα interactions were evaluated visually in Coot (35). After this procedure, structures of the crystallized entities (positive control calculations) were in close agreement with the deposited coordinates and structure factors.
Differential Scanning Fluorimetry to Measure Thermostability
Differential scanning fluorimetry was performed as described (36). Protein samples were diluted to a final concentration of 5 μm in assay buffer containing 5× SYPRO Orange (Bio-Rad) and 50 μm GDP or GTPγS. Thermostability was screened in both the extra meta II (EMB) assay buffer and nucleotide exchange (NEB) assay buffer. Triplicate samples were prepared in 20-μl volumes and transferred to a clear low profile 96-well PCR plate (Bio-Rad) and equilibrated at 25 °C for 2 min in a Bio-Rad CFX96 Real-time system (C1000 Thermal Cycler) before a temperature ramp from 25 to 95 °C in 0.2 °C increments at a rate of 1 °C/min. Changes in the fluorescence signal were monitored upon a temperature ramp from 25 to 95 °C. Data were analyzed using differential scanning fluorimetry analysis tools Version 3.0.2 (36). Sigmoidal regions of the data were fit with the Boltzmann equation to determine the Tm values.
Crystallization, Data Collection, Structure Determination, and Refinement
Crystals of GDP- and GTPγS-bound forms of the K345L Gαi1 variant protein were grown under the same conditions using the hanging-drop vapor diffusion method and previously reported reservoir conditions (37). Briefly, purified protein in 80 mm HEPES, 120 mm succinic acid, 8 mm DTT, pH 8.0, was incubated with either 1 mm GTPγS or 20 μm GDP, 40 μm AlCl3, and 16 mm NaF. Crystals were grown from hanging drops consisting of 4.8 μl of protein (10 mg/ml) and 1.2 μl of reservoir solution (2.0- 2.2 m ammonium sulfite, pH 8.0, 5–20 mm magnesium sulfate) equilibrated against 1 ml of reservoir solution at 20 °C. Crystals were cryo-protected by briefly soaking in reservoir solution containing glycerol at a final concentration of 17.5% and flash-cooled by plunging in liquid nitrogen.
Diffraction data were collected at the Advanced Photon Source (APS) beamlines 21-ID-D and 21-ID-G. All data were collected at 100 K and recorded on a Mar 300 CCD detector. Crystals formed in two different space groups: P3221 for GTPγS-bound K345L Gαi1 and I4 for GDP-bound K345L Gαi1. All data were indexed, integrated, and scaled using HKL2000 (38). Crystallographic data processing and refinement statistics are reported in Table 1.
TABLE 1.
Crystallographic data collection and refinement statistics
| GDP-bound | GTPγS-bound | |
|---|---|---|
| Data collection | ||
| Beamline | 21-ID-D | 21-ID-G |
| Wavelength | 1.078 Å | 0.979 Å |
| Space group | I 4 | P 32 2 1 |
| Unit cell dimensions | a = 121.5 Å | a = 79.6 Å |
| b = 121.5 Å | b = 79.6 Å | |
| c = 68.2 Å | c = 104.8 Å | |
| α = β = γ = 90° | α = β = 90°, γ = 120° | |
| Resolution range | 50-2.10 Å (2.18-2.10 Å)a | 50-1.55 Å (1.61-1.55 Å) |
| Number of reflections | 143,580 | 419,345 |
| Unique reflections | 29,073 | 55,216 |
| Rsymb | 5.3% (35.0%) | 6.9% (38.6%) |
| 〈I〉/〈σ〉c | 24.0 (5.0) | 22.8 (3.7) |
| Completeness | 99.7% (100%) | 97.7% (92.0%) |
| Refinement | ||
| Rcrystd | 17.9% | 15.6% |
| Rfreee | 21.5% | 18.7% |
| Ramachandranf | ||
| Most favored | 92.1% | 93.6% |
| Additionally allowed | 7.9% | 6.4% |
| Generously allowed | 0.0% | 0.0% |
| Disallowed | 0.0% | 0.0% |
a Values in parentheses are for the highest resolution shell.
b Rsym = ΣhklΣj|Ij − 〈I〉|/ΣhklΣIj, where j is the jth measurement, and 〈I〉 is the weighted mean of I.
c 〈I〉/〈σ〉 is the mean intensity divided by the mean error.
d Rcryst = Σhkl ‖Fo| − k|Fc‖/Σhkl|Fo|, where Fo and Fc are the observed and calculated structure factor amplitudes, and k is a weighting factor.
e Rfree is the same as Rcryst calculated on 5% of the reflections in GDP-bound K345L Gαi1 (1507 reflections) and GTPγS-bound K345L Gαi1 (2806 reflections).
f Ramachandran analysis from PROCHECK (41).
The structure of GTPγS-bound K345L Gαi1 was determined by molecular replacement in Phaser (39) using the structure of K349P Gαi1 as a search model (PDB entry 2ZJY (37)). The structure of GDP-bound K345L Gαi1 was determined by molecular replacement in Phaser (39) using the GTPγS-bound K345L Gαi1 structure as a search model. Initial model building used composite omit maps and was performed in Coot (35). Subsequent iterative rounds of refinement in Phenix (40) and model building in Coot (35) were performed to improve model quality, with sequential omit mapping used during the entire refinement process to minimize bias to the search model. Geometry was assessed in Procheck (41) and Molprobity (42). Figs. 1, 5, 6, and 9 were prepared using PyMOL (43). Supplemental Movie 1 was prepared in PyMOL (43) and Chimera (44).
FIGURE 5.
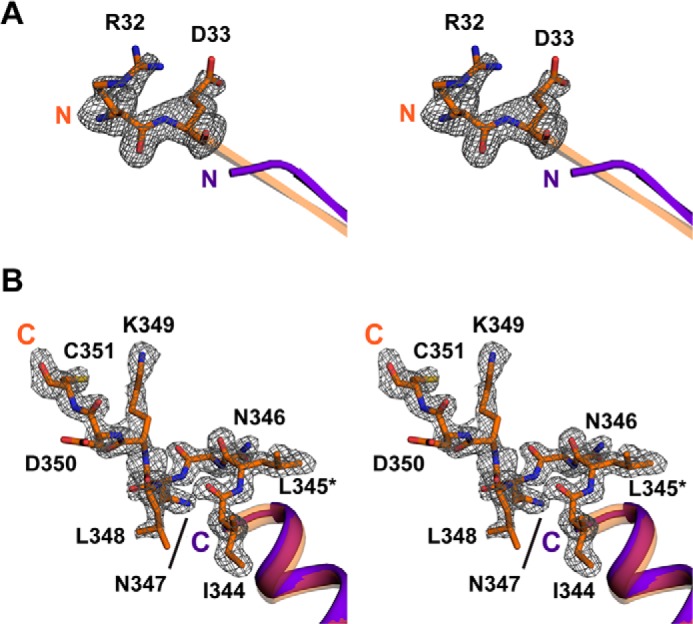
Quality of electron density maps for K345L Gαi1. Shown is a stereoview of the N (A) and C (B) termini of GTPγS-bound wild-type (PDB entry 1GIA (47); purple) and K345L Gαi1 subunits (orange). The model is superimposed with the corresponding |Fo| − |Fc| electron density calculated after the omission of relevant residues and contoured at 2σ. Residues that are observed in the K345L Gαi1 structure but are disordered in the wild-type Gαi1 structure are shown as sticks. The K345L mutation is labeled as *L345 in panel B.
FIGURE 6.

Structural features of K345L Gαi1. A, orientation of Switch I observed in the structure of GDP-bound K345L Gαi1 (green) compared with GDP-bound wild-type (PDB entry 1GDD (48); pink), GTPγS-bound wild-type (PDB entry 1GIA (47); purple), GTPγS-bound K345L Gαi1 (orange), and GDP-AlF4−-bound Gαi1 (PDB entry 1GFI (47); teal). B, stereoview of the salt bridge between Glu-43 and Arg-178 in the GDP-bound K345L Gαi1 subunit. Coloring for the overlaid structures is the same as panel A. The closest distance between a Glu-43Oϵ and the Arg-178Nς atom in any of the wild-type structures is 3.1 Å in the GTPγS-bound Gαi1 (PDB entry 1GIA (47); purple). This could be considered a long hydrogen bond, but it is noted that the temperature factors of both side chains are elevated in that structure. C–E, SwII and SwIII from GDP-bound K345L Gαi1 (green) superimposed with GDP-bound wild-type Gαi1 (PDB entry 1GDD (48); pink) (C), GDP-bound wild-type Gαt (PDB entry 1TAG (49); blue), (D) and GTPγS-bound wild-type Gαi1 (PDB entry 1GIA (47); purple) (E).
FIGURE 9.
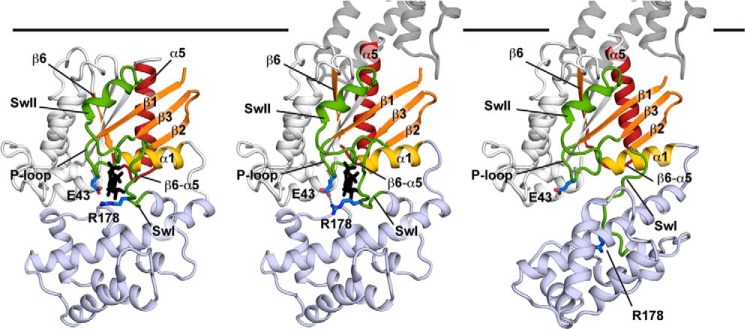
A model for allosteric Gα activation. Coloring is the same as Fig. 1, with the Glu-43 and Arg-178 side chains highlighted in blue. In the left panel, the GDP-bound Gα subunit is shown in its Gβγ-bound conformation (Gβγ omitted for clarity) and is based on the Gαi1βγ heterotrimer structure (PDB entry 1GP2 (16)). In the center panel the conformation of the C terminus of the Gα subunit is based on the K341L Gαt peptide-bound meta II costructure (PDB entry 3PQR (23)) with the conformation of the Gα subunit a hybrid between the GDP-bound K345L Gαi1 structure, and the receptor-bound Gαs structure (PDB entry 3SN6 (15)). In the right panel, the conformation of helical domain is from a computational model of the rhodopsin-Gt costructure (67) and is based on the direction of rotation observed in the receptor-bound Gαs structure (PDB entry 3SN6 (15)) and the magnitude of the rotation measured in site-directed spin labeling-double electron-electron resonance and electron microscopy studies (69, 79).
RESULTS
Basal and Receptor-mediated Nucleotide Exchange of the K345L Gαi1 Subunit
A hallmark of Gα subunits is the ability to exchange GDP for GTP. Recombinant Gαi1 activation was assessed by comparing normalized basal and receptor-mediated nucleotide exchange rates calculated from the increase in intrinsic tryptophan fluorescence upon the addition of the nonhydrolyzable GTP analog, GTPγS. The normalized K345L Gαi1 exchange rates were ∼30 and 20% slower under basal and receptor-mediated conditions, respectively, than wild-type Gαi1 (Fig. 2; Table 2).
FIGURE 2.
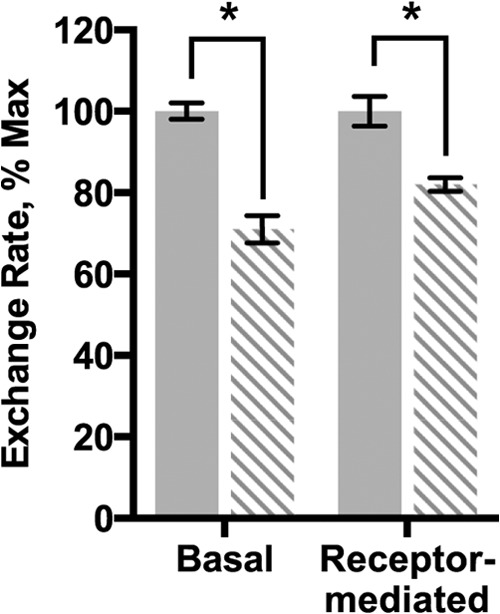
Nucleotide exchange rates in K345L Gαi1. Data shown are for wild-type (solid bars) and K345L (dashed bars) Gαi1. Basal and receptor-mediated nucleotide exchange rates were measured as a function of intrinsic fluorescence. Data presented here are relative to wild-type Gαi1, which was normalized to 100%. Results shown are the mean ± S.E. of three independent experiments (*, p < 0.05).
TABLE 2.
Results from biochemical characterizations of Gαi1 proteins
| Wild type | K345L | E43A | |
|---|---|---|---|
| Normalized nucleotide exchange rates | |||
| Basal (min−1) | 0.0180 ± 0.0006 | 0.0126 ± 0.0007 | 0.0176 ± 0.0005 |
| Δ rates (basal) | −30% | −2% | |
| Receptor-mediated (min−1) | 0.20 ± 0.01 | 0.164 ± 0.005 | 0.131 ± 0.005 |
| Δ rates (receptor-mediated) | −19% | −35% | |
| Rhodopsin binding affinity | |||
| Kd (μm) | 1.03 ± 0.10 | 1.86 ± 0.13 | 2.15 ± 0.69 |
| Δ Kd | −1.8-fold | −2.1-fold | |
| Thermostability | |||
| GDP-bound | |||
| Tm (°C) (NEB)a | 46.08 ± 0.02 | 43.19 ± 0.04 | 44.59 ± 0.01 |
| ΔTm | −2.89 | −1.49 | |
| Tm (°C) (EMB) | 46.79 ± 0.03 | 44.00 ± 0.07 | 44.77 ± 0.03 |
| ΔTm | −2.83 | −2.01 | |
| GTPγS-bound | |||
| Tm (°C) (NEB) | 67.65 ± 0.03 | 67.90 ± 0.02 | 66.01 ± 0.04 |
| ΔTm | 0.25 | −1.63 | |
| Tm (°C) (EMB) | 69.11 ± 0.03 | 69.20 ± 0.02 | 66.80 ± 0.04 |
| ΔTm | 0.09 | −2.30 | |
a NEB and EMB are two different buffers that are optimized for each of the functional assays, as described under “Experimental Procedures.” Thermostability was measured in each buffer to ensure that differences in functional measurements were not artifacts of buffer composition.
Binding and Activation of the K345L Gαi1β1γ1 by Rhodopsin
Receptor-catalyzed GDP release from Gα subunits depends on efficient coupling between GDP-bound Gαβγ and activated receptor to promote and stabilize the nucleotide-free state of Gα. The effect of the K345L mutation in the Gαi1 subunit on the ability of the G protein to couple to receptor was assessed by measuring the amount of reconstituted Gαi1β1γ1 bound to rhodopsin in ROS membranes (Fig. 3, A and B). Comparison of wild-type and K345L Gαi1 subunits recovered in the membrane-bound fraction after light activation revealed reduced binding of K345L Gαi1. Conversely, the relative amount of Gαi1 released into the soluble fraction after light activation was greater for K345L Gαi1. This indicates a lowered coupling efficiency of G protein containing the K345L Gαi1 with light-activated receptor.
FIGURE 3.
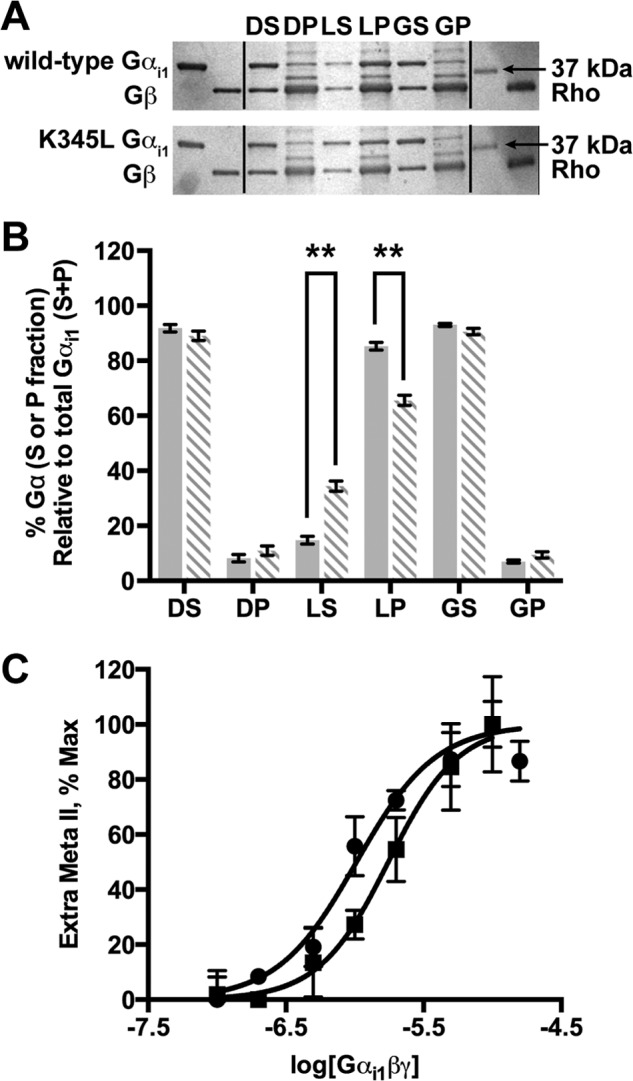
Rhodopsin affinity and coupling of wild-type and K345L Gαi1 subunits. A, SDS-PAGE of wild-type and K345L Gαi1 subunits reconstituted with Gβγ before binding ROS membranes in the dark, in the light, and after light activation after the addition of GTPγS. The left two lanes show the migration of Gαi1 and Gβ (from Gβγ) from purified standards. The right two lanes show the migration of the 37-kDa molecular weight protein standard and a purified rhodopsin standard. The Gαi1, Gβ, and rhodopsin standards can be used to identify bands of interest in the appropriate lanes. DS, supernatant from the dark-adapted sample; DP, pellet from the dark-adapted sample; LS, supernatant from the light-activated sample; LP, pellet from the light-activated sample; GS, supernatant from the light activated sample after the addition of GTPγS; GP, pellet from the light activated sample after the addition of GTPγS. B, densitometry quantitation of SDS-PAGE gels is shown as a percentage of the maximum protein loaded. Wild-type (solid bars) and K345L Gαi1 subunits (dashed bars). **, p < 0.01. C, rhodopsin affinity for Gαi1β1γ1 determined by the extra meta II assay for G protein containing wild-type (●) or K345L (■) Gαi1. Data are plotted as a function of the Gαi1β1γ1 concentration. Results shown are the mean ± S.E. of three independent experiments.
The extra meta II assay was used as a complementary method to clarify whether the lowered functional coupling efficiency was a result of reduced receptor affinity. Using this method, the affinity between activated receptor and wild-type or K345L Gαi1β1γ1 (Fig. 3C; Table 2) was quantified. The affinity between rhodopsin and wild-type Gαi1β1γ1 (Kd = 1.03 ± 0.10 μm) was found to be comparable to that previously determined by kinetic light scattering (Kd = 0.72 ± 0.05 μm) (26). The K345L Gαi1β1γ1 (Kd = 1.86 ± 0.13 μm) had a modestly reduced affinity.
The difference in affinity between peptide containing the K345L mutation (20) and intact protein harboring this sequence might have several origins. For example, the orientations of the bound peptide and the Gαs C terminus differ significantly in the opsin-Gαt peptide costructure and the β2-adrenergic-Gαs costructure (15, 22, 23) and could have different contacts. Accordingly, in silico modeling of rhodopsin bound to wild-type or K345L Gαi1 in the context of either a peptide or the intact subunit was based upon the opsin-Gαt peptide costructure (22) and the Gαs-β2-adrenergic receptor costructure (15), respectively. These calculations (not shown) did not offer an obvious explanation, such as steric clash or loss of hydrogen-bonding interactions, for the observed difference in affinity of the K345L mutation in the context of Gα subunits (26) versus the corollary C-terminal Gα peptide (20, 21). This prompted speculation that the allosteric network connecting receptor binding to nucleotide release had been modified.
Thermostability of the K345L Gαi1 Variant
To identify how the K345L Gαi1 substitution influences the stability of the nucleotide binding states of Gαi1, the thermostability of the wild-type and the K345L variant was measured in the presence of GDP (Fig. 4A; Table 2) or GTPγS (Fig. 4B; Table 2). Consistent with previous studies, both wild-type and K345L Gαi1 are more stable when bound to GTPγS than when bound to GDP (45–47). The Tm values for GTPγS-bound wild-type and K345L Gαi1 were statistically identical. In comparison, the Tm of the GDP-bound K345L Gαi1 variant was decreased by 2.89 ± 0.04 °C as compared with wild-type Gαi1 (Table 2) indicating that this substitution selectively destabilizes the GDP-bound state.
FIGURE 4.
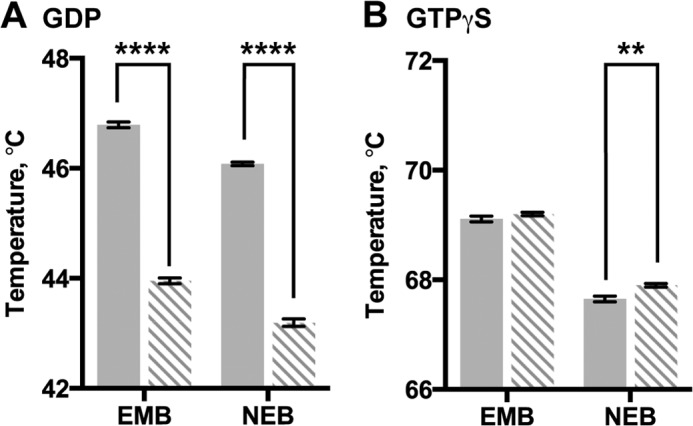
Thermostability of wild-type and K345L Gαi1 subunits. Fluorescence analysis of heat-induced melting of wild-type (solid bars) and K345L (dashed bars) Gαi1. Protein thermostability was measured in two different buffers (NEB or EMB) after incubation with GDP (A) or GTPγS (B). Results shown are the mean ± S.E. of three independent experiments (**, p < 0.01; ****, p < 0.0001).
Structures of the GTPγS- and GDP-bound K345L Gαi1 Subunit
To examine the architectural changes in the K345L Gαi1 variant, crystal structures in the GDP- and GTPγS-bound states were determined to 2.1 and 1.5 Å resolution, respectively (Table 1). The resolution of these structures is among the highest observed for any Gα subunit with each respective nucleotide. Superposition of corresponding backbone Cα atoms of GTPγS-bound K345L Gαi1 and GTPγS-bound wild-type Gαi1 (PDB entry 1GIA (47)) resulted in a root mean square deviation of 0.330 Å (308 Cα atoms aligned out of 321 total) suggesting little overall conformational change accompanied the mutation. It is notable that residues at the N and C termini that have not previously been resolved in crystal structures of GTPγS-bound Gαi1 proteins were clearly observed in the electron density in the current structure (Fig. 5, A and B). These additional residues contribute to the formation of an extended β1 strand at the N terminus (Fig. 5A) and assignment of the α5 helix C terminus to residue 351 (Fig. 5B). At this time it is unclear whether the observation of the residues at the termini is a direct result of the mutation or is caused by crystal-to-crystal variation.
Superposition of GDP-bound K345L Gαi1 and GDP-bound wild-type Gαi1 (PDB entry 1GDD (48)) resulted in a root mean square deviation of 0.473 Å between Cα atoms (321 Cα atoms aligned out of 330 total). Interestingly, the majority of the structural differences observed in the GDP-bound K345L Gαi1 structure occurred within functionally important motifs. The Switch regions in the GDP-bound K345L Gαi1 structure displayed the most significant conformational changes. The Switch I position was marked by an inward shift (Fig. 6A) as compared with wild type. This reorientation positioned Switch I in closer proximity to the α- and β-phosphates of the bound GDP. Accompanying the new position of Switch I in the K345L Gαi1 structure was the formation of a salt bridge (2.3 Å) between Arg-178 from Switch I and Glu-43 of the P-loop (Fig. 6B). Moreover, Switch II and III differed in both structure and orientation as compared with wild-type Gαi1. Although Switch II is still not completely visible, 5 of the 17 Switch II residues and two of the six Switch III residues that were not observed in GDP-bound wild-type Gαi1 were clearly resolved (Fig. 6C). Interestingly, these adopted a conformation that differed from GDP-bound Gαt (49) (Fig. 6D) and GTPγS-bound Gαi1 (47) (Fig. 6E). It is possible that the altered Switch I orientation and the P-loop/Switch I salt bridge observed in the GDP-bound K345L Gαi1 structure help promote these unique Switch II and Switch III conformations.
Validation of the Conformational Changes in the K345L Gαi1 as a Part of the Allosteric Network
The functional characterization presented here suggests that the K345L mutation stabilizes a transiently formed structural state sampled during Gαi1 activation. Consistent with the role of these conformations in allosteric signaling, most of the residues that adopt conformations different from wild-type Gαi1 have previously been mutagenized and exhibit altered signaling characteristics (18, 19, 50–53).
To further validate that the observed conformational changes are important for allosteric signaling, we selected Glu-43 as a target for mutagenesis. In the GDP-bound K345L Gαi1 structure, Glu-43 forms a salt bridge to Arg-178 that links the P-loop and Switch I (Fig. 6B). If this salt bridge is transiently formed in the wild-type Gαi1 subunit during physiological allosteric signaling, its alteration would be anticipated to reduce receptor-mediated nucleotide exchange rates. Biochemical analysis (Fig. 7A; Table 2) indeed showed a 35% reduction in receptor-mediated nucleotide exchange while leaving basal nucleotide exchange unaffected. As assessed by the meta II assay, the binding between the E43A Gαi1 variant and rhodopsin was reduced ∼2-fold (Kd = 2.15 ± 0.69 μm) (Fig. 7B; Table 2) but is still comparable to the affinity observed between rhodopsin and the K345L Gαi1 variant given the standard error of the measurement. The effect of this mutation on receptor binding and receptor-mediated activation, but not basal nucleotide exchange, is consistent with Glu-43 being a part of the allosteric network in wild-type Gαi1. The Tm of the E43A Gαi1 variant was reduced by a similar amount (∼2 °C) in the presence of either GDP or GTPγS (Fig. 7, C and D, Table 2). This equivalent reduction in thermodynamic stability may reflect loss of the salt bridge.
FIGURE 7.
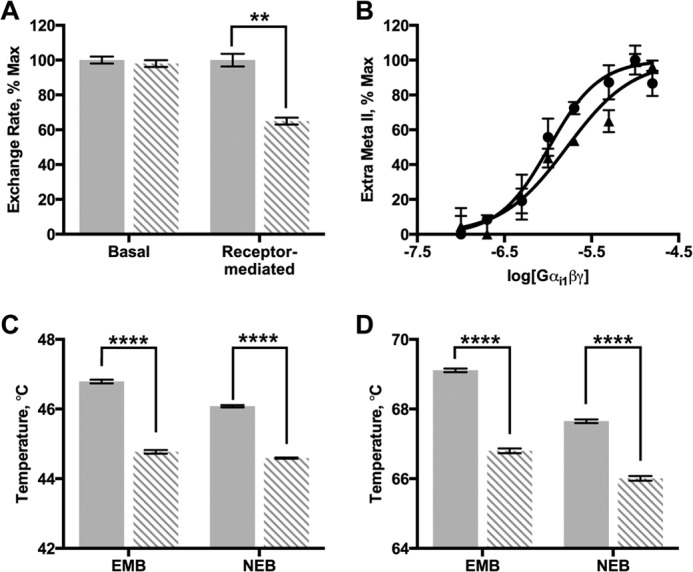
Biochemical properties of wild-type and E43A Gαi1. Data for E43A Gαi1 subunits are shown as dashed bars, data for wild-type Gαi1 subunits are shown as solid bars. A, basal and receptor-mediated nucleotide exchange rates measured as a function of intrinsic fluorescence. B, rhodopsin affinity for Gαi1β1γ1 determined by the extra meta II assay for wild-type (●) and E43A (▴) Gαi1β1γ1. C and D, fluorescence analysis of heat-induced melting of wild-type and E43A Gαi1. Protein sample in NEB or EMB buffer was incubated with GDP (C) or GTPγS (D). Results shown are the mean ± S.E. of at least two independent experiments (**, p < 0.01; ****, p < 0.0001).
DISCUSSION
The K345L Substitution in Gαi1 Influences the Guanine Nucleotide Binding States Differently
G proteins and cognate GPCRs mediate signaling via conformational changes in response to either bound guanine nucleotides or agonist, respectively. In GPCRs, it has been proposed that the signaling states are not necessarily discrete, but that most receptors instead adopt a continuum of conformations along an energy landscape (54), with crystal structures representing snapshots of transient states formed along the activation pathway (55–59). Indeed, many receptors exhibit basal activity, and these can spontaneously sample the active state in the absence of agonist (58, 60, 61). The analogous observation of basal nucleotide exchange in Gα subunits requires sampling of the nucleotide-free state in the absence of receptor. This suggests that G proteins similarly have intrinsic conformational heterogeneity that allows spontaneous sampling of multiple conformational states, albeit to a substantially lower extent. Subsequent biophysical investigations suggest that the nucleotide-free form of the G protein is the most conformationally dynamic and is destabilized relative to the GDP- or GTP-bound forms; however, it retains an intact fold competent for signaling (62–65).
Numerous transient conformational states may bridge the conversion between the GDP- and GTP-bound forms of the Gα subunit. The majority of published Gα mutations are associated with an increase in both intrinsic and receptor-mediated nucleotide exchange (for example, Refs. 18, 29, and 51–53)), which can result either from a shift of the conformational equilibrium to favor the nucleotide-free and GTP-bound states or from destabilization of the fold to result in spontaneous nucleotide release. In contrast, a reduction in both basal and receptor-mediated nucleotide exchange was observed in K345L Gαi1. The mechanistic basis for this reduction in nucleotide exchange could potentially be attributed to one of many physical changes, but cannot be ascribed to a destabilization of the fold.
One intriguing possibility is that this mutation has altered the energetic landscape between the nucleotide-bound states of Gα by shifting the stability of the allosteric states. Several lines of evidence suggest that Lys-345 is directly involved in the allosteric pathway linking receptor binding to GDP release in Gαi1 subunits. First, the K345L mutation has a 200-fold increase in receptor affinity in the context of a peptide (20) but a modestly lower affinity in the context of the intact Gα subunit (26). In silico modeling did not identify obvious physical phenomena that would explain this difference in affinity. Together, this suggests that the mutation instead reduces the ability of the G protein to bind receptor, possibly by decreasing the stability of the K345L Gαi1 subunit in the nucleotide-free state. In agreement with this interpretation, the nucleotide-exchange (Fig. 2) and receptor coupling results (Fig. 3) suggest that the K345L Gαi1 subunit is impaired in its ability to adopt the nucleotide-free state. The statistically significant decrease in Tm of the GDP-bound state of the K345L Gαi1 subunit suggests that this variant also disfavors the GDP-bound state as compared with wild type (Fig. 4A) and that only the GTP-bound state is unaffected by (Fig. 4B). Taken together, one interpretation of our measurements and modeling can be qualitatively conceptualized as a shifted energy diagram for the nucleotide binding states in K345L Gαi1 (Fig. 8).
FIGURE 8.
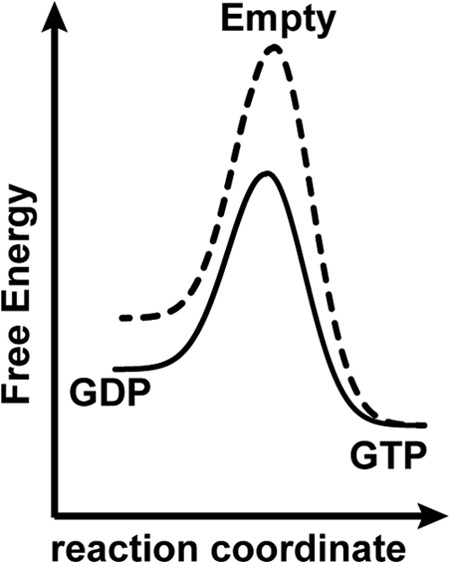
Qualitative model for the alteration of the stability in K345L Gαi1. A conceptual model for the relative free energy differences between nucleotide binding states in wild-type (solid line) and K345L (dashed line) Gαi1.
Structural Changes in GDP-bound K345L Gαi1 Identify Connections between Known Allosteric States
The mechanism of allosteric coupling of receptor binding to guanine nucleotide release in G proteins has been investigated by multiple methods (7, 15, 18, 19, 29, 50–53, 66–72). A hypothetical model summarizing both literature results and our results here is shown in Fig. 9 and supplemental Movie 1. One major focus in the field is the role of the α5 helix (Fig. 9, red), which is an extension of the Gα C terminus that connects the receptor binding surface to its nucleotide binding pocket. For example, site-directed spin labeling combined with EPR spectroscopy measurements (18, 19, 50) revealed changes in both mobility and solvent accessibility along the α5 helix upon receptor activation. These changes were attributed to a rigid-body rotation and translation motion adopted by the helix. Uncoupling of this motion from receptor interactions by the insertion of a glycine linker into the α5 helix abolished nucleotide exchange within the Gαi1 subunit (18, 68). In complementary studies cysteine mutagenesis was used to stabilize the position of the α5 helix in an activated conformation, which resulted in a dramatic increase in basal nucleotide exchange and suggested that the α5 helix dipole could contribute to GDP release (29). Finally, the structure of the β2-adrenergic receptor in complex with cognate Gαs showed a significant roto-translation of the α5 helix as compared with the position observed in any other structure of a Gα subunit (15).
Although the α5 helix has been the most extensively studied contributor to Gα activation, additional conformational changes have been identified using mutagenesis (67, 72, 73), biophysical (18, 69, 72), and computational approaches (71, 74, 75). Molecular dynamics simulations proposed that receptor recognition stabilizes the αN-β1 junction and the β2-β3 hairpin of the Gα subunit (74, 75), and fluorescence studies indeed revealed receptor-mediated changes in the solvent accessibility of these regions (7, 72) (Fig. 9, orange). Complimentary EPR studies revealed receptor-mediated changes in the mobility of spin labels on the β1, β2, and β6 strands of Gαi1 (Fig. 9, orange) (18, 50). Biochemical studies probing the α5/α1 helical junction also suggest a role for the α1 helix (Fig. 9, yellow) where its interaction with α5 assists in the destabilization of interactions between the nucleotide and the phosphate binding P-loop (Fig. 9, green) (52). Fluorescently labeled Gαi1 further exhibited receptor-dependent changes in the environments of the Switch I and Switch II elements (Fig. 9, green) consistent with variability during receptor-initiated nucleotide exchange (18, 69).
Our results identify a conformation of the Gαi1 subunit that we hypothesize may be transiently adopted during activation. In this conformation, the position of Switch I is stabilized by its interaction with the P-loop (Fig. 9, blue). A similar interaction is observed in structures of inhibited Gα subunits (76–78) and in the context of the Gβγ subunits (16, 17) prompting an analogy to a “seatbelt” that prevents GDP release (16). Consistent with the role of this interaction in controlling nucleotide release, the distance between the closest Glu-43Oϵ and Arg-178Nζ atoms lengthens under conditions that promote nucleotide exchange (75).
However, if the sole functional role of this interaction were to prevent GDP release, we would anticipate that the mutation of Glu-43 to alanine would dramatically increase receptor-mediated nucleotide exchange. Our observed reduction of receptor-mediated nucleotide exchange in the E43A Gαi1 subunit is thus initially counterintuitive. There are numerous possibilities for this unanticipated biochemical behavior. For example, significant denaturation or conversion of the E43A Gαi1 subunit to a nonfunctional state could have occurred over the time course of the experiments; however, we did not detect behaviors reflecting folding problems. Instead, we propose that the interaction between the P-loop and Switch I is a transient feature of Gα activation. Recent hydrogen-deuterium exchange measurements in Gαs are consistent with the hypothesis that this interaction is indeed a conformation of the receptor-associated Gα subunit before GDP release (76). Given the increased ordering of Switch I and Switch II in the structure of the GDP-bound K345L Gαi1 variant, we hypothesize that the formation of the salt bridge between Glu-43 and Arg-178 (Fig. 9, blue) stabilizes these loops before GDP release by receptor-associated Gαi1.
The final step in nucleotide release is rotation of the helical domain of the Gαi1 subunit away from the GTPase domain (Fig. 9, violet). Cross-linking of the GTPase and helical domains established that this domain separation is required for receptor-catalyzed nucleotide exchange (69). The magnitude and direction of the rotation is suggested by site-directed spin labeling-double electron-electron resonance (69), electron microscopy (79), and the crystal structure of the β2-adrenergic receptor in complex with cognate Gαs (15), respectively.
Conclusions
This study allows the connection of structural elements involved in nucleotide exchange in Gα subunits via a putative transient interaction between the P-loop and Switch I. We hypothesize that interaction between the P-loop and Switch I may stabilize the Gαi1 subunit before GDP release. Taken within the context of previous literature, these findings add to the known structural elements that contribute to the allosteric mechanism of GDP release from Gα subunits. The complexity of this process suggests that there must be precise coordination between numerous components of the Gα subunit.
Supplementary Material
Acknowledgments
We thank Dr. Ali I. Kaya both for assistance with the rhodopsin binding studies and for informative discussions, James Gilbert for assistance with Gβ1γ1 preparation, and Dr. Kathryn McCulloch and Chrystal Starbird for critical reading of this manuscript. Use of the Advanced Photon Source, an Office of Science User Facility operated for the United States Department of Energy Office of Science by Argonne National Laboratory, was supported by the United States Department of Energy under Contract DE-AC02-06CH11357. Use of the LS-CAT Sector 21 was supported by the Michigan Economic Development Corp. and the Michigan Technology Tri-Corridor (Grant 085P1000817).
This work was supported, in whole or in part, by National Institutes of Health Grants GM095633 (to T. M. I.), EY006062 (to H. E. H.), and P30EY008126 (a Vanderbilt Core Grant in Vision Research).

This article contains supplemental Movie 1.
The atomic coordinates and structure factors (codes 4N0D and 4N0E) have been deposited in the Protein Data Bank (http://wwpdb.org/).
- GPCR
- G protein-coupled receptor
- GTPγS
- guanosine 5′-[γ-thio]triphosphate
- EMB
- extra meta II buffer
- meta II
- metarhodopsin II
- NEB
- nucleotide exchange buffer
- P-loop
- phosphate binding loop
- ROS
- rod outer segment.
REFERENCES
- 1. Oldham W. M., Hamm H. E. (2008) Heterotrimeric G protein activation by G-protein-coupled receptors. Nat. Rev. Mol. Cell Biol. 9, 60–71 [DOI] [PubMed] [Google Scholar]
- 2. Itoh Y., Cai K., Khorana H. G. (2001) Mapping of contact sites in complex formation between light-activated rhodopsin and transducin by covalent cross-linking. use of a chemically preactivated reagent. Proc. Natl. Acad. Sci. U.S.A. 98, 4883–4887 [DOI] [PMC free article] [PubMed] [Google Scholar]
- 3. Hamm H. E., Deretic D., Arendt A., Hargrave P. A., Koenig B., Hofmann K. P. (1988) Site of G protein binding to rhodopsin mapped with synthetic peptides from the α subunit. Science 241, 832–835 [DOI] [PubMed] [Google Scholar]
- 4. Dratz E. A., Furstenau J. E., Lambert C. G., Thireault D. L., Rarick H., Schepers T., Pakhlevaniants S., Hamm H. E. (1993) NMR structure of a receptor-bound G-protein peptide. Nature 363, 276–281 [DOI] [PubMed] [Google Scholar]
- 5. Taylor J. M., Jacob-Mosier G. G., Lawton R. G., Remmers A. E., Neubig R. R. (1994) Binding of an α2 adrenergic receptor third intracellular loop peptide to Gβ and the amino terminus of Gα. J. Biol. Chem. 269, 27618–27624 [PubMed] [Google Scholar]
- 6. Ho M. K., Chan J. H., Wong C. S., Wong Y. H. (2004) Identification of a stretch of six divergent amino acids on the α5 helix of Gα16 as a major determinant of the promiscuity and efficiency of receptor coupling. Biochem. J. 380, 361–369 [DOI] [PMC free article] [PubMed] [Google Scholar]
- 7. Preininger A. M., Parello J., Meier S. M., Liao G., Hamm H. E. (2008) Receptor-mediated changes at the myristoylated amino terminus of Gαil proteins. Biochemistry 47, 10281–10293 [DOI] [PMC free article] [PubMed] [Google Scholar]
- 8. Mazzoni M. R., Hamm H. E. (1996) Interaction of transducin with light-activated rhodopsin protects It from proteolytic digestion by trypsin. J. Biol. Chem. 271, 30034–30040 [DOI] [PubMed] [Google Scholar]
- 9. Lichtarge O., Bourne H. R., Cohen F. E. (1996) Evolutionarily conserved Gαβγ binding surfaces support a model of the G protein-receptor complex. Proc. Natl. Acad. Sci. U.S.A. 93, 7507–7511 [DOI] [PMC free article] [PubMed] [Google Scholar]
- 10. Onrust R., Herzmark P., Chi P., Garcia P. D., Lichtarge O., Kingsley C., Bourne H. R. (1997) Receptor and βγ binding sites in the α subunit of the retinal G protein transducin. Science 275, 381–384 [DOI] [PubMed] [Google Scholar]
- 11. Bae H., Anderson K., Flood L. A., Skiba N. P., Hamm H. E., Graber S. G. (1997) Molecular determinants of selectivity in 5-hydroxytryptamine 1B receptor-G protein interactions. J. Biol. Chem. 272, 32071–32077 [DOI] [PubMed] [Google Scholar]
- 12. Bae H., Cabrera-Vera T. M., Depree K. M., Graber S. G., Hamm H. E. (1999) Two amino acids within the α4 helix of Gαi1 mediate coupling with 5-hydroxytryptamine 1B receptors. J. Biol. Chem. 274, 14963–14971 [DOI] [PubMed] [Google Scholar]
- 13. Cai K., Itoh Y., Khorana H. G. (2001) Mapping of contact sites in complex formation between transducin and light-activated rhodopsin by covalent cross-linking. Use of a photoactivatable reagent. Proc. Natl. Acad. Sci. U.S.A. 98, 4877–4882 [DOI] [PMC free article] [PubMed] [Google Scholar]
- 14. Grishina G., Berlot C. H. (2000) A surface-exposed region of Gαs in which substitutions decrease receptor-mediated activation and increase receptor affinity. Mol. Pharmacol. 57, 1081–1092 [PubMed] [Google Scholar]
- 15. Rasmussen S. G., DeVree B. T., Zou Y., Kruse A. C., Chung K. Y., Kobilka T. S., Thian F. S., Chae P. S., Pardon E., Calinski D., Mathiesen J. M., Shah S. T., Lyons J. A., Caffrey M., Gellman S. H., Steyaert J., Skiniotis G., Weis W. I., Sunahara R. K., Kobilka B. K. (2011) Crystal structure of the β2 adrenergic receptor-Gs protein complex. Nature 477, 549–555 [DOI] [PMC free article] [PubMed] [Google Scholar]
- 16. Wall M. A., Coleman D. E., Lee E., Iñiguez-Lluhi J. A., Posner B. A., Gilman A. G., Sprang S. R. (1995) The structure of the G protein heterotrimer Gi α1β1γ2. Cell 83, 1047–1058 [DOI] [PubMed] [Google Scholar]
- 17. Lambright D. G., Sondek J., Bohm A., Skiba N. P., Hamm H. E., Sigler P. B. (1996) The 2.0 angstrom crystal structure of a heterotrimeric G protein. Nature 379, 311–319 [DOI] [PubMed] [Google Scholar]
- 18. Oldham W. M., Van Eps N., Preininger A. M., Hubbell W. L., Hamm H. E. (2006) Mechanism of the receptor-catalyzed activation of heterotrimeric G proteins. Nat. Struct. Mol. Biol. 13, 772–777 [DOI] [PubMed] [Google Scholar]
- 19. Oldham W. M., Van Eps N., Preininger A. M., Hubbell W. L., Hamm H. E. (2007) Mapping allosteric connections from the receptor to the nucleotide-binding pocket of heterotrimeric G proteins. Proc. Natl. Acad. Sci. U.S.A. 104, 7927–7932 [DOI] [PMC free article] [PubMed] [Google Scholar]
- 20. Martin E. L., Rens-Domiano S., Schatz P. J., Hamm H. E. (1996) Potent peptide analogues of a G protein receptor-binding region obtained with a combinatorial library. J. Biol. Chem. 271, 361–366 [DOI] [PubMed] [Google Scholar]
- 21. Aris L., Gilchrist A., Rens-Domiano S., Meyer C., Schatz P. J., Dratz E. A., Hamm H. E. (2001) Structural requirements for the stabilization of metarhodopsin II by the C terminus of the α subunit of transducin. J. Biol. Chem. 276, 2333–2339 [DOI] [PubMed] [Google Scholar]
- 22. Scheerer P., Park J. H., Hildebrand P. W., Kim Y. J., Krauss N., Choe H. W., Hofmann K. P., Ernst O. P. (2008) Crystal structure of opsin in its G-protein-interacting conformation. Nature 455, 497–502 [DOI] [PubMed] [Google Scholar]
- 23. Choe H. W., Kim Y. J., Park J. H., Morizumi T., Pai E. F., Krauss N., Hofmann K. P., Scheerer P., Ernst O. P. (2011) Crystal structure of metarhodopsin II. Nature 471, 651–655 [DOI] [PubMed] [Google Scholar]
- 24. Standfuss J., Edwards P. C., D'Antona A., Fransen M., Xie G., Oprian D. D., Schertler G. F. (2011) The structural basis of agonist-induced activation in constitutively active rhodopsin. Nature 471, 656–660 [DOI] [PMC free article] [PubMed] [Google Scholar]
- 25. Deupi X., Edwards P., Singhal A., Nickle B., Oprian D., Schertler G., Standfuss J. (2012) Stabilized G protein binding site in the structure of constitutively active metarhodopsin-II. Proc. Natl. Acad. Sci. U.S.A. 109, 119–124 [DOI] [PMC free article] [PubMed] [Google Scholar]
- 26. Herrmann R., Heck M., Henklein P., Kleuss C., Wray V., Hofmann K. P., Ernst O. P. (2006) Rhodopsin-transducin coupling. Role of the Gα C-terminus in nucleotide exchange catalysis. Vision Res. 46, 4582–4593 [DOI] [PubMed] [Google Scholar]
- 27. Skiba N. P., Bae H., Hamm H. E. (1996) Mapping of effector binding sites of transducin α-subunit using Gαt/Gαi1 chimeras. J. Biol. Chem. 271, 413–424 [DOI] [PubMed] [Google Scholar]
- 28. Thaker T. M., Kaya A. I., Preininger A. M., Hamm H. E., Iverson T. M. (2012) Allosteric mechanisms of G protein-coupled receptor signaling. A structural perspective. Methods Mol. Biol. 796, 133–174 [DOI] [PMC free article] [PubMed] [Google Scholar]
- 29. Preininger A. M., Funk M. A., Oldham W. M., Meier S. M., Johnston C. A., Adhikary S., Kimple A. J., Siderovski D. P., Hamm H. E., Iverson T. M. (2009) Helix dipole movement and conformational variability contribute to allosteric GDP release in Gαi subunits. Biochemistry 48, 2630–2642 [DOI] [PMC free article] [PubMed] [Google Scholar]
- 30. Friesner R. A., Murphy R. B., Repasky M. P., Frye L. L., Greenwood J. R., Halgren T. A., Sanschagrin P. C., Mainz D. T. (2006) Extra precision glide. Docking and scoring incorporating a model of hydrophobic enclosure for protein-ligand complexes. J. Med. Chem. 49, 6177–6196 [DOI] [PubMed] [Google Scholar]
- 31. Jacobson M. P., Friesner R. A., Xiang Z., Honig B. (2002) On the role of the crystal environment in determining protein side-chain conformations. J. Mol. Biol. 320, 597–608 [DOI] [PubMed] [Google Scholar]
- 32. Jacobson M. P., Pincus D. L., Rapp C. S., Day T. J., Honig B., Shaw D. E., Friesner R. A. (2004) A hierarchical approach to all-atom protein loop prediction. Proteins 55, 351–367 [DOI] [PubMed] [Google Scholar]
- 33. Banks J. L., Beard H. S., Cao Y., Cho A. E., Damm W., Farid R., Felts A. K., Halgren T. A., Mainz D. T., Maple J. R., Murphy R., Philipp D. M., Repasky M. P., Zhang L. Y., Berne B. J., Friesner R. A., Gallicchio E., Levy R. M. (2005) Integrated Modeling Program, Applied Chemical Theory (IMPACT). J. Comput. Chem. 26, 1752–1780 [DOI] [PMC free article] [PubMed] [Google Scholar]
- 34. Li J., Abel R., Zhu K., Cao Y., Zhao S., Friesner R. A. (2011) The VSGB 2.0 model. A next generation energy model for high resolution protein structure modeling. Proteins 79, 2794–2812 [DOI] [PMC free article] [PubMed] [Google Scholar]
- 35. Emsley P., Cowtan K. (2004) Coot. Model-building tools for molecular graphics. Acta Crystallogr. D Biol. Crystallogr. 60, 2126–2132 [DOI] [PubMed] [Google Scholar]
- 36. Niesen F. H., Berglund H., Vedadi M. (2007) The use of differential scanning fluorimetry to detect ligand interactions that promote protein stability. Nat. Protoc. 2, 2212–2221 [DOI] [PubMed] [Google Scholar]
- 37. Morikawa T., Muroya A., Nakajima Y., Tanaka T., Hirai K., Sugio S., Wakamatsu K., Kohno T. (2007) Crystallization and preliminary x-ray crystallographic analysis of the receptor-uncoupled mutant of Gαi1. Acta Crystallogr. Sect. F Struct. Biol. Cryst. Commun. 63, 139–141 [DOI] [PMC free article] [PubMed] [Google Scholar]
- 38. Otwinowski Z., Minor W. (1997) Processing of x-ray diffraction data collected in oscillation mode. Method Enzymol. 276, 307–326 [DOI] [PubMed] [Google Scholar]
- 39. McCoy A. J., Grosse-Kunstleve R. W., Adams P. D., Winn M. D., Storoni L. C., Read R. J. (2007) Phaser crystallographic software. J. Appl. Crystallogr. 40, 658–674 [DOI] [PMC free article] [PubMed] [Google Scholar]
- 40. Adams P. D., Afonine P. V., Bunkóczi G., Chen V. B., Davis I. W., Echols N., Headd J. J., Hung L. W., Kapral G. J., Grosse-Kunstleve R. W., McCoy A. J., Moriarty N. W., Oeffner R., Read R. J., Richardson D. C., Richardson J. S., Terwilliger T. C., Zwart P. H. (2010) PHENIX. A comprehensive Python-based system for macromolecular structure solution. Acta Crystallogr. D Biol. Crystallogr. 66, 213–221 [DOI] [PMC free article] [PubMed] [Google Scholar]
- 41. Laskowski R. A., MacArthur M. W., Moss D. S., Thornton J. M. (1993) Procheck. A program to check the stereochemical quality of protein structures. J. Appl. Crystallogr. 26, 283–291 [Google Scholar]
- 42. Chen V. B., Arendall W. B., 3rd, Headd J. J., Keedy D. A., Immormino R. M., Kapral G. J., Murray L. W., Richardson J. S., Richardson D. C. (2010) MolProbity. All-atom structure validation for macromolecular crystallography. Acta Crystallogr. D Biol. Crystallogr. 66, 12–21 [DOI] [PMC free article] [PubMed] [Google Scholar]
- 43. DeLano W. L. (2010) The PyMOL Molecular Graphics System, Version 1.3r1, Schrodinger, LLC, New York [Google Scholar]
- 44. Pettersen E. F., Goddard T. D., Huang C. C., Couch G. S., Greenblatt D. M., Meng E. C., Ferrin T. E. (2004) UCSF chimera. A visualization system for exploratory research and analysis. J. Comput. Chem. 25, 1605–1612 [DOI] [PubMed] [Google Scholar]
- 45. Sondek J., Lambright D. G., Noel J. P., Hamm H. E., Sigler P. B. (1994) GTPase mechanism of G proteins from the 1.7 Å crystal structure of transducin α-GDP-AIF-4. Nature 372, 276–279 [DOI] [PubMed] [Google Scholar]
- 46. Noel J. P., Hamm H. E., Sigler P. B. (1993) The 2.2 Å crystal structure of transducin-α complexed with GTPγS. Nature 366, 654–663 [DOI] [PubMed] [Google Scholar]
- 47. Coleman D. E., Berghuis A. M., Lee E., Linder M. E., Gilman A. G., Sprang S. R. (1994) Structures of active conformations of Gi α1 and the mechanism of GTP hydrolysis. Science 265, 1405–1412 [DOI] [PubMed] [Google Scholar]
- 48. Mixon M. B., Lee E., Coleman D. E., Berghuis A. M., Gilman A. G., Sprang S. R. (1995) Tertiary and quaternary structural changes in Gi α1 induced by GTP hydrolysis. Science 270, 954–960 [DOI] [PubMed] [Google Scholar]
- 49. Lambright D. G., Noel J. P., Hamm H. E., Sigler P. B. (1994) Structural determinants for activation of the α-subunit of a heterotrimeric G protein. Nature 369, 621–628 [DOI] [PubMed] [Google Scholar]
- 50. Van Eps N., Oldham W. M., Hamm H. E., Hubbell W. L. (2006) Structural and dynamical changes in an α-subunit of a heterotrimeric G protein along the activation pathway. Proc. Natl. Acad. Sci. U.S.A. 103, 16194–16199 [DOI] [PMC free article] [PubMed] [Google Scholar]
- 51. Posner B. A., Mixon M. B., Wall M. A., Sprang S. R., Gilman A. G. (1998) The A326S mutant of Gi α1 as an approximation of the receptor-bound state. J. Biol. Chem. 273, 21752–21758 [DOI] [PubMed] [Google Scholar]
- 52. Kapoor N., Menon S. T., Chauhan R., Sachdev P., Sakmar T. P. (2009) Structural evidence for a sequential release mechanism for activation of heterotrimeric G proteins. J. Mol. Biol. 393, 882–897 [DOI] [PubMed] [Google Scholar]
- 53. Singh G., Ramachandran S., Cerione R. A. (2012) A constitutively active Gα subunit provides insights into the mechanism of G protein activation. Biochemistry 51, 3232–3240 [DOI] [PMC free article] [PubMed] [Google Scholar]
- 54. Deupi X., Kobilka B. K. (2010) Energy landscapes as a tool to integrate GPCR structure, dynamics, and function. Physiology 25, 293–303 [DOI] [PMC free article] [PubMed] [Google Scholar]
- 55. Rasmussen S. G., Choi H. J., Rosenbaum D. M., Kobilka T. S., Thian F. S., Edwards P. C., Burghammer M., Ratnala V. R., Sanishvili R., Fischetti R. F., Schertler G. F., Weis W. I., Kobilka B. K. (2007) Crystal structure of the human β2 adrenergic G-protein-coupled receptor. Nature 450, 383–387 [DOI] [PubMed] [Google Scholar]
- 56. Rosenbaum D. M., Zhang C., Lyons J. A., Holl R., Aragao D., Arlow D. H., Rasmussen S. G., Choi H. J., Devree B. T., Sunahara R. K., Chae P. S., Gellman S. H., Dror R. O., Shaw D. E., Weis W. I., Caffrey M., Gmeiner P., Kobilka B. K. (2011) Structure and function of an irreversible agonist-β2 adrenoceptor complex. Nature 469, 236–240 [DOI] [PMC free article] [PubMed] [Google Scholar]
- 57. Rasmussen S. G., Choi H. J., Fung J. J., Pardon E., Casarosa P., Chae P. S., Devree B. T., Rosenbaum D. M., Thian F. S., Kobilka T. S., Schnapp A., Konetzki I., Sunahara R. K., Gellman S. H., Pautsch A., Steyaert J., Weis W. I., Kobilka B. K. (2011) Structure of a nanobody-stabilized active state of the β2 adrenoceptor. Nature 469, 175–180 [DOI] [PMC free article] [PubMed] [Google Scholar]
- 58. Nygaard R., Zou Y., Dror R. O., Mildorf T. J., Arlow D. H., Manglik A., Pan A. C., Liu C. W., Fung J. J., Bokoch M. P., Thian F. S., Kobilka T. S., Shaw D. E., Mueller L., Prosser R. S., Kobilka B. K. (2013) The dynamic process of β2-adrenergic receptor activation. Cell 152, 532–542 [DOI] [PMC free article] [PubMed] [Google Scholar]
- 59. Ring A. M., Manglik A., Kruse A. C., Enos M. D., Weis W. I., Garcia K. C., Kobilka B. K. (2013) Adrenaline-activated structure of β2-adrenoceptor stabilized by an engineered nanobody. Nature 502, 575–579 [DOI] [PMC free article] [PubMed] [Google Scholar]
- 60. Katritch V., Cherezov V., Stevens R. C. (2012) Diversity and modularity of G protein-coupled receptor structures. Trends Pharmacol. Sci. 33, 17–27 [DOI] [PMC free article] [PubMed] [Google Scholar]
- 61. Katritch V., Cherezov V., Stevens R. C. (2013) Structure-function of the G protein-coupled receptor superfamily. Annu. Rev. Pharmacol. Toxicol. 53, 531–556 [DOI] [PMC free article] [PubMed] [Google Scholar]
- 62. Zelent B., Veklich Y., Murray J., Parkes J. H., Gibson S., Liebman P. A. (2001) Rapid irreversible G protein α subunit misfolding due to intramolecular kinetic bottleneck that precedes Mg2+ “lock” after GTP/GDP exchange. Biochemistry 40, 9647–9656 [DOI] [PubMed] [Google Scholar]
- 63. Ridge K. D., Marino J. P., Ngo T., Ramon E., Brabazon D. M., Abdulaev N. G. (2006) NMR analysis of rhodopsin-transducin interactions. Vision Res. 46, 4482–4492 [DOI] [PubMed] [Google Scholar]
- 64. Abdulaev N. G., Ngo T., Ramon E., Brabazon D. M., Marino J. P., Ridge K. D. (2006) The receptor-bound “empty pocket” state of the heterotrimeric G-protein α-subunit is conformationally dynamic. Biochemistry 45, 12986–12997 [DOI] [PubMed] [Google Scholar]
- 65. Thomas C. J., Briknarová K., Hilmer J. K., Movahed N., Bothner B., Sumida J. P., Tall G. G., Sprang S. R. (2011) The nucleotide exchange factor Ric-8A is a chaperone for the conformationally dynamic nucleotide-free state of Gαi1. PLoS ONE 6, e23197. [DOI] [PMC free article] [PubMed] [Google Scholar]
- 66. Marin E. P., Krishna A. G., Archambault V., Simuni E., Fu W. Y., Sakmar T. P. (2001) The function of interdomain interactions in controlling nucleotide exchange rates in transducin. J. Biol. Chem. 276, 23873–23880 [DOI] [PubMed] [Google Scholar]
- 67. Marin E. P., Krishna A. G., Sakmar T. P. (2001) Rapid activation of transducin by mutations distant from the nucleotide-binding site. Evidence for a mechanistic model of receptor-catalyzed nucleotide exchange by G proteins. J. Biol. Chem. 276, 27400–27405 [DOI] [PubMed] [Google Scholar]
- 68. Marin E. P., Krishna A. G., Sakmar T. P. (2002) Disruption of the α5 helix of transducin impairs rhodopsin-catalyzed nucleotide exchange. Biochemistry 41, 6988–6994 [DOI] [PubMed] [Google Scholar]
- 69. Van Eps N., Preininger A. M., Alexander N., Kaya A. I., Meier S., Meiler J., Hamm H. E., Hubbell W. L. (2011) Interaction of a G protein with an activated receptor opens the interdomain interface in the α subunit. Proc. Natl. Acad. Sci. U.S.A. 108, 9420–9424 [DOI] [PMC free article] [PubMed] [Google Scholar]
- 70. Preininger A. M., Kaya A. I., Gilbert J. A., 3rd, Busenlehner L. S., Armstrong R. N., Hamm H. E. (2012) Myristoylation exerts direct and allosteric effects on Gα conformation and dynamics in solution. Biochemistry 51, 1911–1924 [DOI] [PMC free article] [PubMed] [Google Scholar]
- 71. Preininger A. M., Meiler J., Hamm H. E. (2013) Conformational flexibility and structural dynamics in GPCR-mediated G protein activation. A perspective. J. Mol. Biol. 425, 2288–2298 [DOI] [PMC free article] [PubMed] [Google Scholar]
- 72. Hamm H. E., Kaya A. I., Gilbert J. A., 3rd, Preininger A. M. (2013) Linking receptor activation to changes in Sw I and II of Gα proteins. J. Struct. Biol. 184, 63–74 [DOI] [PMC free article] [PubMed] [Google Scholar]
- 73. Herrmann R., Heck M., Henklein P., Hofmann K. P., Ernst O. P. (2006) Signal transfer from GPCRs to G proteins. Role of the Gα N-terminal region in rhodopsin-transducin coupling. J. Biol. Chem. 281, 30234–30241 [DOI] [PubMed] [Google Scholar]
- 74. Ceruso M. A., Periole X., Weinstein H. (2004) Molecular dynamics simulations of transducin. Interdomain and front to back communication in activation and nucleotide exchange. J. Mol. Biol. 338, 469–481 [DOI] [PubMed] [Google Scholar]
- 75. Kling R. C., Lanig H., Clark T., Gmeiner P. (2013) Active-state models of ternary GPCR complexes. Determinants of selective receptor-G-protein coupling. PLoS ONE 8, e67244. [DOI] [PMC free article] [PubMed] [Google Scholar]
- 76. Coleman D. E., Sprang S. R. (1999) Structure of Gi α1·GppNHp, autoinhibition in a Gα protein-substrate complex. J. Biol. Chem. 274, 16669–16672 [DOI] [PubMed] [Google Scholar]
- 77. Kimple R. J., Kimple M. E., Betts L., Sondek J., Siderovski D. P. (2002) Structural determinants for GoLoco-induced inhibition of nucleotide release by Gα subunits. Nature 416, 878–881 [DOI] [PubMed] [Google Scholar]
- 78. Thomas C. J., Du X., Li P., Wang Y., Ross E. M., Sprang S. R. (2004) Uncoupling conformational change from GTP hydrolysis in a heterotrimeric G protein α-subunit. Proc. Natl. Acad. Sci. U.S.A. 101, 7560–7565 [DOI] [PMC free article] [PubMed] [Google Scholar]
- 79. Westfield G. H., Rasmussen S. G., Su M., Dutta S., DeVree B. T., Chung K. Y., Calinski D., Velez-Ruiz G., Oleskie A. N., Pardon E., Chae P. S., Liu T., Li S., Woods V. L., Jr., Steyaert J., Kobilka B. K., Sunahara R. K., Skiniotis G. (2011) Structural flexibility of the Gαs α-helical domain in the β2-adrenoceptor Gs complex. Proc. Natl. Acad. Sci. U.S.A. 108, 16086–16091 [DOI] [PMC free article] [PubMed] [Google Scholar]
Associated Data
This section collects any data citations, data availability statements, or supplementary materials included in this article.