

Background: The structure of TREX1 exonuclease identifies key residues positioned at the stable dimer interface.
Results: The TREX1 Arg-62 acts across the dimer interface to affect DNA binding and catalysis in the opposing protomer.
Conclusion: TREX1 is a functional dimer.
Significance: These data help us understand how heterozygous TREX1 mutations can contribute to disease.
Keywords: Autoimmune Diseases, DNA, DNase, Enzyme Mechanisms, Nucleic Acid, TREX1, Dimer, Exonuclease
Abstract
TREX1 is a 3′-deoxyribonuclease that degrades single- and double-stranded DNA (ssDNA and dsDNA) to prevent inappropriate nucleic acid-mediated immune activation. More than 40 different disease-causing TREX1 mutations have been identified exhibiting dominant and recessive genetic phenotypes in a spectrum of autoimmune disorders. Mutations in TREX1 at positions Asp-18 and Asp-200 to His and Asn exhibit dominant autoimmune phenotypes associated with the clinical disorders familial chilblain lupus and Aicardi-Goutières syndrome. Our previous biochemical studies showed that the TREX1 dominant autoimmune disease phenotype depends upon an intact DNA-binding process coupled with dysfunctional active site chemistry. Studies here show that the TREX1 Arg-62 residues extend across the dimer interface into the active site of the opposing protomer to coordinate substrate DNA and to affect catalysis in the opposing protomer. The TREX1R62A/R62A homodimer exhibits ∼50-fold reduced ssDNA and dsDNA degradation activities relative to TREX1WT. The TREX1 D18H, D18N, D200H, and D200N dominant mutant enzymes were prepared as compound heterodimers with the TREX1 R62A substitution in the opposing protomer. The TREX1D18H/R62A, TREX1D18N/R62A, TREX1D200H/R62A, and TREX1D200N/R62A compound heterodimers exhibit higher levels of ss- and dsDNA degradation activities than the homodimers demonstrating the requirement for TREX1 Arg-62 residues to provide necessary structural elements for full catalytic activity in the opposing TREX1 protomer. This concept is further supported by the loss of dominant negative effects in the TREX1 D18H, D18N, D200H, and D200N compound heterodimers. These data provide compelling evidence for the required TREX1 dimeric structure for full catalytic function.
Introduction
The TREX1 gene has a simple single open reading frame structure that maps to chromosome 3p21.31 and encodes the most active 3′→5′-exonuclease in multiple mammalian tissues (1–7). Mutations in the TREX1 gene have now been identified to cause a spectrum of autoimmune disorders, including Aicardi-Goutières syndrome (AGS),2 Cree encephalitis, familial chilblain lupus (FCL), retinal vasculopathy with cerebral leukodystrophy, and are associated with systemic lupus erythematosus (8–25). Genetic discoveries from these autoimmune disease patients have now identified more than 40 different TREX1 disease-causing and -associated mutations that exhibit dominant and recessive genetics and occur as inherited or de novo mutations, dependent upon the specific mutant allele. The TREX1 disease alleles include missense mutations, insertions, duplications, and frame shifts that locate to positions throughout the 314-amino acid-coding gene. These findings have established a causal relationship between TREX1 genetic variants and multiple mechanisms of TREX1 enzyme dysfunction that might explain the spectrum of human autoimmune disorders with overlapping clinical symptoms related to TREX1 DNA degradation and immune activation.
The TREX1 enzyme contains an N-terminal 242 amino acids with all of the necessary structural elements for full catalytic activity and a C-terminal region of 72 amino acids required for cytosolic localization to the perinuclear space (20, 23, 26). The TREX1 exonuclease degrades ssDNA polynucleotides and the nicked polynucleotide strands of dsDNA molecules with catalytic efficiencies that approach enzymatic limits (7, 27, 28). The TREX1 mutant enzymes that cause human disease exhibit a broad range of DNA degradation activities that vary from levels indistinguishable from WT to those diminished by more than five orders of magnitude, with the levels of diminished activities being dependent upon DNA structure (13, 14, 20, 23, 28–30). The specific TREX1 disease-causing mutations can result in either diminished catalytic function or altered post-translational modification and cellular localization (20, 23, 31). These varied effects exhibited by TREX1 mutant enzymes on catalytic function and cellular localization might be reconciled with the diversity of human disease pathogenesis to help explain the precise role of TREX1 in DNA degradation to prevent inappropriate immune activation.
The TREX1 enzyme has a uniquely stable dimeric structure that is relevant to its function and to disease mechanisms in individuals carrying mutant alleles. The TREX1 R114H is one of the most frequently found mutations that causes AGS in homozygous and compound heterozygous genotypes and is found as a heterozygous mutation in systemic lupus erythematosus (8, 14, 17, 25). The TREX1 Arg-114 residue is ∼15 Å away from the active site and forms side chain-backbone interactions across the dimer interface, contributing to the catalytic function of the opposing protomer and helping to explain the immune dysfunction phenotype in the R114H heterozygous individual (28, 29). The stable dimeric structure contributes to the FCL and AGS-dominant disease phenotypes in the TREX1 Asp-18 and Asp-200 active site mutations through the actions of a catalytically deficient protomer that retains DNA binding proficiency and blocks access to the DNA by TREX1WT enzyme (28, 30). Additionally, heterozygous TREX1 mutations in systemic lupus erythematosus (23, 25) and retinal vasculopathy with cerebral leukodystrophy (20) locate outside the catalytic domain in the C-terminal region potentially leading to dominant non-catalytic dysfunction related to cellular localization or protein interactions exacerbated by the stability of the dimer structure.
The relevance of TREX1 structure and biochemistry to nucleic acid-mediated disease prompted the studies presented here to better understand the relationships between TREX1 mutation and disease phenotype. In addition to Arg-114, the TREX1 structure reveals residues positioned at the dimer interface such as Arg-62 that have not yet been identified as positions of disease-causing mutations but might contribute to enzyme activity through inter-protomer coordination (26, 32). The studies here test the hypothesis that the conserved TREX1 Arg-62 residues extend across the dimer interface and contribute to catalysis in the active site of the opposing protomer specifically through DNA binding. The activities of TREX1 R62A-containing homodimers, heterodimers, and compound heterodimers were compared with TREX1WT using quantitative ss- and dsDNA degradation assays. The DNA degradation activities and DNA binding measured in the TREX1 R62A-containing mutants demonstrate that Arg-62 from one TREX1 protomer contributes to DNA degradation in the opposing protomer. These results show that the mechanism of the TREX1 Arg-62 “across the dimer interface” contribution is through DNA binding in the opposing protomer.
EXPERIMENTAL PROCEDURES
Materials
The synthetic 30-mer oligonucleotide 5′-ATACGACGGTGACAGTGTTGTCAGACAGGT-3′ with 5′-fluorescein was from Operon. The plasmid derived from p-MYC (New England Biolabs) contained one Nt.BbvCI site, and the pUC57 plasmid (Genewiz) contained one Nt.Bsp.QI site. The plasmids were purified from bacterial cultures using Qiagen kits. The singly nicked dsDNA oligonucleotide used for equilibrium-binding studies was constructed by annealing a synthetic 90-mer to two complementary 45-mer oligonucleotides (Operon). The 90-mer and the 3′-positioned 45-mer contained 3′-phosphate groups to block TREX1 and the 5′-positioned 45-mer contained a 5′-FAM or was unlabeled. Oligonucleotides were annealed in 5 mm MES (pH 6.5), 20 mm NaCl, and 5 mm MgCl2 to generate the singly nicked dsDNA oligonucleotide.
Enzyme Preparation
The human recombinant TREX1 enzymes were expressed in bacteria and purified as stable homo- or heterodimers as described (28–30). Aliquots (3 μg) of the TREX1 preparations were analyzed by 12% SDS-PAGE and visualized by Coomassie Blue staining. Gel images were generated using a ChemiDoc XRS Gel documentation system (Bio-Rad) and scanned using ImageQuant TL (version 7.0) to obtain densitometric profiles and to determine the final TREX1 protein concentrations.
Exonuclease Assays
The exonuclease reactions contained 20 mm Tris-HCl (pH 7.5), 5 mm MgCl2, 2 mm dithiothreitol, 100 μg/ml bovine serum albumin, 50 nm fluorescein-labeled 30-mer oligonucleotide (ssDNA assays) or 10 μg/ml plasmid DNA (dsDNA assays), and TREX1 protein as indicated in the Figs. 2–7. The TREX1 enzyme and variant mixtures in the competition assays were prepared on ice at 10× the final concentrations to allow the addition of TREX1 dimer mixtures simultaneously to reactions yielding the indicated final concentrations. Reactions were incubated at 25 °C for 30 min or as indicated and subsequently quenched by the addition of 3 volumes of ethanol and dried in vacuo. For ssDNA assays, the reaction products were resuspended in 4 μl of formamide and separated on 23% denaturing polyacrylamide gels. Fluorescently labeled bands were visualized and quantified using a Typhoon FLA 9500 Biomolecular Imager (GE Healthcare). The fraction of oligomer at each position was multiplied by the number of dNMPs excised from the 30-mer and by the total fmol of 30-mer in the starting reaction to determine the activities for TREX1WT and variants (fmol of dNMP/s/fmol of enzyme).
FIGURE 2.

The ssDNA exonuclease activities of the TREX1 R62A-containing enzymes. Standard exonuclease reactions (30 μl) were prepared with a fluorescein-labeled 30-mer oligonucleotide and dilutions of the recombinant TREX1WT, TREX1R62A/R62A, and TREX1WT/R62A were prepared at 10 times the final concentrations. Samples (3 μl) containing the TREX1 enzymes to yield the final indicated concentrations were added to reactions. The incubations were 30 min at 25 °C. The reaction products were subjected to electrophoresis on 23% urea-polyacrylamide gels (A), quantified, and relative activities were calculated (B) as described under “Experimental Procedures.” The position of migration of the 30-mer is indicated.
FIGURE 3.

The dsDNA exonuclease activities of the TREX1 R62A-containing enzymes. Exonuclease reactions (20 μl) were prepared containing un-nicked supercoiled dsDNA plasmid (pUC57) (A, lane 1), nicked-dsDNA plasmid (pUC57) and and no enzyme (A, lanes 2, 4, and 7), or the indicated concentration of TREX1WT (A, lane 3), TREX1R62A/R62A (A, lanes 5 and 6), or TREX1WT/R62A (A, lane 8). The reactions were 30 min at 25 °C, and products were subjected to agarose gel electrophoresis (A). The positions of migration of form II (Nicked dsDNA) and circular ssDNA (ssDNA) are indicated. The average activities and S.E. (B) were determined by regression analysis using Excel 2007 (Microsoft), and relative activities were calculated as described under “Experimental Procedures.”
FIGURE 4.

The ssDNA exonuclease activities of the TREX1 D18H-containing dominant mutant enzymes. Standard exonuclease reactions (30 μl) were prepared with a fluorescein-labeled 30-mer oligonucleotide and dilutions of the recombinant TREX1WT, TREX1D18H/D18H, and TREX1WT/D18H were prepared at 10 times the final concentrations. Samples (3 μl) containing the TREX1 enzymes to yield the final indicated concentrations were added to reactions. The incubations were 30 min at 25 °C. The reaction products were subjected to electrophoresis on 23% urea-polyacrylamide gels (A) and quantified, and relative activities were calculated (B) as described under “Experimental Procedures.” The position of migration of the 30-mer is indicated.
FIGURE 5.

The dsDNA exonuclease activities of TREX1 compound heterodimers containing the R62A protomer and a dominant mutant protomer. A, standard exonuclease reactions (20 μl) were prepared containing nicked dsDNA plasmid (pUC57) and no enzyme (A, lane 1) or 250 nm of the indicated TREX1 enzyme (A, lanes 2–10). The reactions were 30 min at 25 °C, and products were subjected to agarose gel electrophoresis and visualized by ethidium bromide staining. B, exonuclease time course reactions (90 μl) were prepared containing nicked dsDNA plasmid (p-Myc) and 100 nm of the indicated TREX1 enzyme. Samples (20 μl) were removed prior to enzyme addition (0 min) and after incubation for the indicated times. The reaction products were quenched in 15x_SYBR Green and dsDNA remaining was determined by emission at 520 nm as described under “Experimental Procedures.” No Enz, no enzyme.
FIGURE 6.

The inhibition of TREX1WT dsDNA degradation activity by D18H- and R62A-containing enzymes. The exonuclease reactions (20 μl) were prepared containing nicked-dsDNA plasmid (pUC57) and no enzyme (lane 1), the indicated concentration of TREX1WT only (lane 2), or a mixture of TREX1WT with the indicated concentrations of TREX1D18H/D18H (lane 3), TREX1WT/D18H (lane 4), TREX1R62A/R62A (lane 5), or TREX1WT/R62A (lane 6). The reactions were 30 min at 25 °C, and products were subjected to agarose gel electrophoresis and visualized by ethidium bromide staining.
FIGURE 7.

The TREX1 compound heterodimers containing a dominant mutant protomer and an R62A protomer do not inhibit TREX1WT dsDNA degradation. The exonuclease reactions (20 μl) were prepared containing nicked dsDNA plasmid (p-Myc) and no enzyme (A–D; lane 1) or the indicated concentration of TREX1WT only (A–D; lane 2) or a mixture of TREX1WT with the indicated increased concentrations of TREX1WT/D18H (A, lanes 3–7), TREX1R62A/D18H (A, lanes 8–12), TREX1WT/D18N (B, lanes 3–7), TREX1R62A/D18N (B, lanes 8–12), TREX1WT/D200H (C, lanes 3–7), TREX1R62A/D200H (C, lanes 8–12), TREX1WT/200N (D, lanes 3–7), or TREX1R62A/D200N (D, lanes 8–12). The reactions were 30 min at 25 °C, and products were subjected to agarose gel electrophoresis and visualized by ethidium bromide staining. The positions of migration of form II (Nicked dsDNA) and circular ssDNA (ssDNA) are indicated.
For visualization of dsDNA reaction products, assays were resuspended in 10 μl of TAE agarose gel running solution and electrophoresed on 0.8% agarose gels containing ethidium bromide. The DNA was visualized using a ChemiDoc XRS gel documentation system (Bio-Rad). For quantification of dsDNA degradation, samples (20 μl) were removed at the indicated times and quenched in wells of a 96-well plate containing 20 μl of 15× SYBR Green (Invitrogen). Fluorescent emission at 522 nm was determined using a Typhoon FLA 9500 Biomolecular Imager (GE Healthcare). The amount of dsDNA remaining was determined by comparing fluorescence values with those obtained from a standard curve of fluorescence emission using varied plasmid concentrations (1–10 μg/ml) stained with 15× SYBR Green. The amount of dsDNA degraded was used to calculate dNMPs excised and activities for TREX1WT and variants (fmol dNMP/s/fmol of enzyme). The relative activities were calculated as follows: relative activity = 100 × [(fmol of dNMP released/s/fmol of mutant enzyme)/(fmol of dNMP released/s/fmol WT enzyme)].
Equilibrium DNA-binding Analysis
The dsDNA binding reactions (20 μl) contained 20 mm Tris-HCl (pH 7.5), 2 mm CaCl2, 2 mm dithiothreitol, 5 mm NaCl, 5 nm FAM-dsDNA 90-mer plus unlabeled dsDNA 90-mer to yield the indicated final oligonucleotide concentrations and TREX1 indicated in the legend to Fig. 8. Fluorescence anisotropy measurements to quantify TREX1 binding to the FAM-dsDNA 90-mer were obtained at 25 °C from reaction samples (20 μl) in microtiter plates using a Tecan Safire2TM with fluorescence polarization module using excitation and emission wavelengths of 470 and 525 nm, respectively. The observed relative fluorescence anisotropy (relative Aobs) is presented as follows: relative Aobs = (An − Ao)/Ao, where An is the anisotropy at point n in the titration, and Ao is the anisotropy of the dsDNA in the absence of TREX1. The maximum relative Aobs in TREX1 titrations using 5 nm FAM-dsDNA 90-mer and Ca2+ is 12.9.
FIGURE 8.

Analysis of dsDNA binding by TREX1WT and TREX1R62A/R62A. Equilibrium DNA binding reactions (20 μl) were prepared as described under “Experimental Procedures” in the presence of 2 mm CaCl2 containing the indicated concentrations of the 90-mer dsDNA substrate (top) as described under “Experimental Procedures,” and the indicated concentrations of TREX1WT (A) and TREX1R62A (B). The observed fluorescence anisotropy Aobs were obtained as described under “Experimental Procedures.” The lines were generated by computer fit of the data using the Hill equation. The concentrations of free TREX1 and the TREX1 binding density were calculated using the data generated from the equilibrium binding reactions and analyzed as described under “Experimental Procedures.” Plots relating the observed anisotropy Aobs to the free TREX1 concentration (C) illustrate the variations in substrate binding observed between the two enzymes. The lines were generated using SigmaPlot (version 8.0, Systat Software).
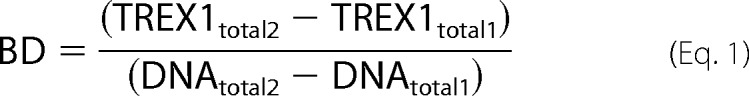
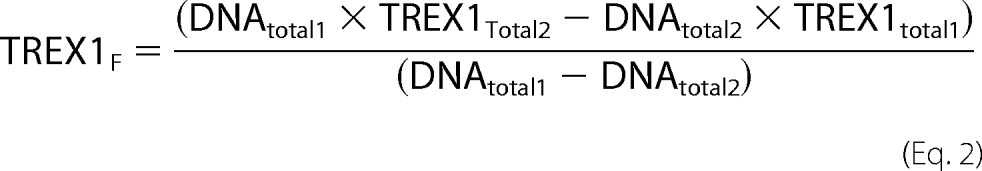
A modification of the macromolecular competition titration method (33) was used to quantify TREX1 binding to the dsDNA 90-mer, similar to that described previously by us for TREX2 binding to ssDNA (37). A series of titrations was performed with increased amounts of TREX1 and 5 nm FAM-dsDNA 90-mer plus unlabeled dsDNA 90-mer to yield the indicated final dsDNA concentrations indicated in the legend to Fig. 8. Binding of TREX1 to the unlabeled dsDNA 90-mer competes with binding to the FAM-dsDNA 90-mer. The average binding density to the 90-mer and the concentration of free TREX1 (TREX1F), were calculated using the mass conservation equations shown below (34).
 |
 |
Model-independent binding isotherms were generated for TREX1 and variants by relating the dependence of the observed relative fluorescence anisotropy to the calculated binding density and TREX1F from dsDNA binding curves measured at three different dsDNA concentrations between 50 and 400 nm. The TREX1 dsDNA titration data were analyzed using Equations 13–15 from Jezewska et al. (35).
RESULTS AND DISCUSSION
The TREX1 enzyme forms a remarkably stable dimer through an extensive hydrogen-bonding network at the interface (Fig. 1). The backbone hydrogen bonds between the outermost β3-strands of each TREX1 protomer result in the formation of an extended, central antiparallel β-sheet that stretches the length of the dimer. The dimeric structure is further stabilized through multiple side chain-side chain, side chain backbone, and water-bridged interactions across the dimer interface and from a hydrophobic face generated between the protomers (26, 32). The highly reinforced TREX1 interface generates a kinetically stable dimer that does not dissociate and re-equilibrate at measurable rates (29).
FIGURE 1.
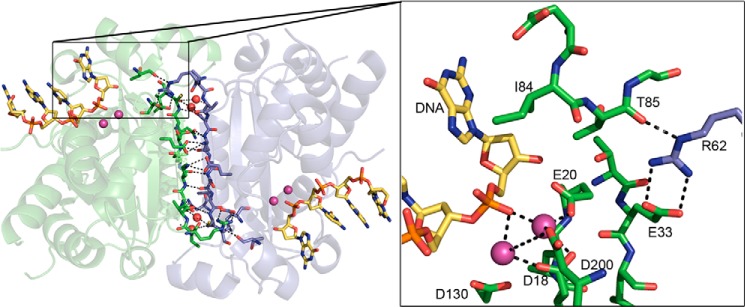
The hydrogen-bonding network at the TREX1 dimer interface. The TREX1 dimer (Protein Data Bank code 2OA8, green/blue) is shown with the extensive side chain-side chain, side chain backbone, and water-bridged (red spheres) hydrogen-bonding network at the interface highlighted. The non-activating Ca2+ ions (pink spheres) and 4-mer ssDNA (yellow sticks) are shown in the active sites. In the box, the Arg-62 residue of one protomer (blue) is shown stretched across the dimer interface, positioning the guanidinium group adjacent to the active site in the opposing protomer (green). The Arg-62 is positioned for interactions with Glu-33 and Thr-85 to correctly orient Ile-84 adjacent to the terminal 3′-nucleotide of the DNA substrate. The metal-coordinating residues (Asp-18, Glu-20, Asp-130, and Asp-200) are indicated. The figure was prepared using PyMOL (Delano Scientific).
The TREX1WT and mutant structures identified the Arg-62 residue of each protomer stretched across the dimer interface, positioning the guanidinium group adjacent to the active site in the opposing protomer (Fig. 1, box). The structures show that the guanidinium group of Arg-62 is ∼27 Å removed from the scissile phosphodiester bond in the active site and only ∼10 Å from the scissile phosphodiester bond in the opposing protomer active site, suggesting that Arg-62 contributes to the catalytic function of the opposing protomer. The Arg-62 forms a salt bridge with the opposing Glu-33 side chain and interacts with the backbone carbonyl oxygen of the opposing Thr-85 that is adjacent to Ile-84 positioned to stack against the purine ring of the 3′-terminal nucleotide in the DNA substrate. This across the dimer interface interaction of Arg-62 suggests a role for this residue in the catalytic function of the opposing protomer and provides a possible biological rationale for the dimeric structure of TREX1. The Arg-62 is highly conserved in all species of TREX enzymes and is nearly identically positioned in all the TREX1 structures (26, 32, 36).
The Exonuclease Activities of the TREX1 R62A-containing Enzymes
The stable TREX1 dimeric structure allowed us to develop a mutagenesis strategy to determine whether the Arg-62 contributes to TREX1 catalysis and to determine whether this contribution to catalysis is in the active site of the opposing protomer. We first demonstrated that the TREX1 Arg-62 residue contributes to catalytic function. The TREX1R62A/R62A homodimer and the TREX1WT/R62A heterodimer were purified, and the catalytic activities were measured using ssDNA and dsDNA substrates. The TREX1R62A/R62A homodimer and the TREX1WT/R62A heterodimer exhibited 57-fold and 2.4-fold reduced levels of ssDNA exonuclease activity, respectively, using a 30-mer oligonucleotide compared with the TREX1WT (Fig. 2, A and B). The TREX1R62A/R62A exhibited a 53-fold reduced level of dsDNA exonuclease activity using a nicked plasmid DNA substrate compared with TREX1WT, and the TREX1WT/R62A exhibited a similar level of dsDNA exonuclease activity compared with TREX1WT (Fig. 3, A and B). The reduced levels of DNA degradation activities measured in the TREX1 Arg-62-containing mutants show that the Arg-62 residue contributes to the catalytic function of TREX1.
The Exonuclease Activities of the TREX1 D18H-containing Dominant Mutant Enzymes
A dominant TREX1 D18H de novo mutation has been identified in a patient where chilblain lupus occurs within the context of AGS (37). The Asp-18 and Asp-200 are two of the divalent metal ion Mg2+-coordinating residues in the TREX1 active site (26), and our previous studies of the TREX1 dominant mutants at Asp-18 and Asp-200 have demonstrated the dramatically reduced catalytic function in these TREX1 mutant enzymes (28, 30). The disease phenotype of the TREX1 D18H allele at this metal-binding residue suggested a mechanism of dysfunction analogous to the dominant TREX1 D18N, D200N, and D200H alleles. The TREX1D18H/D18H and TREX1WT/D18H enzymes were purified, and the catalytic activities were measured using ssDNA and dsDNA substrates. The TREX1D18H/D18H homodimer exhibited no detectible ssDNA exonuclease activity and the TREX1WT/D18H heterodimer exhibited a 1.7-fold reduced level of ssDNA exonuclease activity compared with the TREX1WT (Fig. 4, A and B). The TREX1D18H/D18H and TREX1WT/D18H enzymes exhibited no detectible dsDNA exonuclease activity using the nicked plasmid DNA substrate (results not shown). The levels of DNA degradation activities measured in the TREX1 D18H mutant enzymes parallel those exhibited by the TREX1 D18N, D200N, and D200H mutations.
The ssDNA Exonuclease Activities of TREX1 Compound Heterodimers Containing the R62A Protomer and a Dominant Mutant Protomer
Stable TREX1 compound heterodimers containing the R62A protomer and a dominant mutant protomer exhibit ssDNA exonuclease activities that demonstrate Arg-62 contributes to catalysis in the active site of the opposing protomer. The TREX1R62A/R62A homodimer exhibits about 57-fold reduced ssDNA exonuclease activity (Fig. 2, Table 1). The TREX1 dominant mutant homodimers D18H, D18N, D200N, and D200H exhibit dramatically reduced ssDNA exonuclease activities ranging from ∼20,000-fold to not detectible (Fig. 4, Table 1). The dramatically reduced ssDNA exonuclease activities exhibited by the TREX1 dominant mutant homodimers likely result from failed or improper metal coordination in the active sites. The TREX1R62A/D18H, TREX1R62A/D18N, TREX1R62A/D200H, and TREX1R62A/D200N compound heterodimers were prepared, and the ssDNA exonuclease activities were measured (Table 1). The TREX1 compound heterodimers containing the R62A protomer and the D18H, D18N, D200N, or D200H protomers exhibited ssDNA exonuclease activities corresponding to a 2.5- to 8.1-fold reduction compared with TREX1WT (Table 1). These relatively modest reductions in activities indicate that the R62A-containing compound heterodimers are ∼14- to 46-fold more active than might be predicted if each protomer in the heterodimer acted independently. The TREX1 R62A protomer in complex with the D18H, D18N, D200N, or D200H protomers would be expected to exhibit an ∼114-fold reduced ssDNA exonuclease activity compared with TREX1WT. The higher than expected activities measured in the TREX1R62A/D18H, TREX1R62A/D18N, TREX1R62A/D200H, and TREX1R62A/D200N compound heterodimers are attributed to Arg-62 of the TREX1 D18H, D18N, D200N, and D200H protomers contributing to ssDNA degradation in the TREX1 R62A protomer active site. These data provide direct evidence for contributions of Arg-62 to ssDNA exonuclease activity across the dimer interface in the TREX1 dimer.
TABLE 1.
The ssDNA exonuclease activities of TREX1WT and variants
| TREX1 | Relative activitya | Source |
|---|---|---|
| WT | 1 | This study and Refs. 13, 28, 30 |
| WT/R62A | 1/2.4 | This study |
| R62A/R62A | 1/57 | This study |
| WT/D18H | 1/1.7 | This study |
| D18H/D18H | None detected | This study |
| R62A/D18H | 1/2.5 | This study |
| D18N/D18N | 1/160,000 | Ref. 13 |
| R62A/D18N | 1/2.6 | This study |
| D200H/D200H | None detected | Ref. 30 |
| R62A/D200H | 1/8.1 | This study |
| D200N/D200N | 1/20,000 | Ref. 28 |
| R62A/D200N | 1/6.7 | This study |
a The ssDNA exonuclease activities were derived from assays performed in Figs. 2 and 4 as described under “Experimental Procedures” or as reported previously. Relative activities were calculated as follows: Relative activity = 100 × [(fmol of dNMP released/s/fmol of mutant enzyme)/(fmol of dNMP released/s/fmol WT enzyme)].
The dsDNA Exonuclease Activities of TREX1 Compound Heterodimers Containing the R62A Protomer and a Dominant Mutant Protomer
The TREX1 compound heterodimers containing the R62A protomer and a dominant mutant protomer exhibit dsDNA exonuclease activities that indicate Arg-62 contributes specifically to DNA binding in the active site of the opposing protomer. The TREX1 D18H, D18N, D200H, and D200N protomers exhibit dominant negative effects on the dsDNA degradation activity of a TREX1WT protomer in the heterodimer. This dominant negative effect is apparent as the TREX1WT/D18H, TREX1WT/D18N, TREX1WT/D200H, and TREX1WT/D200N dominant mutant heterodimers exhibit no measurable dsDNA degradation activity despite containing a TREX1WT protomer (Fig. 5A) (28, 30). We have proposed that this lack of dsDNA exonuclease activity exhibited in the dominant mutant heterodimers is attributed to an intact DNA binding process, coupled with dysfunctional chemistry in the dominant mutant protomer active site. To determine whether TREX1 Arg-62 contributes to DNA binding in the active site of the opposing protomer the dsDNA exonuclease activities of the TREX1R62A/D18H, TREX1R62A/D18N, TREX1R62A/D200H, and TREX1R62A/D200N compound heterodimers were measured (Fig. 5, Table 2). Incubation of the nicked plasmid with equal amounts of the TREX1WT (Fig. 5A, lane 2), TREX1R62A/D18N (Fig. 5A, lane 4), TREX1R62A/D18H (Fig. 5A, lane 8), and TREX1R62A/D200H (Fig. 5A, lane 10) results in nearly complete degradation of the nicked polynucleotide strand and accumulation of the un-nicked ssDNA strand. The exception was the TREX1R62A/D200N that exhibits a more modest level of dsDNA degradation of the nicked polynucleotide strand (Fig. 5A, lane 6). The dsDNA degradation activities of these Arg-62 containing dominant mutant heterodimers were more precisely quantified using a fluorescence emission assay (Fig. 5B). The dsDNA degradation activities of the TREX1R62A/D18H, TREX1R62A/D18N, TREX1R62A/D200H, and TREX1R62A/D200N exhibit quantifiable dsDNA degradation activities using the nicked plasmid DNA in contrast to the undetectable levels of activities observed for the TREX1WT/D18H, TREX1WT/D18N, TREX1WT/D200H, and TREX1WT/D200N dominant mutant heterodimers (Fig. 5, A and B). The TREX1R62A/D200N compound heterodimer exhibits ∼4-fold lower dsDNA degradation activity compared with the other compound heterodimers. The dsDNA exonuclease activities in these R62A-containing dominant mutant compound heterodimers indicate that mutation of Arg-62 to Ala in the TREX1R62A protomer reduces DNA binding in the TREX1D18H, TREX1D18N, TREX1D200H, and TREX1D200N dominant mutant protomer active sites allowing access to the nicked polynucleotide strand for degradation by the TREX1R62A protomer. The different levels of dsDNA degradation exhibited in the R62A-containing dominant mutant compound heterodimers likely indicate varied effects on DNA binding.
TABLE 2.
The dsDNA exonuclease activities of TREX1WT and variants
| TREX1 | Relative activitya | Source |
|---|---|---|
| WT | 1 | This study and Refs. 29, 30 |
| WT/R62A | 1/1.1 | This study |
| R62A/R62A | 1/53 | This study |
| WT/D18H | None detected | This study |
| R62A/D18H | 1/7.9 | This study |
| WT/D18N | None detected | Ref. 28 |
| R62A/D18N | 1/4.6 | This study |
| WT/D200H | None detected | Ref. 30 |
| R62A/D200H | 1/5.2 | This study |
| WT/D200N | None detected | Ref. 28 |
| R62A/D200N | 1/23 | This study |
a dsDNA exonuclease activity assays were performed in triplicate at enzyme concentrations linear during the time course. Samples were removed at five time points and quenched in 15× SYBR Green as described under “Experimental Procedures.” Relative activities were calculated as: Relative activity = 100 × [(fmol of dNMP released/s/fmol of mutant enzyme)/(fmol of dNMP released/s/fmol WT enzyme)].
The Inhibition of TREX1WT dsDNA Degradation Activity by D18H- and R62A-containing Enzymes
Similar to the TREX1 dominant mutants D18N-, D200N-, and D200H-containing enzymes, the TREX1 D18H-containing dimers inhibit the dsDNA degradation activity of TREX1WT providing a logical explanation for the dominant phenotype of these TREX1 mutant alleles in AGS and FCL (28, 30). The ability of the TREX1D18H/D18H and TREX1WT/D18H enzymes to inhibit the TREX1WT dsDNA degradation activity was tested by mixing the mutant enzymes with TREX1WT and measuring activity using the nicked plasmid DNA (Fig. 6). The amount of TREX1WT (76 nm) added in these reactions was sufficiently high to completely degrade the nicked polynucleotide of the dsDNA substrate. Thus, in the absence of competing TREX1 mutant enzyme, the TREX1WT completely degrades the nicked polynucleotide of the dsDNA plasmid resulting in the accumulation of the un-nicked polynucleotide ssDNA (Fig. 6, lane 2). When the TREX1WT enzyme was mixed with equimolar amounts of the TREX1D18H/D18H or TREX1WT/D18H and subsequently incubated with the nicked dsDNA plasmid the TREX1WT competes with the mutant TREX1 enzyme to degrade the nicked dsDNA plasmid. The presence of equimolar amounts of the TREX1D18H/D18H or TREX1WT/D18H enzymes results in no apparent dsDNA degradation activity by the TREX1WT enzyme as evidenced by the undegraded nicked dsDNA (Fig. 6, lanes 3 and 4). In contrast, the TREX1R62A/R62A and TREX1WT/R62A enzymes do not inhibit TREX1WT dsDNA degradation activity resulting in the accumulation of the un-nicked polynucleotide ssDNA (Fig. 6, lanes 5 and 6).
The Inhibition of TREX1WT dsDNA Degradation Activity by Dominant Mutant Heterodimers
The TREX1 compound heterodimers containing D18H, D18N, D200H, or D200N with TREX1WT as the opposing protomer exhibit similar dominant negative effects on TREX1WT dsDNA degradation activity (Fig. 7) (28, 30). The relative abilities of the TREX1WT/D18H, TREX1WT/D18N, TREX1WT/D200H, and TREX1WT/D200N enzymes to inhibit the TREX1WT dsDNA degradation activity was determined by mixing varied amounts of the mutant heterodimers with TREX1WT and measuring activities using the nicked plasmid DNA (Fig. 7, A–D, lanes 3–7). In the absence of competing TREX1 mutant enzyme, the TREX1WT completely degrades the nicked polynucleotide of the dsDNA plasmid, as is apparent by the accumulation of the un-nicked polynucleotide ssDNA (Fig. 7, A–D, lane 2). The presence of increased amounts of the TREX1WT/D18H (Fig. 7A, lanes 3–7), TREX1WT/D18N (Fig. 7B, lanes 3–7), TREX1WT/D200H (Fig. 7C, lanes 3–7), and TREX1WT/D200N (Fig. 7D, lanes 3–7) results in decreased dsDNA degradation activity by TREX1WT as evidenced by the increased amounts of remaining nicked dsDNA. The TREX1WT/D18H heterodimer exhibits an inhibitory effect similar to the TREX1WT/D200N and TREX1WT/D200H heterodimers (Fig. 7, compare A, lanes 3–7, with C and D, lanes 3–7), and these three TREX1 AGS-associated dominant mutant heterodimers exhibit a somewhat greater level of inhibition of TREX1WT dsDNA degradation activity compared with the FCL-associated TREX1WT/D18N heterodimer (Fig. 7, compare A, C, and D, lanes 3–7, with B, lanes 3–7). The more potent inhibition of TREX1WT dsDNA degradation activity exhibited by D18H-, D200H-, and D200N-containing heterodimers compared with the D18N-containing mutant enzymes might contribute to the more aggressive clinical diagnosis of AGS for the TREX1 D18H, D200H, and D200N mutations and FCL for the TREX1 D18N mutant allele.
The Inhibition of TREX1WT dsDNA Degradation Activities by Compound Heterodimers Containing a Dominant Mutant Protomer and an R62A Protomer
The Arg-62 contributes across the dimer interface to DNA binding in the opposing TREX1 dominant negative protomer to affect the inhibitory potential in the TREX1 compound heterodimers. The requirement for the Arg-62 residue in the TREX1 dominant mutant inhibition of TREX1WT was tested by measuring the dominant negative effects of TREX1 compound heterodimers containing a D18H, D18N, D200H, or D200N protomer and TREX1R62A as the opposing protomer. Increased amounts of the compound heterodimers were mixed with TREX1WT and the dsDNA degradation activities were measured using the nicked plasmid DNA (Fig. 7, A--D, lanes 8–12). The inhibition of TREX1WT dsDNA degradation by the compound heterodimers was assessed by the accumulation of un-nicked ssDNA product. The presence of increased amounts of the TREX1R62A/D18H (Fig. 7A, lanes 8–12), TREX1R62A/D18N (Fig. 7B, lanes 8–12), and TREX1WT/D200H (Fig. 7C, lanes 8–12) had no effect on the ability of TREX1WT to degrade the dsDNA as evidenced by the complete conversion of nicked dsDNA to the un-nicked ssDNA product. These results indicate that mutation of Arg-62 to Ala removes an important structural element required for functional DNA binding in the dominant mutant protomer. In contrast, upon addition of increased amounts of TREX1R62A/D200N there is an increased amount of undegraded nicked dsDNA demonstrating inhibition of the TREX1WT DNA degradation activity (Fig. 7D, lanes 8–12). However, slightly higher levels of the TREX1R62A/D200N compound heterodimer are required to achieve levels of inhibition comparable to the TREX1WT/D200N heterodimer indicating a modest effect on DNA binding in the D200N protomer (Fig. 7, compare D, lanes 8–12, with D, lanes 3–7). Our structural studies of the TREX1D200N/D200N enzyme indicate that altered side chain conformations and the absence of a divalent metal at position A in the active site could result in repositioning of Glu-20 and Asn-200 sufficiently to generate unique electrostatic interactions (data not shown) (32). The altered TREX1D200N active site configuration could stabilize the orientation of Ala-21 and Leu-24 sufficiently to preserve the substrate DNA-binding site conformation. This preserved DNA binding capability in the TREX1D200N active site could explain the observed inhibition of TREX1WT dsDNA degradation activity in the TREX1R62A/D200N compound heterodimer (Fig. 7D, lanes 8–12) as well its modest dsDNA degradation activity (Fig. 5). These results provide additional evidence for the Arg-62 contribution to DNA binding in the active site of the opposing protomer.
Analysis of dsDNA Binding by TREX1WT and TREX1R62A/R62A
Equilibrium DNA binding analysis indicates that Arg-62 contributes to TREX1 dsDNA binding. The TREX1 dsDNA-binding mechanism was investigated in a series of equilibrium binding studies using a 90-nucleotide dsDNA construct containing a single nick. A 90-mer oligonucleotide was annealed to two complementary 45-mer oligonucleotides to generate the nicked dsDNA (Fig. 8). A series of equilibrium binding studies was performed in reactions containing the dsDNA 90-mer and increased concentrations of TREX1WT or TREX1R62A/R62A with the non-activating divalent metal Ca2+. Binding to the FAM-labeled dsDNA was quantified by the observed increase in anisotropy. Fluorescence anisotropy titration curves were generated using three different dsDNA concentrations to produce well-separated binding isotherms appropriate for rigorous quantification of TREX1WT and TREX1R62A/R62A dsDNA binding (Fig. 8A,B). This model-independent approach allows establishment of a relationship between the number of TREX1 dimers bound to the dsDNA independent of assumptions relating the specific proportions of TREX1-dsDNA complexes to the observed anisotropy (33, 34). At each successively higher dsDNA concentration, the amount of TREX1WT and TREX1R62A/R62A required to generate similar relative fluorescence anisotropy was also increased, as expected. The dsDNA binding observed using TREX1R62A/R62A, as reflected in the Aobs, was clearly lower than that observed using the TREX1WT enzyme at all enzyme concentrations tested supporting the idea that Arg-62 contributes to TREX1 DNA binding (Fig. 8, compare A with B). The titration curves in Fig. 8, A and B, were used to calculate the different concentrations of free TREX1WT and TREX1R62A/R62A present in binding reactions to generate similar fluorescence anisotropy signals. These DNA binding isotherms relate the binding densities and free enzyme concentrations to the contrasting Aobs apparent in these data, likely reflecting the diminished DNA binding affinity in both TREX1R62A/R62A active sites compared with TREX1WT (Fig. 8C). Furthermore, these data indicate that the stable TREX1-dsDNA complex is dependent upon proper coordination of the DNA 3′ terminus within the active site.
The stability of the TREX1 dimer has implications for catalytic function and for phenotypic expression of TREX1 disease-associated alleles making it critically important to understand the functional properties of this exonuclease. Biochemical and structural studies of the TREX1 and TREX2 enzymes have highlighted the remarkable stability and unique dimeric structures of these 3′-exonucleases (26, 29, 30, 32, 36, 38). The results presented here provide evidence that the TREX1 Arg-62 residues act across the dimer interface in the active sites of the opposing protomers. This across the dimer interface action of Arg-62 parallels our previous findings demonstrating that Arg-114 is critical for TREX1 enzymatic activity and also reaches across the dimer interface to facilitate DNA degradation in the active site of the opposing protomer (29). The TREX1 R114H mutation is found in AGS and lupus and is one of the most frequently found of the more than 40 TREX1 disease-associated alleles (8, 25). The TREX1 Lys-66 is also positioned in the dimer to hydrogen bond across the interface to Glu-198 of the opposing protomer. The TREX1 E198K mutation is found in AGS (14, 39), and, in this case, the TREX1E198K/E198K enzyme exhibits DNA degradation activities indistinguishable from the TREX1WT enzyme (31). However, we recently showed that the TREX1 E198K enzyme is hyper-ubiquitinated, suggesting a novel mechanism for altered TREX1 DNA degradation dysfunction and disease. Together, these data provide further evidence that the stable TREX1 dimeric structure plays a critical role in the spectrum of immune dysfunction phenotypes associated with TREX1 mutations that might result from dysfunctional DNA exonuclease activity or from noncatalytic dysfunction effects related to cellular localization or protein interactions.
Acknowledgment
We thank Scott Harvey for excellent technical assistance throughout this work.
This work was supported by National Institutes of Health Grant GM069962 (to F. W. P.), Alliance for Lupus Research Grant 257437 (to F. W. P.), American Heart Association Grant 10GRNT3650033 (to T. H.), and by Wake Forest School of Medicine Postdoctoral Fellowship Award F32GM095290 (to S. R. C.).
- AGS
- Aicardi-Goutières syndrome
- FCL
- familial chilblain lupus
- ssDNA
- single-stranded DNA
- dNMP
- deoxynucleoside monophosphate
- FAM
- fluorescent fluorescein.
REFERENCES
- 1. Lindahl T., Gally J. A., Edelman G. M. (1969) Properties of deoxyribonuclease III from mammalian tissues. J. Biol. Chem. 244, 5014–5019 [PubMed] [Google Scholar]
- 2. Perrino F. W., Miller H., Ealey K. A. (1994) Identification of a 3′→5′-exonuclease that removes cytosine arabinoside monophosphate from 3′ termini of DNA. J. Biol. Chem. 269, 16357–16363 [PubMed] [Google Scholar]
- 3. Perrino F. W., Mazur D. J., Ward H., Harvey S. (1999) Exonucleases and the incorporation of aranucleotides into DNA. Cell Biochem. Biophys. 30, 331–352 [DOI] [PubMed] [Google Scholar]
- 4. Höss M., Robins P., Naven T. J., Pappin D. J., Sgouros J., Lindahl T. (1999) A human DNA editing enzyme homologous to the Escherichia coli DnaQ/MutD protein. EMBO J. 18, 3868–3875 [DOI] [PMC free article] [PubMed] [Google Scholar]
- 5. Mazur D. J., Perrino F. W. (1999) Identification and expression of the TREX1 and TREX2 cDNA sequences encoding mammalian 3′→5′ exonucleases. J. Biol. Chem. 274, 19655–19660 [DOI] [PubMed] [Google Scholar]
- 6. Mazur D. J., Perrino F. W. (2001) Structure and expression of the TREX1 and TREX2 3′ → 5′ exonuclease genes. J. Biol. Chem. 276, 14718–14727 [DOI] [PubMed] [Google Scholar]
- 7. Mazur D. J., Perrino F. W. (2001) Excision of 3′ termini by the Trex1 and TREX2 3′→5′ exonucleases. Characterization of the recombinant proteins. J. Biol. Chem. 276, 17022–17029 [DOI] [PubMed] [Google Scholar]
- 8. Crow Y. J., Hayward B. E., Parmar R., Robins P., Leitch A., Ali M., Black D. N., van Bokhoven H., Brunner H. G., Hamel B. C., Corry P. C., Cowan F. M., Frints S. G., Klepper J., Livingston J. H., Lynch S. A., Massey R. F., Meritet J. F., Michaud J. L., Ponsot G., Voit T., Lebon P., Bonthron D. T., Jackson A. P., Barnes D. E., Lindahl T. (2006) Mutations in the gene encoding the 3′-5′ DNA exonuclease TREX1 cause Aicardi-Goutieres syndrome at the AGS1 locus. Nat. Genet. 38, 917–920 [DOI] [PubMed] [Google Scholar]
- 9. Black D. N., Watters G. V., Andermann E., Dumont C., Kabay M. E., Kaplan P., Meagher-Villemure K., Michaud J., O'Gorman G., Reece E. (1988) Encephalitis among Cree children in northern Quebec. Ann. Neurol. 24, 483–489 [DOI] [PubMed] [Google Scholar]
- 10. Crow Y. J., Black D. N., Ali M., Bond J., Jackson A. P., Lefson M., Michaud J., Roberts E., Stephenson J. B., Woods C. G., Lebon P. (2003) Cree encephalitis is allelic with Aicardi-Goutieres syndrome: implications for the pathogenesis of disorders of interferon α metabolism. J. Med. Genet. 40, 183–187 [DOI] [PMC free article] [PubMed] [Google Scholar]
- 11. Stephenson J. B. (2008) Aicardi-Goutieres syndrome (AGS). Eur. J. Paediatr. Neurol. 12, 355–358 [DOI] [PubMed] [Google Scholar]
- 12. Lee-Kirsch M. A., Gong M., Schulz H., Rüschendorf F., Stein A., Pfeiffer C., Ballarini A., Gahr M., Hubner N., Linné M. (2006) Familial chilblain lupus, a monogenic form of cutaneous lupus erythematosus, maps to chromosome 3p. Am. J. Hum. Genet. 79, 731–737 [DOI] [PMC free article] [PubMed] [Google Scholar]
- 13. Lee-Kirsch M. A., Chowdhury D., Harvey S., Gong M., Senenko L., Engel K., Pfeiffer C., Hollis T., Gahr M., Perrino F. W., Lieberman J., Hubner N. (2007) A mutation in TREX1 that impairs susceptibility to granzyme A-mediated cell death underlies familial chilblain lupus. J. Mol. Med. 85, 531–537 [DOI] [PubMed] [Google Scholar]
- 14. Rice G., Patrick T., Parmar R., Taylor C. F., Aeby A., Aicardi J., Artuch R. (2007) Clinical and molecular phenotype of aicardi-goutieres syndrome. Am. J. Hum. Genet. 81, 713–725 [DOI] [PMC free article] [PubMed] [Google Scholar]
- 15. Rice G., Newman W. G., Dean J., Patrick T., Parmar R., Flintoff K., Robins P., Harvey S., Hollis T., O'Hara A., Herrick A. L., Bowden A. P., Perrino F. W., Lindahl T., Barnes D. E., Crow Y. J. (2007) Heterozygous mutations in TREX1 cause familial chilblain lupus and dominant Aicardi-Goutieres syndrome. Am. J. Hum. Genet. 80, 811–815 [DOI] [PMC free article] [PubMed] [Google Scholar]
- 16. Hedrich C. M., Fiebig B., Hauck F. H., Sallmann S., Hahn G., Pfeiffer C., Heubner G., Lee-Kirsch M. A., Gahr M. (2008) Chilblain lupus erythematosus-a review of literature. Clin. Rheumatol. 27, 1341. [DOI] [PubMed] [Google Scholar]
- 17. Crow Y. J., Rehwinkel J. (2009) Aicardi-Goutieres syndrome and related phenotypes: linking nucleic acid metabolism with autoimmunity. Hum. Mol. Genet. 18, R130–136 [DOI] [PMC free article] [PubMed] [Google Scholar]
- 18. Günther C., Meurer M., Stein A., Viehweg A., Lee-Kirsch M. A. (2009) Familial chilblain lupus–a monogenic form of cutaneous lupus erythematosus due to a heterozygous mutation in TREX1. Dermatology 219, 162–166 [DOI] [PubMed] [Google Scholar]
- 19. Prendiville J. S., Crow Y. J. (2009) Blue (or purple) toes: chilblains or chilblain lupus-like lesions are a manifestation of Aicardi-Goutieres syndrome and familial chilblain lupus. J. Am. Acad. Dermatol. 61, 727–728 [DOI] [PubMed] [Google Scholar]
- 20. Richards A., van den Maagdenberg A. M., Jen J. C., Kavanagh D., Bertram P., Spitzer D., Liszewski M. K., Barilla-Labarca M. L., Terwindt G. M., Kasai Y., McLellan M., Grand M. G., Vanmolkot K. R., de Vries B., Wan J., Kane M. J., Mamsa H., Schäfer R., Stam A. H., Haan J., de Jong P. T., Storimans C. W., van Schooneveld M. J., Oosterhuis J. A., Gschwendter A., Dichgans M., Kotschet K. E., Hodgkinson S., Hardy T. A., Delatycki M. B., Hajj-Ali R. A., Kothari P. H., Nelson S. F., Frants R. R., Baloh R. W., Ferrari M. D., Atkinson J. P. (2007) C-terminal truncations in human 3′-5′ DNA exonuclease TREX1 cause autosomal dominant retinal vasculopathy with cerebral leukodystrophy. Nat. Genet. 39, 1068–1070 [DOI] [PubMed] [Google Scholar]
- 21. Stam A. H., Haan J., van den Maagdenberg A. M., Ferrari M. D., Terwindt G. M. (2009) Migraine and genetic and acquired vasculopathies. Cephalalgia 29, 1006–1017 [DOI] [PubMed] [Google Scholar]
- 22. Gruver A. M., Schoenfield L., Coleman J. F., Hajj-Ali R., Rodriguez E. R., Tan C. D. (2011) Novel ophthalmic pathology in an autopsy case of autosomal dominant retinal vasculopathy with cerebral leukodystrophy. J. Neuroophthalmol. 31, 20–24 [DOI] [PubMed] [Google Scholar]
- 23. Lee-Kirsch M. A., Gong M., Chowdhury D., Senenko L., Engel K., Lee Y. A., de Silva U., Bailey S. L., Witte T., Vyse T. J., Kere J., Pfeiffer C., Harvey S., Wong A., Koskenmies S., Hummel O., Rohde K., Schmidt R. E., Dominiczak A. F., Gahr M., Hollis T., Perrino F. W., Lieberman J., Hübner N. (2007) Mutations in the gene encoding the 3′-5′ DNA exonuclease TREX1 are associated with systemic lupus erythematosus. Nat. Genet. 39, 1065–1067 [DOI] [PubMed] [Google Scholar]
- 24. de Vries B., Steup-Beekman G. M., Haan J., Bollen E. L., Luyendijk J., Frants R. R., Terwindt G. M., van Buchem M. A., Huizinga T. W., van den Maagdenberg A. M., Ferrari M. D. (2010) TREX1 gene variant in neuropsychiatric systemic lupus erythematosus. Ann. Rheum. Dis. 69, 1886–1887 [DOI] [PubMed] [Google Scholar]
- 25. Namjou B., Kothari P. H., Kelly J. A., Glenn S. B., Ojwang J. O., Adler A., Alarcón-Riquelme M. E., Gallant C. J., Boackle S. A., Criswell L. A., Kimberly R. P., Brown E., Edberg J., Stevens A. M., Jacob C. O., Tsao B. P., Gilkeson G. S., Kamen D. L., Merrill J. T., Petri M., Goldman R. R., Vila L. M., Anaya J. M., Niewold T. B., Martin J., Pons-Estel B. A., Sabio J. M., Callejas J. L., Vyse T. J., Bae S. C., Perrino F. W., Freedman B. I., Scofield R. H., Moser K. L., Gaffney P. M., James J. A., Langefeld C. D., Kaufman K. M., Harley J. B., Atkinson J. P. (2011) Evaluation of the TREX1 gene in a large multi-ancestral lupus cohort. Genes Immun. 12, 270–279 [DOI] [PMC free article] [PubMed] [Google Scholar]
- 26. de Silva U., Choudhury S., Bailey S. L., Harvey S., Perrino F. W., Hollis T. (2007) The crystal structure of TREX1 explains the 3′ nucleotide specificity and reveals a polyproline II helix for protein partnering. J. Biol. Chem. 282, 10537–10543 [DOI] [PubMed] [Google Scholar]
- 27. Harrigan J. A., Fan J., Momand J., Perrino F. W., Bohr V. A., Wilson D. M. (2007) WRN exonuclease activity is blocked by DNA termini harboring 3′ obstructive groups. Mech. Ageing Dev. 128, 259–266 [DOI] [PMC free article] [PubMed] [Google Scholar]
- 28. Lehtinen D. A., Harvey S., Mulcahy M. J., Hollis T., Perrino F. W. (2008) The TREX1 double-stranded DNA degradation activity is defective in dominant mutations associated with autoimmune disease. J. Biol. Chem. 283, 31649–31656 [DOI] [PMC free article] [PubMed] [Google Scholar]
- 29. Orebaugh C. D., Fye J. M., Harvey S., Hollis T., Perrino F. W. (2011) The TREX1 exonuclease R114H mutation in Aicardi-Goutieres syndrome and lupus reveals dimeric structure requirements for DNA degradation activity. J. Biol. Chem. 286, 40246–40254 [DOI] [PMC free article] [PubMed] [Google Scholar]
- 30. Fye J. M., Orebaugh C. D., Coffin S. R., Hollis T., Perrino F. W. (2011) Dominant mutation of the TREX1 exonuclease gene in lupus and Aicardi-Goutieres syndrome. J. Biol. Chem. 286, 32373–32382 [DOI] [PMC free article] [PubMed] [Google Scholar]
- 31. Orebaugh C. D., Fye J. M., Harvey S., Hollis T., Wilkinson J. C., Perrino F. W. (2013) The TREX1 C-terminal region controls cellular localization through ubiquitination. J. Biol. Chem. 288, 28881–28892 [DOI] [PMC free article] [PubMed] [Google Scholar]
- 32. Bailey S. L., Harvey S., Perrino F. W., Hollis T. (2012) Defects in DNA degradation revealed in crystal structures of TREX1 exonuclease mutations linked to autoimmune disease. DNA Repair 11, 65–73 [DOI] [PMC free article] [PubMed] [Google Scholar]
- 33. Bujalowski W. (2006) Thermodynamic and kinetic methods of analyses of protein-nucleic acid interactions. From simpler to more complex systems. Chem. Rev. 106, 556–606 [DOI] [PubMed] [Google Scholar]
- 34. Jezewska M. J., Bujalowski W. (1996) A general method of analysis of ligand binding to competing macromolecules using the spectroscopic signal originating from a reference macromolecule. Application to Escherichia coli replicative helicase DnaB protein nucleic acid interactions. Biochemistry 35, 2117–2128 [DOI] [PubMed] [Google Scholar]
- 35. Jezewska M. J., Galletto R., Bujalowski W. (2003) Rat polymerase beta binds double-stranded DNA using exclusively the 8-kDa domain. Stoichiometries, intrinsic affinities, and cooperativities. Biochemistry 42, 5955–5970 [DOI] [PubMed] [Google Scholar]
- 36. Perrino F. W., Harvey S., McMillin S., Hollis T. (2005) The human TREX2 3′ → 5′-exonuclease structure suggests a mechanism for efficient nonprocessive DNA catalysis. J. Biol. Chem. 280, 15212–15218 [DOI] [PubMed] [Google Scholar]
- 37. Tüngler V., Silver R. M., Walkenhorst H., Günther C., Lee-Kirsch M. A. (2012) Inherited or de novo mutation affecting aspartate 18 of TREX1 results in either familial chilblain lupus or Aicardi-Goutieres syndrome. Br. J. Dermatol. 167, 212–214 [DOI] [PubMed] [Google Scholar]
- 38. Perrino F. W., de Silva U., Harvey S., Pryor E. E., Jr., Cole D. W., Hollis T. (2008) Cooperative DNA binding and communication across the dimer interface in the TREX2 3′ → 5′-exonuclease. J. Biol. Chem. 283, 21441–21452 [DOI] [PMC free article] [PubMed] [Google Scholar]
- 39. Ramantani G., Kohlhase J., Hertzberg C., Innes A. M., Engel K., Hunger S., Borozdin W., Mah J. K., Ungerath K., Walkenhorst H., Richardt H. H., Buckard J., Bevot A., Siegel C., von Stülpnagel C., Ikonomidou C., Thomas K., Proud V., Niemann F., Wieczorek D., Häusler M., Niggemann P., Baltaci V., Conrad K., Lebon P., Lee-Kirsch M. A. (2010) Expanding the phenotypic spectrum of lupus erythematosus in aicardi-goutieres syndrome. Arthritis Rheum. 62, 1469–1477 [DOI] [PubMed] [Google Scholar]