

Background: Covalent modification cycles are widely used as regulatory switches.
Results: Mathematical analysis reveals, under very general assumptions, an unavoidable trade-off between switching efficiency and cell-to-cell coherence.
Conclusion: Enzyme bifunctionality offers a way to circumvent this trade-off.
Significance: This may explain the bifunctionality of PFK-2/FBPase-2 in controlling the switch between glycolysis and gluconeogenesis in the mammalian liver.
Keywords: Covalent Regulation; Glucose Metabolism; Mathematical Modeling; Multifunctional Enzymes; Phosphorylation; 6-Phosphofructo-2-kinase/Fructose-2,6-bisphosphatase; Goldbeter-Koshland Loop; Covalent Modification Cycle; Linear Framework
Abstract
Covalent modification provides a mechanism for modulating molecular state and regulating physiology. A cycle of competing enzymes that add and remove a single modification can act as a molecular switch between “on” and “off” and has been widely studied as a core motif in systems biology. Here, we exploit the recently developed “linear framework” for time scale separation to determine the general principles of such switches. These methods are not limited to Michaelis-Menten assumptions, and our conclusions hold for enzymes whose mechanisms may be arbitrarily complicated. We show that switching efficiency improves with increasing irreversibility of the enzymes and that the on/off transition occurs when the ratio of enzyme levels reaches a value that depends only on the rate constants. Fluctuations in enzyme levels, which habitually occur due to cellular heterogeneity, can cause flipping back and forth between on and off, leading to incoherent mosaic behavior in tissues, that worsens as switching becomes sharper. This trade-off can be circumvented if enzyme levels are correlated. In particular, if the competing catalytic domains are on the same protein but do not influence each other, the resulting bifunctional enzyme can switch sharply while remaining coherent. In the mammalian liver, the switch between glycolysis and gluconeogenesis is regulated by the bifunctional 6-phosphofructo-2-kinase/fructose-2,6-bisphosphatase (PFK-2/FBPase-2). We suggest that bifunctionality of PFK-2/FBPase-2 complements the metabolic zonation of the liver by ensuring coherent switching in response to insulin and glucagon.
Introduction
An enzyme-catalyzed modification cycle is illustrated in Fig. 1A. The forward enzyme, E, catalyzes the covalent addition of an M moiety (phosphoryl, methyl, acetyl, etc.), carried by the donor, D-M, to form the modified substrate, S1, from the unmodified substrate, S0. The reverse enzyme, F, catalyzes the removal of M, returning S1 to S0. Background metabolic processes continually replenish D-M from D and M. The substrate, S, can be any molecule, protein or otherwise.
FIGURE 1.

Covalent modification cycle and its steady-state behavior. A, schematic of a covalent modification cycle on a single site. B, examples of enzyme mechanisms that are accommodated by the general reaction grammar described in Ref. 13; on the left is the standard Michaelis-Menten reaction scheme, and on the right is a reaction scheme for a two-substrate enzyme with a random-order Bi-Bi mechanism (such as a kinase in which ATP and the substrate to be phosphorylated can bind in either order and the reaction products can be released in either order). C, enzyme mechanism parameterization. The subscript of each parameter, either 0 or 1, refers to the relevant substrate, S0 or S1, respectively. The enzymes can have complicated mechanisms involving multiple intermediate enzyme-substrate complexes and be fully reversible, as in B. D, steady-state invariant relating S0 and S1, whose derivation is explained in the text. [X] denotes the steady-state concentration of X.
Such cycles can function as biological switches, in which the proportion of S1 at steady state can be varied from low (“off”) to high (“on”) by altering properties of the cycle, such as the enzyme levels (1, 2). They are regarded as core motifs in cellular information processing (3, 4) and have been the subject of much analysis (5–9).
Application of these results to specific biological examples has been hampered, however, by the universal assumption that the enzymes E and F follow the Michaelis-Menten mechanism (Fig. 1B, left) (10). Michaelis and Menten (10) measured enzyme rates with minimal product present and could thereby assume an irreversible mechanism, with no product inhibition. This is no longer valid for the enzymes in a modification cycle, in which product concentrations may be substantial. It has been known for some time that ignoring such issues can yield misleading results (11, 12). Enzymes can also have multiple intermediate enzyme-substrate complexes, not just one, as assumed by Michaelis and Menten (10). In particular, enzymes that catalyze forward modifications have two substrates (Fig. 1A), and, depending on the order in which they bind to the enzyme, additional intermediate complexes may be present, giving rise to mechanisms more like that shown on Fig. 1B, right (13). These problems are well understood for individual enzymes (14) but have not been addressed in multienzyme biological systems, of which the covalent modification cycle is the simplest example.
We have recently developed a “linear framework” for time scale separation (15–18), which enables us to address these issues (13); for an overview, see Ref. 19. This approach offers capabilities beyond the scope of numerical simulation and allows general principles to be distilled irrespective of the underlying details and of the numerical values of the parameters. We exploit this framework here to characterize in quantitative terms the switching behavior of any modification cycle, no matter how complicated the individual enzyme mechanisms. We derive formulas for the transition point, the sharpness, and the range of a switch and show that, to be efficient, the enzymes in the switch must operate as irreversibly as possible. We point out a fundamental trade-off: the sharper the switch, the less coherence between different cells in a population. We discuss how this trade-off can be circumvented and focus on the particular strategy of forming a single bifunctional enzyme, with two independent catalytic domains, in place of two monofunctional enzymes.
Of particular interest in the light of this analysis is the mammalian bifunctional enzyme 6-phosphofructo-2-kinase/fructose-2,6-bisphosphatase (PFK-2/FBPase-2),6 which implements glucose homeostasis by the liver. Here, the modified substrate is a small molecule that is an important allosteric regulator of glycolysis and gluconeogenesis. Our results suggest that bifunctionality is essential to allow glucose homeostasis to work coherently in the liver in response to hormonal signals.
EXPERIMENTAL PROCEDURES
Catalytic Mechanisms of PFK-2/FBPase-2
The enzymatic mechanisms of the kinase and phosphatase domains of PFK-2/FBPase-2 are known in detail (20). The kinase domain follows an ordered, sequential reaction, with the binding of ATP being required for the binding of F6P. Phosphate is directly transferred from ATP to F6P, without the formation of a phosphorylated enzyme intermediate. F2,6BP is then released first, followed by ADP. This gives Reaction 1,
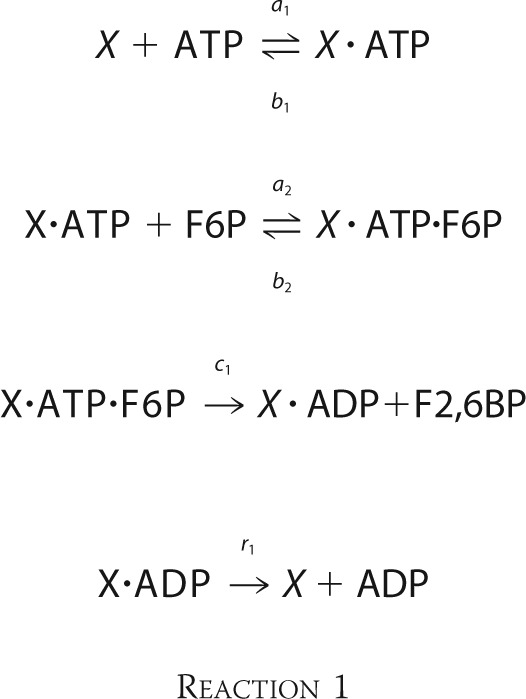 |
Here, X denotes bifunctional PFK-2/FBPase-2. Intermediate complexes are indicated by a dot between the components.
The phosphatase domain first binds F2,6BP in its active site, transfers the 2-phosphate to His-258 (residue positions are given for the rat liver B1 isoform), and then releases F6P. The phosphohistidine is then hydrolyzed, releasing inorganic phosphate. This gives Reaction 2,
 |
The maximal velocity, Vmax, and the concentration at which half-maximal velocity is reached, S0.5, have been measured for each domain of PFK-2/FBPase-2 on its own. Reported values differ widely, due to differences in assay design and/or enzyme purity and stability. Values for both the unphosphorylated Ser-32 (insulin high) and the phosphorylated Ser(P)-32 (glucagon high) states of the rat liver B1 isoform, based on uniform preparations and assay conditions, have been reported in Ref. 21, and these are used here (Table 1). Similar measurements for the reverse directions of the two domains are not readily available. Early measurements, undertaken before the catalytic mechanisms were determined, reported no reversibility but some product rebinding for the phosphatase reaction (22) and mild reversibility for the kinase reaction, to about 2% of the forward reaction (22, 23). The modern consensus seems to be that neither the kinase nor the phosphatase is readily reversible under realistic conditions (24). We were also unable to find generally accepted values for the reverse binding affinities, for either the Ser-32 or Ser(P)-32 conditions, and therefore we assumed that there was no product rebinding. This implies strong irreversibility, in the sense of (13), as described in the text.
TABLE 1.
Measured parameter values and calculated rate constants
The top section gives experimentally measured parameter values, extracted from the cited references, and rate constants for the kinase reactions in Reaction 1, calculated as explained under “Experimental Procedures,” for both the unphosphorylated (Ser-32) and the phosphorylated (Ser(P)-32) enzyme. The bottom section gives the same for the phosphatase reactions in Reaction 2. 1 unit = 1 μmol product/min.
| Parameter | Ser-32 | Ser(P)-32 | Units | Refs. | |
|---|---|---|---|---|---|
| PFK-2 | S0.5 ATP | 150 | 150 | μm | 24 |
| S0.5 F6P | 32 | 492 | μm | 21 | |
| Vmax | 129 | 44 | milliunits/mg | 21 | |
| a1 | 7.86 × 10+2 | 2.70 × 10+2 | m−1 s−1 | ||
| b1 | 1.18 × 10⁻¹ | 4.04 × 10⁻² | s−1 | ||
| a2 | 7.36 × 10+6 | 1.64 × 10+5 | m−1 s−1 | ||
| b2 | 4.71 × 10+2 | 1.62 × 10+2 | s−1 | ||
| c1 | 2.36 × 10⁻¹ | 8.09 × 10⁻² | s−1 | ||
| r1 | 2.36 × 10⁻¹ | 8.09 × 10⁻² | s−1 | ||
| FBPase-2 | S0.5 F2,6BP | 100 | 100 | nm | 57 |
| Vmax | 86 | 177 | milliunits/mg | 21 | |
| a3 | 2.00 × 10+7 | 2.00 × 10+7 | m−1 s−1 | ||
| b3 | 3.84 × 100 | 3.68 × 100 | s−1 | ||
| c2 | 1.56 × 10⁻¹ | 3.23 × 10⁻¹ | s−1 | ||
| r2 | 1.56 × 10⁻¹ | 3.23 × 10⁻¹ | s−1 |
The mechanisms in Reactions 1 and 2 can be accommodated in the reaction “grammar” used here, as described in Ref. 13. Donor molecules (ATP) and their breakdown products (ADP and Pi) are taken to be in rapid equilibrium with the enzymes to which they bind. This allows, for instance, the [X·ATP] coming from Reaction 1 to be replaced by [X][ATP](a1/b1). The kinase reactions may then be rewritten as shown in Reaction 3,
 |
where a2* = [ATP](a1/b1)a2 and Y1 is the intermediate complex X·ATP·F6P in Reaction 1. The phosphatase reactions may be rewritten similarly as shown in Reaction 4,
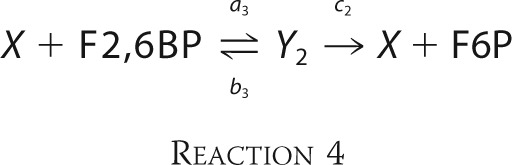 |
where Y2 is the intermediate complex X·F2,6BP in Reaction 2. Because we have assumed strong irreversibility, for the reasons discussed above, both Reactions 3 and 4 turn out to be standard Michaelis-Menten mechanisms. However, there is no difficulty with accommodating product rebinding or reversibility if new data become available.
Estimation of Rate Constants
The Vmax and S0.5 reported in Table 1 are aggregated parameters that can be expressed in terms of the underlying rate constants in Reactions 1 and 2 by using the King-Altman procedure (14). We note in passing that the King-Altman procedure also follows from the linear framework (17). The Vmax values in units of milliunits/mg were converted to effective catalytic rate values, kcat*, in units of s−1 using the definition of 1 unit = 1 μmol of product/min and assuming a molecular mass of 54.76 kDa for the bifunctional monomer. Here, * = E for the kinase domain and * = F for the phosphatase domain. The King-Altman formulas for a two-substrate reaction, given in Table 6.1 of Ref. 14, were adapted for nonreversible catalysis and release. For an ordered sequential mechanism, as in Reaction 1, the effective catalytic rate is given by kcatE = c1r1/(c1 + r1). In the absence of information on the relative values of c1 and r1, it was assumed that c1 = r1, allowing both to be determined from kcatE. The S0.5 for the first substrate, ATP, is given by c1r1/(a1(c1 +r 1)), allowing a1 to be determined. For a2, we noted that association constants are always bounded below by the corresponding kcatE/S0.5, while a widely used diffusion-limited upper bound for small molecules binding to proteins in solution is 108 m−1 s−1 (14). We therefore set a2 to 2000 times kcatE/S0.5(F6P) to get a value in the range 5–20% of the diffusion limit. The S0.5 for F6P is given by r1(b2 + c1)/(a2(c1 + r1)), from which b2 was calculated. The only remaining rate constant is b1. No formula exists for the nonreversible case from which this can be calculated. Accordingly, we approximated the S0.5 for ATP binding by its binding constant, S0.5(ATP) = b1/a1, from which b1 was obtained. A similar approach was taken for the phosphatase reactions in Reaction 2. Having calculated the corresponding kcatF value, as above, it was assumed that c2 = r2, and the formula kcatF = c2r2/(c2 + r2) was used to obtain both c2 and r2. The value of a3 was taken to be 20% of the diffusion limit, as the phosphatase is thought to be quite efficient. Finally, the formula for F2,6BP binding, S0.5 = (b3 + c2)r2/(a3(c2 + r2)), was used to calculate b3. These rate constant values for the individual domains in Reactions 1 and 2 are listed in Table 1.
Numerical Simulation
The reactions for bifunctional PFK-2/FBPase-2 were constructed in the little b computational environment, developed in independent work (25). Little b is a modular construction tool that enables the reactions for the bifunctional enzyme to be automatically generated from those for each catalytic domain in Reactions 1 and 2, assuming that the domains operate independently of each other. The corresponding differential equations for mass action kinetics and the MATLAB code for numerically integrating these equations are then automatically generated from the reactions. This greatly reduces inadvertent errors, but the MATLAB code was also manually inspected for correctness.
The rapid equilibrium assumption for donor molecules is difficult to implement numerically. Instead, we clamped ATP concentration throughout at 3 mm, corresponding to a reported physiological level (26). We initiated the simulations with total PFK-2/FBPase-2 at 1 μm, entirely in the free form, and a specified concentration of free F6P, with all other components absent. Numerical integration was performed using ode15s in MATLAB. The AbsTol of the integration was reduced from its default value to 10−10, for the phosphorylated enzyme (Ser(P)-32) case, or 10−12, for the unphosphorylated enzyme (Ser-32) case, to ensure that concentrations of all minor species were accurately tracked. This was particularly important at high levels of total fructose. The RelTol was reduced from its default value to 10−7. As a control on the integration, total fructose and total enzyme were checked at each time point and were typically conserved to within 0.01% and better, except at very high total fructose levels when they could only be held to within 0.1%. Steady states were detected by running the numerical integration until the levels of each species appeared to stabilize and then checking the numerical value of each species manually over a range of time points.
Sensitivity Analysis
For each of the 10 rate constants, a1, a2, a3, b1, b2, b3, c1, c2, r1, and r2, from Reaction 1 and 2, a value was picked independently and randomly from a log-normal distribution whose mean was the corresponding value in Table 1 and whose standard deviation was 1. With this procedure, c1 ≠ r1 and c2 ≠ r2, which relaxes one of the assumptions made above in estimating the rate constants. There are two sets of rate constant values in Table 1, one each for Ser-32 and for Ser(P)-32, and the random selection was done twice around each set of mean values.
According to the King-Altman procedure used to estimate the rate constants in Table 1, the effective catalytic rates of the PFK-2 and FBPase-2 domains are given by kcatX = ciri/(ci + ri), where i = 1 for the PFK-2 domain (X = E) and i = 2 for the FBPase-2 domain (X = F). The ratio kcatF/kcatE corresponds to the transition point sharpness t* in the mathematical analysis. Because of the way in which the rate constant values have been randomly chosen, some sets of rate constants have t* <1, and others have t* >1. If the steady-state behavior is insensitive to the choice of rate constant values, we would expect the slopes of F6P and F2,6BP to be 0 and 1, respectively, for the first case and 1 and 0, respectively, in the second case, irrespective of whether the rate constant values are chosen around the Ser-32 or Ser(P)-32 mean values.
For each set of randomly chosen rate constant values, the total enzyme concentration was chosen randomly from the uniform distribution in the interval [0.1d,0.9d], where d = (kcatE/kcatF)(b2 + kcatE)a2 was found to avoid enzyme saturation. Total fructose was started at 0.5 mm and increased in steps of 0.1 mm. The initial condition was always that total enzyme was apportioned entirely to free enzyme; total fructose was apportioned entirely to F6P, and all other components were absent. The differential equations were numerically integrated using MATLAB's ode15s. For the initial exploration, AbsTol was reduced to 10−12 and RelTol to 10−7. As a check on the integration, total enzyme and total fructose were calculated, and their standard deviations over all time steps never went above 10−10. Steady states were found by integrating until a range of time steps was reached over which the standard deviation of the logarithm of each variable was less than 10−7. Steady-state [F6P] and [F2,6BP] as a function of total fructose were fitted to a straight line, and the coefficient of determination (i.e. the square of the Pearson correlation coefficient), R2, was used to check goodness of fit. R2 > 0.95 was regarded as a “good fit.” This entire procedure was then repeated for 10,000 choices of rate constant values for both Ser-32 and Ser(P)-32 mean values. Ninety seven hours were required for Ser-32 and 40 h for Ser(P)-32 on Harvard Medical School's Orchestra computing cluster.
The [F6P] and [F2,6BP] graphs were very well fitted to asymptotic straight lines. For Ser-32, with total fructose in the range 1.5–3 mm, R2 > 0.95 for the [F6P] slope for all but 36 rate constant selections and for the [F2,6BP] slope for all but five selections. Each of these 41 selections either had t* very far from 1 or had t* very nearly 1. For these selections, the simulations were re-run with AbsTol reduced further to 10−13 and RelTol reduced to 10−11 and, when t* ≈ 1, with total fructose in the range 4.5–8 mm in increments of 0.1 mm. This increased R2 above 0.97 for all 41 selections. For Ser(P)-32, with total fructose in the range 2–5 mm, R2 > 0.95 for the [F6P] slope for all but 139 rate constant selections and for the [F2,6BP] slope for all but 14 selections. The R2 values for all these 153 selections could be increased above 0.96 by improving the integration as before. In summary, for all 20,000 rate constant selections, the goodness of fit to a straight line for both [F6P] and [F2,6BP] could be made greater than 0.95 by sufficiently stringent numerical integration.
RESULTS
Existence of an Algebraic Invariant Relating S0 and S1
In previous work (13), we have used the linear framework mentioned above to analyze complex enzyme mechanisms, allowing for reversibility and the existence of multiple intermediate complexes (Fig. 1B). The same implicit assumptions were made as in all previous work on modification and demodification; synthesis and degradation were assumed sufficiently slow that the system was closed, with conserved substrate and enzyme totals, whereas donor molecules and their breakdown products (Fig. 1A, D-M, D and M) were assumed to be kept at constant concentrations by background metabolic processes and therefore ignored as dynamic variables (13).
It was shown that provided an enzyme subscribes to a general reaction grammar (13), which allows for instance, for all known protein kinases and phosphoprotein phosphatases, and no matter how complicated the reaction mechanism, the quasi-steady-state behavior can be summarized by four generalized parameters: two total generalized Michaelis-Menten constants and two total generalized catalytic efficiencies, one of each kind of parameter relating to the enzyme's normal substrate and the other of each kind to its normal product (Fig. 1C). For the Michaelis-Menten mechanism, the conventional Michaelis-Menten constant and catalytic efficiency (sensitivity constant) are related through a well known formula (14), but this is no longer the case for the generalized parameters of more complicated mechanisms, which must be treated as independent parameters.
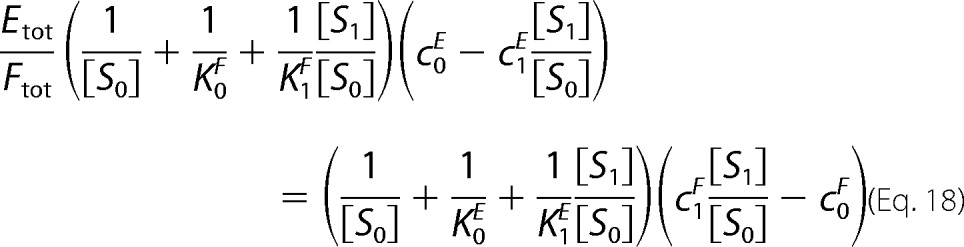
The generalized parameters permit the cycle behavior at steady state to be summarized in an algebraic “invariant” that relates the steady-state concentrations of the two substrate forms, [S0] and [S1] (Fig. 1D). To derive this invariant, Equation 13 in Ref. 13 can be rewritten as Equation 1,
 |
where c*X is the generalized catalytic efficiency in Fig. 1C and then combined with Equation 18 of Ref. 13.
In the resulting invariant in Fig. 1D, all variables other than [S0] and [S1], such as intermediate complexes, have been eliminated, although their influence continues to be felt in the algebraic structure of the invariant and in the generalized parameters. Invariants have previously been found to concisely capture key properties of biochemical systems (13, 27–29).
Because we have assumed, as mentioned above, that synthesis and degradation are sufficiently slow that they can be ignored, the total amounts of substrate, Stot, and enzymes, Etot, Ftot, are conserved quantities that do not vary dynamically. They play a similar role to the parameters but differ in nominally being under experimental control. A striking feature of the invariant is that the relationship between [S0] and [S1] depends only on the ratio, Etot/Ftot, and not on the individual enzyme totals. This will play an important role in the analysis that follows.
The invariant holds for any modification cycle, no matter how complicated the individual enzyme mechanisms. Differences between enzyme mechanisms appear in how the generalized parameters in Fig. 1C are algebraically determined by the underlying biochemical rate constants (13). The invariant thereby summarizes the behavior of an infinite class of molecular systems.
Cycle Equations in the High Substrate Limit
If Etot, Ftot, and Stot are varied, the steady-state concentrations of the two substrate forms, [S0] and [S1], will also vary. This may give the impression that [S0] and [S1] can be treated as mathematical functions of Etot, Ftot, and Stot. However, this conclusion is not, in general, valid. A steady state is a function of the initial conditions from which the system is started, which may eventually lead, as the system changes dynamically over time, to a steady state. Different initial conditions may have the same conserved totals but yield different steady states, a phenomenon known as multistability (15, 30). A steady state cannot then be a mathematical function of the conserved totals.
A central result, proved in the “Appendix,” is that this problem does not arise for the covalent modification cycle, no matter how complicated its enzymes. Any such cycle is monostable; it has only a single steady state for any choice of conserved totals. Accordingly, the steady state, and particularly the quantities [S0] and [S1], can be regarded as functions of Stot, Ftot, and Etot. It is then mathematically legitimate to consider the limit, as total substrate increases, of the proportion of total substrate in each modification state. The existence of these limits is also proved in the “Appendix.”
This novel limiting procedure is the essential step in our treatment because it greatly simplifies the mathematical analysis. However, it also raises the question in any experimental context of the interpretation of high substrate levels, an issue that will be addressed when we consider the applications of the results that follow.
The limiting procedure reduces the system to two equations in the two quantities, u0 = limStot→∞ [S0]/Stot and u1 = limStot→∞ [S1]/Stot. Because the amount of any intermediate complex is bounded above by the total amount of its respective enzyme, the conservation law for substrate simplifies in the limit to Equation 2,
while the invariant itself simplifies in the limit to Equation 3,
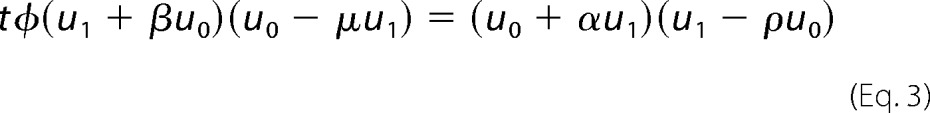 |
Here, we have set t = Etot/Ftot and introduced the following notation
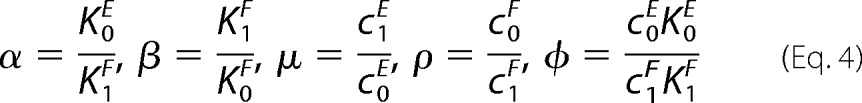 |
These five nondimensional parameters are more informative than the eight dimensioned parameters in Fig. 1C. α and β determine the relative strength of the forward and reverse binding affinities for E and F, respectively, whereas μ and ρ determine the relative strength of the reverse and forward catalytic efficiencies for E and F, respectively. When the enzymes are biased toward their normal directions, the binding affinity for normal substrate is higher (K0E < K1E and K1F < K0F) so that α,β <1 and the catalytic efficiency for making normal product is higher (c0E > c1E and c1F > c0F) so that μ,ρ <1. The parameter φ differs from the others in relating E to F. It acts like a scale factor. Equations 2 and 3 fully describe cycle behavior in the high substrate limit.
Discrimination and Sharpness Require Irreversibility
Covalent modification cycles act as information-processing switches. The switch is off when u1 is low and on when u1 is high, and the switch can be moved back and forth between these limits by changes in the amounts of the enzymes or in the values of the rate constants. One requirement for a good switch is that off and on should be well discriminated. Although nominally 0 ≤ u1 ≤ 1, the rate constants may confine u1 to only part of this interval. The range of u1 is easily calculated from Equations 2 and 3 as given in Equation 5 and proved in the “Appendix.”
 |
The range depends only on the catalytic efficiency ratios μ and ρ and is plotted in Fig. 2A as a function of these quantities. When both enzymes are perfectly reversible, with efficiency ratios of 1, the range of u1 collapses to a single point (u1 = 0.5), corresponding to thermodynamic equilibrium. Discrimination is lost, and the switch carries no information. In contrast, if both enzymes are perfectly irreversible, with efficiency ratios of 0, u1 can utilize the entire interval between 0 and 1. For maximal discrimination, a cycle should operate as irreversibly as possible, with both enzymes far from equilibrium.
FIGURE 2.
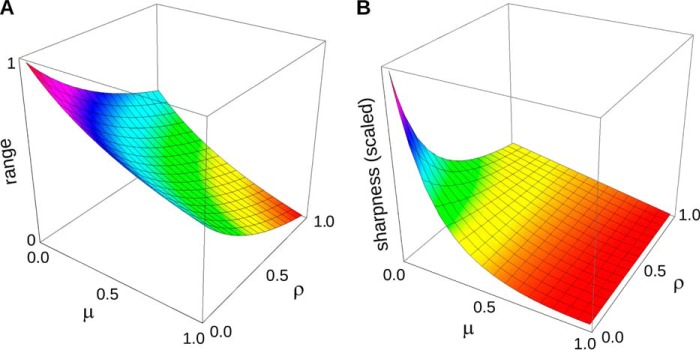
Range and sharpness are maximized when both enzymes are perfectly irreversible. A, range of u1 given by Equation 5 is plotted as a function of the relative catalytic efficiencies, μ and ρ. The enzymes are assumed to be biased in their normal directions, so that 0 < μ, ρ < 1, as shown, with 0 being perfect irreversibility. The maximum range is attained when both enzymes are perfectly irreversible. B, sharpness of switching given by Equation 7 is plotted as a function of the relative catalytic efficiencies, μ and ρ, with the relative binding affinities set to α = β = 0.1. The units on the vertical axis are omitted, as Equation 7 shows that the sharpness can be rescaled by φ, which reflects the relative strength of the two enzymes. As long as the enzymes are biased in their normal directions, with 0 < μ, ρ < 1 as shown, maximum sharpness is attained when both enzymes are perfectly irreversible. A proof is given in the “Appendix.”
A second requirement for a good switch is a sharp transition between off and on, to “throw” the switch. The transition occurs at u1 = 1/2 and it follows from Equations 2 and 3 that this is when t = t*, where t* is given by Equation 6,
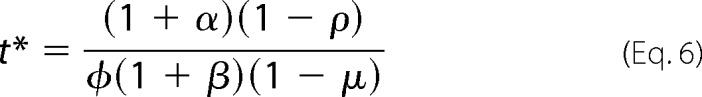 |
If t > t*, then u1 > 1/2 and the switch is on; if t < t*, u1 < 1/2 and the switch is off. One measure of sharpness is the rate of change of u1 as a function of t, du1/dt, evaluated at the transition point given by Equation 6. This measure resembles a Hill coefficient. As proved in the “Appendix,” its value is given by Equation 7,
 |
Provided the enzymes are biased toward their normal directions, the sharpness is maximized when both enzymes are perfectly irreversible (Fig. 2B). We see that sharpness, as well as discrimination, is improved by operating the enzymes as irreversibly as possible. The importance of nonequilibrium mechanisms for cellular information processing has been observed previously (31). The thermodynamic aspects of modification cycles have also been previously analyzed (8, 32).
In their classic study, Goldbeter and Koshland (2) found that, in the language of this study, the sharpness of switching becomes infinite for enzymes that follow Michaelis-Menten mechanisms. When the enzymes are (perfectly) irreversible, c1E = c0F = 0, so that μ = ρ = 0, and, according to Equation 7, the sharpness is then given by Equation 8,
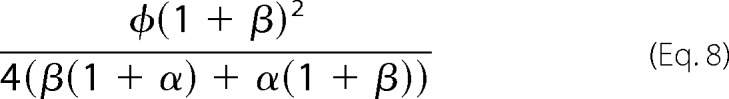 |
However, this quantity remains bounded provided all parameters are positive. The discrepancy with Goldbeter and Koshland (2) arises because, in addition to being irreversible (product cannot be converted back to substrate), the Michaelis-Menten mechanism is also strongly irreversible (product does not rebind to enzyme) (13). This distinction is irrelevant for the Michaelis-Menten mechanism but becomes significant for mechanisms with multiple intermediates. When strongly irreversible, K1E and K0F, which determine the affinity of rebinding, become infinite and α = β = 0. The denominator in Equation 8 becomes 0 and the transition becomes infinitely sharp. The infinite ultrasensitivity shown by Goldbeter and Koshland (2) holds for strongly irreversible enzymes but fails otherwise, as conjectured previously (13). We see that infinite ultrasensitivity depends not on irreversibility per se, as formerly thought, but on absence of rebinding.
Trade-off between Sharpness and Coherence
The switch transition point, t*, given by Equation 6 depends only on the parameters and, through them, on the underlying biochemical rate constants of the two enzymes. If t = Etot/Ftot is greater than t*, u1 > 1/2 and the switch is on, whereas if t is less than t*, u1 < 1/2 and the switch is off. Moreover, the sharper the switch, the more abrupt is the change between on and off as t crosses the transition point. Protein levels can fluctuate widely even within a clonal population of cells; immunohistochemical staining reveals long tailed distributions of protein levels that are well fitted to log-normal distributions (33, 34). In contrast, biochemical rate constants are expected to remain constant between cells, so that the transition point, t*, is constant across a cell population or tissue. If the enzyme levels fluctuate independently, then t could flip back and forth across the transition point from cell to cell, creating mosaic behavior within a tissue, with some cells off and others on. Such incoherence would only be amplified as the switch gets sharper, so that there is a trade-off between switching sharpness, on the one hand, and cell-to-cell coherence, on the other hand. Because of the generality of our results, this trade-off emerges as a fundamental property of any covalent modification cycle.
The incoherence in switching does not come from intrinsic noise due to low molecular numbers (5). It arises within deterministic, macroscopic dynamics from extrinsic noise in initial conditions (i.e. total enzyme levels). It therefore remains significant even when molecular numbers are high, as in the example of glucose metabolism discussed below.
Bifunctionality Circumvents the Trade-off
Equation 6 also suggests how this trade-off can be circumvented. If enzyme levels are maintained close to a fixed stoichiometry, so that t remains approximately constant from cell to cell, then incoherence could be avoided without sacrificing sharpness. This might be achieved by co-regulating the expression or degradation of the enzymes or by bringing them together through scaffolding or in a complex so that their relative concentrations are kept in balance. We consider here an extreme case of complex formation in which the two catalytic domains are placed on the same protein to form the bifunctional enzyme E × F in such a way that the domains do not influence each other.
Intuitively, a substrate form, S0 or S1, should not care whether the domain to which it binds is part of a monofunctional or a bifunctional enzyme, as long as the other domain does not influence the binding. Accordingly, in so far as binding is concerned, the two monofunctional enzymes should behave identically to the bifunctional enzyme with independent domains. However, there are also intermediate complexes and catalysis to consider, as shown in Fig. 3, in which we have assumed, for the purposes of illustration, that E and F both have reversible Michaelis-Menten mechanisms, with intermediate complexes ES0 and FS1 and rate constants k1, …, k8, for mass action kinetics.
FIGURE 3.

Bifunctional enzyme E × F behaves like two separate enzymes E and F, with an additional conservation law. A key assumption is that the two catalytic domains operate independently of each other. The details are explained in the text and a general proof is given in the “Appendix.”
We see from Fig. 3 that the reactions in which the bifunctional enzyme E × F engages can be reorganized in terms of two formal enzymes U and V, and two corresponding formal enzyme-substrate complexes, US0 and VS1. Here, “formal” means a combination of separate molecular species. Because the two catalytic domains are assumed to operate independently of each other, these formal species participate in identical formal reactions to the separate enzymes, with identical rate constants, as shown in the boxes in Fig. 3. Accordingly, the differential equations governing the variables S0, S1, E, F, ES0, FS1 on the left in Fig. 3, and those governing the variables S0, S1, U, V, US0, VS1, respectively, on the right are identical. The key distinction between the two monofunctional enzymes, E and F, and the single bifunctional enzyme, E × F, is that the latter satisfies the additional conservation law Utot = Vtot, as verified on the bottom right of Fig. 3. It is proved in the “Appendix” that this equivalence between two monofunctional enzymes and one bifunctional enzyme with independent domains holds no matter how complex the individual reaction mechanisms.
It follows that the switching analysis above can be directly applied to E × F. Fluctuations in enzyme levels no longer have any effect on t, which remains always at 1, and do not affect whether the switch is on or off. This now depends only on whether t* is greater than or less than 1, with the value of t* being determined by the rate constants of the enzymes through Equation 6. Bifunctionality allows the trade-off to be effectively circumvented and for control of the switch to pass from enzyme levels to enzyme rate constants.
PFK-2/FBPase-2 Implements This Strategy
An example of such a bifunctional mechanism is found in the regulation of glucose homeostasis by the mammalian liver. The endocrine hormones insulin and glucagon orchestrate the switch between glucose consumption by glycolysis and glucose production by gluconeogenesis as depicted in Fig. 4A (35, 36). The switch is implemented by the terminal metabolite, F2,6BP, which is reversibly produced from fructose 6-phosphate (F6P) by the B1 isoform of the bifunctional enzyme PFK-2/FBPase-2 (20, 37, 38). F2,6BP allosterically activates 6-phosphofructo-1-kinase (PFK-1) and allosterically inhibits fructose-1,6-bisphosphatase, the key enzymes in glycolysis and gluconeogenesis, respectively, which interconvert F6P and fructose 1,6-bisphosphate. When F2,6BP is high, the switch is on and glycolysis is favored; when it is low, the switch is off and gluconeogenesis is favored.
FIGURE 4.

Bifunctionality in glucose homeostasis. A, key control point in glycolysis and gluconeogenesis in the liver. Enzymes are shown as gray ovals; principal metabolites as boxes. Abbreviations are explained in the text. The heavy arrows from insulin and glucagon represent the signaling pathways downstream from these hormones, which ultimately modify the phosphorylation state of the Ser-32 residue of PFK-2/FBPase-2. B, ribbon diagram of the crystal structure of bifunctional PFK-2/FBPase-2 (Protein Data Bank code 1BIF), showing the well separated phosphatase and kinase domains, prepared using Open Source PyMol 1.2.x. C, plots of steady-state concentrations of F6P (blue) and F2,6BP (red) against total fructose for Ser-32 (left) and Ser(P)-32 (right). Here “total fructose” refers to the closed PFK-2/FBPase-2 system and consists of F6P, F2,6BP and enzyme-bound intermediates. The inset shows a higher resolution plot of F2,6BP, with an expanded horizontal scale (millimolar and not micromolar) and a contracted vertical scale (nanomolar and not micromolar).
The role played by the bifunctionality of PFK-2/FBPase-2 appears not to have been clarified in the literature. For instance, Okar et al. (20), in their major review, suggest that the bifunctionality may be “something of an elaboration” and point to previous modeling studies, in which dynamic phenomena like bistability or oscillations have been suggested (39). More recent experimental and mathematical studies in bacteria (29, 40–43) and in plants (44) have shown that bifunctional enzymes satisfying appropriate assumptions can exhibit forms of robustness, in which the steady-state concentration of the modified substrate is independent of the total amounts of substrate and enzyme (45). Such “absolute concentration robustness” (46) is not found for the bifunctional modification cycles studied here, as we will see below.
Before we can apply our analysis to PFK-2/FBPase-2, several complexities in the in vivo context must be addressed. First, the unmodified substrate, F6P, is produced and consumed within an open system. Importantly, the catalytic rates of PFK-2/FBPase-2 are several thousand-fold slower than those of PFK-1 and fructose-1,6-bisphosphatase (37). This time scale separation decouples the bifunctional enzyme from the main thoroughfare of glycolysis and gluconeogenesis; alterations in F6P levels on a short time scale of seconds are not seen by PFK-2/FBPase-2, but persistent changes to F6P levels on a longer time scale of minutes are allocated between F6P and F2,6BP. For this reason, the covalent modification cycle and its bifunctional equivalent, which are analyzed above as closed systems, still provide a reasonable approximation to the open physiological system.
Second, the rate constants of PFK-2/FBPase-2 are modified by signaling; glucagon acts through a G-protein-coupled receptor pathway to phosphorylate Ser-32, whereas insulin acts through a receptor tyrosine kinase pathway to dephosphorylate Ser(P)-32. (These residue numbers skip the leading methionine.) Phosphorylation diminishes the kinase activity and increases the phosphatase activity (37). Signaling thereby alters t* in Equation 6, moving its value between a level above 1, at which the switch is off, and a level below 1, at which the switch is on. This imposes another switch on top of that between F6P and F2,6BP, whose analysis presents technical challenges arising from dimerization that are reviewed under the “Discussion.” We assume that either all molecules of PFK-2/FBPase-2 are phosphorylated on Ser-32 or all molecules are unphosphorylated. We consider this reasonable because departure from it should only exacerbate the incoherence by amplifying the extrinsic noise. Indeed, this may have been why protection against incoherence was especially advantageous in the most downstream element ot the pathways.
Third, PFK-2/FBPase-2 is subject to additional regulation (20, 47). For instance, the binding of glucokinase to the phosphatase domain of PFK-2/FBPase-2 appears to favor the kinase activity of PFK-2/FBPase-2 (47). Although these findings are of considerable importance for understanding glucose metabolism, they do not directly affect the model considered here.
Fourth, the liver exhibits zonation in glucose metabolism, with hepatocytes close to the incoming portal vein being exposed to different levels of hormones to those close to the outgoing central vein and having different metabolic activity (48, 49). This gives rise to a sampling effect; if individual cells are assumed to choose the level of an enzyme from a normal distribution with standard deviation σ, then the mean enzyme level in a population of N cells will vary between populations with a standard deviation of σ/√N. In other words, small populations exhibit greater variation in their mean behavior than large populations. The zonation of the liver into small cell populations exposed to similar levels of hormones therefore places even more reliance on a coherent switching mechanism than would be needed if the liver was an unzoned homogeneous tissue.
Finally, our analysis has been based on taking the limit as total substrate increases. To address this, we undertake below a numerical simulation of PFK-2/FBPase-2, which confirms the limiting analysis and provides additional insights into the low substrate regime.
With these considerations in mind, we can apply the analysis above to PFK-2/FBPase-2. The individual enzyme mechanisms are known in detail, as shown in Reactions 1 and 2, and these are readily accommodated in the reaction grammar of Ref. 13 in the form of Reactions 3 and 4, respectively. The two catalytic domains are well separated (Fig. 4B) and are thought to operate independently. Our analysis suggests that the bifunctionality of PFK-2/FBPase-2 ensures coherent switching within small zonal populations of cells. Furthermore, for efficient switching, PFK-2/FBPase-2 should operate more irreversibly, with the high insulin (Ser-32) and high glucagon (Ser(P)-32) states on opposite sides of the on/off transition point in Equation 6, with Ser-32 being on and Ser(P)-32 being off.
The in vitro data support this. The kinase and phosphatase domains of PFK-2/FBPase-2 show little, if any, reversibility. As Okar et al. (24) say, “In isolation, neither reaction is freely reversible.” Furthermore, we found no data on product-rebinding rates, suggesting that the enzymes may be close to being strongly irreversible, with only weak rebinding of product to enzyme. If we assume strong irreversibility as a first approximation, then μ = ρ = 0 and α = β = 0, so that Equation 6 simplifies to t* = 1/φ = (c1FK1F)/( c0EK0E). For the kinase mechanism in Reaction 3 and the phosphatase mechanism in Reaction 4, we get Equation 9,
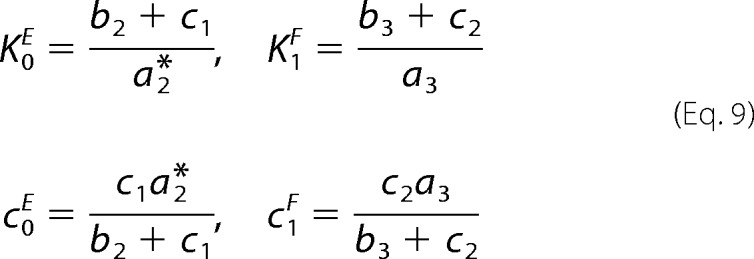 |
so that t* = c2/c1. Using the values in Table 1, we see that, for Ser-32, t* = 0.66 < 1 and the switch is on, and for Ser(P)-32, t* = 3.99 > 1 and the switch is off, as expected. Ser(P)-32 is more firmly off than Ser-32 is on, which may reflect the need to more efficiently inhibit glycolysis under glucose depletion. We stress that this calculation can readily be extended to the more realistic situation in which there is limited product rebinding, once reliable estimates are available for these rates.
We predict from this analysis that replacement of endogenous bifunctional PFK-2/FBPase-2 by two separately regulated monofunctional enzymes should lead to incoherent mosaic behavior within the individual zones in the liver when switching between insulin and glucagon stimulation.
Other tissue-specific PFK-2/FBPase-2 isoforms are also of interest, but fewer experimental measurements are available for them. Cancer cells often overexpress the B3 isoform of PFK-2/FBPase-2, which has far stronger kinase than phosphatase activity (50). Dephosphorylation capability may be supplied instead by TIGAR (36). Reliance on two monofunctional enzymes may reflect an oncogenic advantage in bypassing the cell-to-cell coherence offered by the bifunctional enzyme.
Switching Behavior in the Low Substrate Regime
It remains to be understood what happens away from the high substrate limit. This is difficult to carry out analytically, so we undertook a numerical simulation for the particular example of PFK-2/FBPase-2. Differential equations were compiled for the bifunctional enzyme using the enzyme mechanisms in Reactions 1 and 2, assuming mass action kinetics, and these equations were numerically integrated in MATLAB using the rate constant values in Table 1 (see under “Experimental Procedures”). We found that, as total fructose increases, either steady-state [F6P] (for Ser-32) or steady-state [F2,6BP] (for Ser(P)-32) increases to a plateau, after which increasing fructose is allocated linearly to the other substrate form (Fig. 4C). In the Ser(P)-32 case, the plateau level of [F2,6BP] is particularly low (Fig. 4C, right panel), suggesting again that the switch may be kept decisively off during glucose depletion. We also found that the plateau levels were independent of the level of PFK-2/FBPase-2 (data not shown).
We undertook a further sensitivity analysis to ensure that these plateaus and straight lines were not an accident of the chosen rate constant values. We randomly sampled 10,000 values around each of the Ser-32 and Ser(P)-32 estimated values in Table 1 and numerically integrated the resulting equations (see under “Experimental Procedures”). We found that, with sufficiently stringent numerical procedures, all 20,000 choices yielded asymptotic straight lines for both steady-state [F6P] and steady-state [F2,6BP], with a goodness of fit greater than 0.95 (Fig. 5). We also found that these straight lines had the expected patterns of slopes as follows: when t* <1 (Fig. 5, blue points), the [F6P] and [F2,6BP] slopes were 0 and 1, respectively, whereas when t* >1 (red points), they were 1 and 0, respectively, irrespective of whether the rate constants were chosen around the Ser-32 or Ser(P)-32 mean values. This is a stringent test, as it is unlikely, if a straight line is found, for its slope to be near 0 or near 1, unless it is exactly so for mathematical reasons. Sensitivity analysis, therefore, shows no significant deviation from the most salient feature of Fig. 4C, confirming that this is independent of any particular choice of rate constant values.
FIGURE 5.
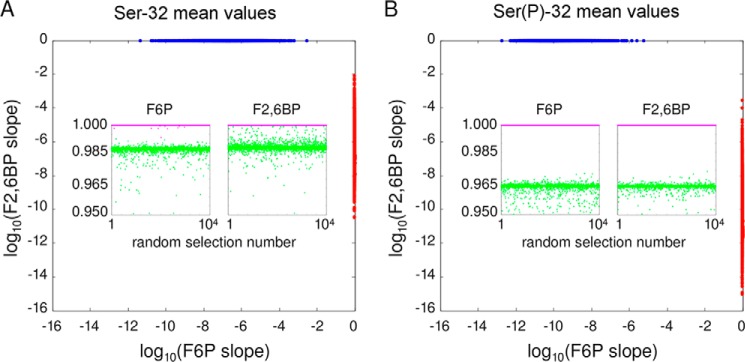
Sensitivity analysis. A, for 10,000 sets of rate constant values centered around the Ser-32 values in Table 1, randomly chosen as described under “Experimental Procedures,” the steady-state concentrations of F6P and F2,6BP were determined for increasing values of total fructose. The corresponding graphs were fitted to straight lines and the respective slopes are plotted on a log scale. Those sets for which t* < 1 are plotted in blue, and those for which t* > 1 are plotted in red. The former data points are clustered around (0, 1) but with a strongly asymmetric distribution, with the F2,6BP slope being almost exactly 1, whereas the F6P slopes occupy a broader range of values between 10−12 and 10−2. The latter data points are clustered around (1, 0) with a similarly asymmetric, but reversed, distribution. The two insets show the coefficient of determination for each linear fit, plotted against the selection number in which the corresponding rate constant values were found, from 1 to 10,000. The points with slope 1 are colored magenta, and those with slope 0 are colored green. They show a different pattern of correlation, with the former clustered almost exactly at 1.000, while the latter are more diffusively scattered around a lower value. B, same plot for the 10,000 rate constant values centered around the Ser(P)-32 values in Table 1.
This numerical simulation fully supports the limiting analysis above. According to Equation 8, strongly irreversible enzymes have an infinitely sharp switch, and we see from Fig. 4C that normalized [F2,6BP], which becomes u1 in the high substrate limit, tends to 1 for Ser-32 and to 0 for Ser(P)-32, and that the convergence is rapid once the plateaus are reached. The simulation also shows that, instead of absolute concentration robustness, which has been suggested for certain other bifunctional enzymes, PFK-2/FBPase-2 only exhibits robust upper bounds on concentration: if t* <1 (for Ser-32), then [F6P] always remains below a plateau level, and if t* >1 (for Ser(P)-32), then [F2,6BP] always remains below a plateau level, and these plateau levels are independent of the total amounts of substrate and enzyme. Although the conclusions drawn from this simulation apply to the specific example of PFK-2/FBPase-2, previous work suggests that the plateaus and straight lines of Fig. 4C are characteristic of modification cycles with strongly irreversible enzymes (13).
We note an interesting discrepancy in the slopes in Fig. 5; those which are one are almost exactly one, whereas those which are zero have a broader spread. The same discrepancy is found in the goodness of fit (Fig. 5, insets): those slopes which are one (magenta) are almost exactly fitted to a straight line, whereas those which are zero (green) are slightly less well fitted. We suspect that the zero slopes are approached asymptotically slower than the one slopes and that this is reflected in the fitting. This may be of interest if the mathematical analysis in the text can be extended from the limiting case of Stot → ∞.
DISCUSSION
Reliance on the Michaelis-Menten mechanism has perpetuated the convenient fiction that all enzymes have the same mechanism and that enzymatic complexity can be ignored. The dangers of this have been pointed out (11, 12), and much work since the time of Michaelis and Menten has shown how enzymes differ in their mechanisms (51, 52). The obstacle to an improved dialogue between enzymology and systems biology has been the lack of a systematic method to deal with the increased complexity (19). We have shown here how this barrier can be overcome for a covalent modification cycle. In particular, our results hold for any covalent modification cycle, no matter how complex its enzyme mechanisms. Our ability to draw such general conclusions rests on the linear framework, which offers a systematic method for rising above the mechanistic details (19).
This study builds upon our preliminary study of covalent modification cycles, or “Goldbeter-Koshland” loops (13), in which the analysis of complex enzyme mechanisms was first developed. An important distinction between the previous work and this study is that the former was limited to the case in which both forward and reverse enzymes are strongly irreversible. Here, we have been able to drop this physiologically unrealistic assumption and analyze the general case.
This analysis has relied on two key technical ideas. The first is that the steady-state behavior of a potentially complicated biochemical system can be distilled into one or more algebraic invariants, which summarize the relationship between selected dynamical variables while eliminating all other variables. For the covalent modification cycle studied here, the selected variables are [S0] and [S1] and a single invariant emerges (Fig. 1D). The idea of invariants emerged in previous work (27) and has been exploited in other contexts (13, 28, 29).
The second technical idea is to consider the steady-state behavior in the high substrate limit, which greatly simplifies the mathematical analysis. The system is reduced to a pair of equations, Equations 2 and 3, from which our main results readily follow. In particular, we find that the range and sharpness of switching are maximized when the enzymes operate as irreversibly as possible (Fig. 2), but this comes at the expense of a trade-off between switching efficiency on the one hand and cell-to-cell coherence on the other hand. The idea of taking limits to simplify the analysis appears to be new. Its legitimacy rests on the fact that any covalent modification cycle is monostable, for which we have given a careful justification in the “Appendix.”
Our results offer a new interpretation for the bifunctionality of PFK-2/FBPase-2, which plays a central role in regulating glucose metabolism in the liver. Covalent modification cycles and bifunctional enzymes have been studied independently in the past, while more recent work has continued to rely on Michaelis-Menten assumptions (53). The general relationship between modification cycles and bifunctionality with independent domains, as described in Fig. 3, appears not to have been noted previously. Our results suggest that the bifunctionality of PFK-2/FBPase-2 is important not to ensure concentration robustness, as suggested for some other bifunctional enzymes, but to circumvent the trade-off between efficiency and coherence within individual zones in the liver. This leads to a clear prediction, which could potentially be tested in a transgenic mouse or rat; if endogenous PFK-2/FBPase-2 is replaced by two monofunctional enzymes, individual zones in the liver should exhibit more incoherent mosaic choices between glycolysis and gluconeogenesis, when switching between insulin and glucagon stimulation.
Bifunctionality in PFK-2/FBPase-2 appears to have originated as a gene fusion in an ancestor of all eukaryotes (54). The presence of two structural domains on the same polypeptide has been largely retained, but many unicellular eukaryotes, including protists and yeasts like Saccharomyces cerevisiae, have accumulated what appear to be inactivating mutations in one or the other of the domains, which may render the enzyme effectively monofunctional. In contrast, working bifunctionality has been retained and duplicated in several multicellular lineages. Although this is broadly consistent with our suggestion that bifunctionality is advantageous in a multicellular tissue context, there is insufficient biochemical characterization to be more definitive. Moreover, the role played by F2,6BP as an allosteric effector varies between different lineages (54), and there could be other evolutionary advantages to bifunctionality beyond that suggested here.
There are several other biologically interesting covalent modification cycles. These include glycogen phosphorylase (55), isocitrate dehydrogenase (56), and, as mentioned above, PFK-2/FBPase-2 itself on its Ser-32 site. Interestingly, these substrates are all proteins, unlike F6P. In each case, the substrate oligomerizes, creating two or more modification sites, not one, so that these examples fall outside the scope of this study. There is no difficulty in accommodating enzymatic complexity in the multisite case (16, 17). The difficulty lies in the loss of monostability (15, 30), which means that the steady state is no longer a single-valued function of the conserved totals. The high substrate limit cannot be directly taken, which was the key step in our analysis. In the multisite case, a more complicated multiple-valued algebraic relationship does exist between the steady state and the conserved totals (15). If the behavior of this relationship can be determined in the high substrate limit, it may permit a similar approach to the multisite cycle as undertaken here for the single site cycle. This may help to explain why, of the examples quoted above, isocitrate dehydrogenase has a bifunctional modifying/demodifying enzyme (29, 42), whereas glycogen phosphorylase and PFK-2/FBPase-2 do not. The analysis of switching behavior in the multisite case remains an intriguing open problem.
Acknowledgments
We thank M. Raafat El-Maghrabi for helpful information on PFK-2/FBPase-2; Jeremy Muhlich for assistance with cluster computing, support for which was partially provided by National Institutes of Health Grant 1S10RR028832-01 from NCRR; Joseph Dexter for helpful discussions, and Rebecca Ward for generous assistance with Tex to Word conversion.
APPENDIX
We provide here the mathematical proofs of the key assertions in the paper.
Uniqueness of the Steady State and Functional Dependence on Totals
We prove that a single site modification cycle always has a unique steady state. The proof requires several steps. To avoid excessive length, we assume that the generalized parameters, K** and c**, are positive and finite, as is the case for the right-hand mechanism in Fig. 1B and omit discussion of special cases in which some of the total generalized Michaelis-Menten constants are infinite or some of the total generalized catalytic efficiencies are zero, as is the case for the left-hand mechanism in Fig. 1B. All other values chosen are assumed to be positive. All values constructed in the proof are also positive, as can be readily checked.
Step 1
If Etot and Ftot are chosen, then, as solutions of the invariant in Fig. 1D, a given value of [S1] is associated to a unique value of [S0]. Furthermore, this relationship is monotone-increasing, i.e. if [S1] increases then so too does [S0].
If Etot, Ftot. and [S1] are assumed to be fixed, the invariant takes the form as shown in Equation 10,
where QL and QR are quadratic expressions in [S0]. It is evident that both QL and QR have one positive and one negative root and that QL has a minimum, and QR has a maximum. It can be seen from Fig. 6 that this geometry guarantees a unique positive solution for [S0] in Equation 10. This proves the first part. For the second part, the annotations in Fig. 6 show that increasing [S1] widens the gap on the [S0] axis between the positive and negative roots of both QL and QR, while also decreasing the minimum of QL and increasing the maximum of QR. Accordingly, the unique positive solution for [S0] in Equation 10 increases. This proves the second part.
FIGURE 6.
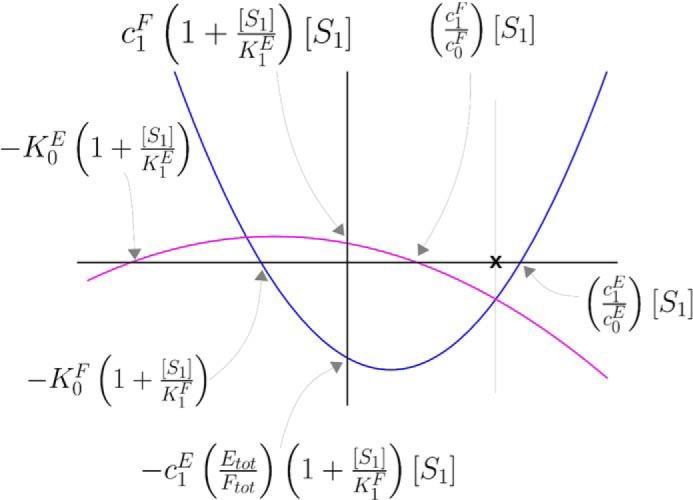
Appendix, solution of Equation 10. Hypothetical graphs of the quadratic expressions QL (blue) and QR (magenta) are plotted as functions of [S0] The points of intersection of the parabolas with the horizontal and vertical axes are readily calculated from the invariant in Fig. 1D and are annotated as shown. This arrangement of the two graphs depends on the particular values of the parameters; for instance, for the positive roots of QL and QR to be as shown, it is necessary and sufficient that c1F/c0F < c1E/c0E. The intersections of the two graphs give the solutions of [S0] in Equation 10. It can be seen that there is always a unique positive solution, marked by ×.
Step 2
Suppose that Stot, Etot, and Ftot are given. There exists a unique value of [S1] that provides a solution to both the invariant and the substrate conservation law.
The substrate conservation law can be written as shown in Equation 11,
where Ytot is the total of all the intermediates. We are going to write all the terms on the right-hand side of Equation 11 as functions of [S1]. For [S0], because Etot and Ftot are given, we know from the first part that [S0] = κ([S1]), where κ is a monotone-increasing function. This enforces compliance with the invariant. For Ytot, we can use the conservation laws for the enzymes, to write Equation 12,
Using the total generalized Michaelis-Menten constants, as described in Ref. 13, the conservation law for enzyme E can be written as shown in Equation 13,
 |
and the conservation law for enzyme F as shown in Equation 14,
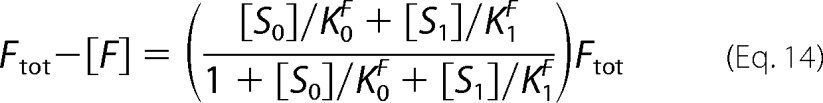 |
The right hand sides of Equation 13 and 14 are monotone-increasing functions of [S0] and [S0], so if we substitute [S0] = κ([S1]) into them, we can express Ytot as shown in Equation 15,
where γ is also a monotone-increasing function. Note that the intermediate enzyme-substrate complexes can never exceed the total amounts of all the enzymes, Ytot < Etot + Ftot, so that γ remains bounded above, no matter how large [S1] becomes. Putting this all together, we find Equation 16.
Although we do not know the exact form of κ and γ, we know enough about these functions to solve Equation 16 for [S1] by the geometric method introduced in Ref. 13. This is illustrated in Fig. 7A. We plot three curves as functions of [S1]. The first two curves are static, and the third curve will be moved to find the solution to Equation 16. The first curve is the “diagonal” given by the graph of y = Stot − [S1]. The second is the “intermediate curve” given by the graph of y = γ([S1]). The third is the “substrate curve,” given by the graph of y = κ([S1]). The origin of the substrate curve should be thought of as a moveable “slider” whose position on the vertical y axis can be altered, taking along with it a horizontal “substrate axis.” Because κ is monotone-increasing, it is clear that no matter where the slider is between 0 and Stot, the substrate curve will intersect the diagonal in a unique “upper point.” Also, because γ is monotone-increasing and bounded above, the slider can always be lowered so that the substrate axis intersects the intermediate curve, which it can only do in a unique “lower point.” Suppose now that the lower point is to the left of the upper point (i.e. the [S1] coordinate of the former is less than that of the latter), as in Fig. 7A. Then, by moving the slider upward, the upper and lower points can be brought closer to each other. Conversely, if the lower point is to the right of the upper point, the slider can be lowered to bring the two points closer. In either case, no matter what the shapes of κ and γ, the slider can be moved to a unique position at which the upper and lower points are on a vertical line. When that happens, it is easy to see from Fig. 7B that Equation 16 is solved. Hence, there is a unique value of [S1], which is a solution to both the invariant and the substrate conservation law, as required.
FIGURE 7.
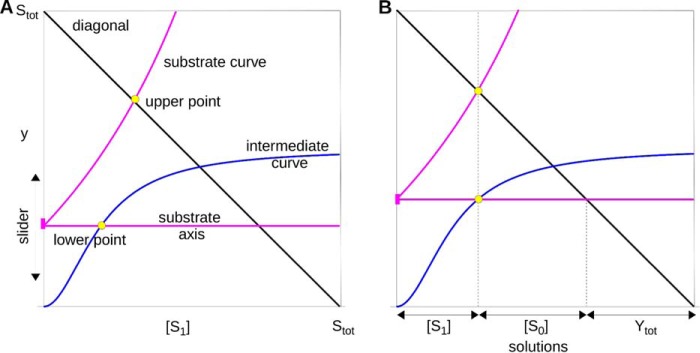
Appendix, solution of Equation 16. A, “diagonal,” “intermediate,” and “substrate” curves are shown as graphs of functions of [S1], as explained in the “Appendix.” The intermediate and substrate curves are hypothetical but illustrate how the procedure works when the only thing known about the curves is that they are monotone-increasing. There is always a unique “upper point” if the slider is above the [S1] axis and below the diagonal. There is always a unique “lower point” if the slider is below the asymptote of the intermediate curve. B, solution to Equation 16 is found by moving the slider until the upper and lower points are on the same vertical line. Because the diagonal has slope −1, it can be seen that, in this position, the three segments of the vertical line, reading from the top down, are [S1], κ([S1]), and γ([S1]), which must, accordingly, sum up to Stot, thereby solving Equation 16 for [S1]. It is clear that there is always a unique position where this happens. The various terms in Equation 16 at the solution point can be read off on the horizontal axis, as shown.
Step 3
Suppose that Stot, Etot and Ftot are given. There is a unique steady state satisfying the corresponding conservation laws.
The previous step shows that there is a unique value of [S1] that provides a solution to both the invariant and the substrate conservation law. The value of [S0] in that common solution is given by [S0] = κ([S1]). Because Etot and Ftot are given, the values of [E] and [F] can now be determined from Equations 13 and 14, which correspond to the conservation laws for the two enzymes. Finally, the concentrations of all the intermediate complexes can be determined from the linear framework, as in Equation 8 of Ref. 13. Each of the dynamic variables in the system has now been given a value. It remains only to check that these constitute a steady state, a point at which all derivatives vanish. We can appeal to Theorem 2 of Ref. 16, which gives conditions for any system of modification and demodification under which a set of values for the dynamic variables constitutes a steady state of the system. The only condition that requires checking is that Equation 26 of Ref. 16 is satisfied. Translating this into the current setting, we need only to show that Equation 1 is satisfied. The values of [S0], [S1], [E], and [F] were defined above using the invariant and the enzyme conservation laws. We can use the conservation laws for Etot and Ftot, to rewrite the invariant as shown
which gives Equation 1, as required. It follows from Theorem 2 of Ref. 16 that we have a unique steady state that is consistent with the chosen values of Stot, Etot, and Ftot. Accordingly, the steady state, and particularly the quantities [S0] and [S1], can be regarded as functions of Stot, Etot, and Ftot.
Existence of the High Substrate Limit
The previous section showed that we can treat [S0] and [S1] as functions of Stot, Etot, and Ftot. We can therefore consider the limiting behavior as Stot → ∞. We want to show that [S0]/Stot and [S1]/Stot converge in this limit. Because the total amount of all the intermediate complexes is bounded above, it is clear that either [S0] or [S1], and possibly both, must increase without limit as Stot → ∞. Suppose, without loss of generality, that [S0] does so. Dividing both sides of the invariant in Fig. 1D by [S0]2, we may rewrite it in terms of [S1]/[S0] and terms that vanish in the limit shown in Equation 18,
 |
It follows that [S1]/[S0] → σ as Stot → ∞ provided there is a solution to Equation 19.
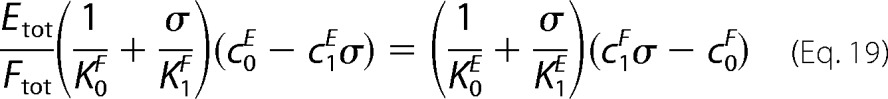 |
This equation, however, has the same form as Equation 10 above and can be shown to have a unique solution by the same argument as in Step 1 above. Accordingly, [S1]/[S0] → σ as Stot → ∞. Using the substrate conservation law in the form of Equation 11, we can now write Equation 20.
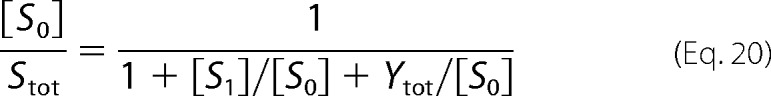 |
Because the intermediates are bounded above and we are assuming that [S0] increases without bound, we find Equation 21.
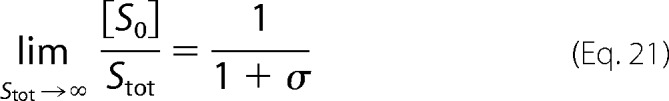 |
For the other substrate form, we can use the conservation law in Equation 11 again. Dividing both sides by Stot and taking the limit as Stot → ∞, we find Equation 22.
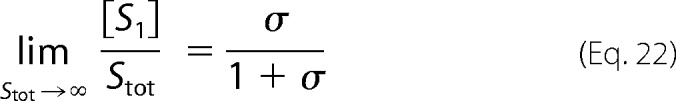 |
These quantities correspond to u0 and u1, respectively, as defined in the text.
Proofs of Switching Formulas
Discrimination between Off and On
If the left-hand side of the invariant in Equation 3 is positive, which is equivalent to Equation 23,
 |
then the right-hand side must also be positive, which is equivalent to Equation 24,
 |
and in particular Equation 25.
 |
It is easy to see that the converse holds, so that this inequality in the efficiency ratios is necessary and sufficient for the two sides of the invariant to be positive. In this case, we get Equation 26.
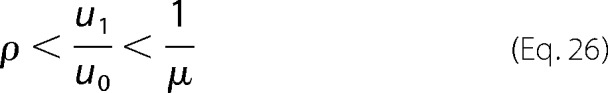 |
Using the fact that u0 + u1 = 1 from Equation 2, we see Equation 27.
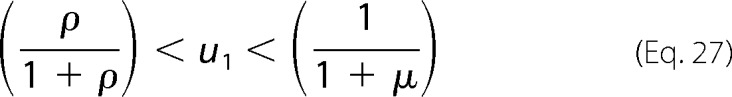 |
If the inequality in the catalytic efficiency ratios is reversed, then both sides of the invariant are negative, and the end points of this interval are reversed. The range of u1 is then given by Equation 28,
 |
which gives Equation 5.
Sharpness at the Transition Point
We want to determine the rate at which u1 changes as a function of t = Etot/Ftot, evaluated at the transition point in Equation 6. It is straightforward to differentiate the invariant in Equation 3 implicitly with respect to t, at the point t = t*, using the fact that du1/dt = -du0/dt, which follows from Equation 2, and that u0 = u1 = 1/2 when t = t*. We find Equation 29,
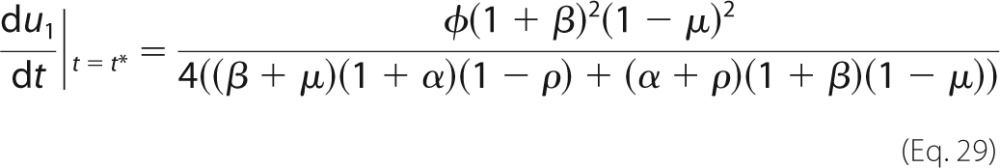 |
which gives Equation 7.
Maximum Sharpness
The sharpness at the transition point may be rewritten by dividing above and below by 1 − μ to achieve Equation 30.
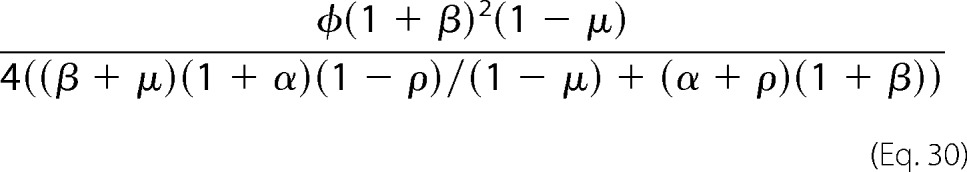 |
Minimizing μ causes the numerator to increase and the denominator to decrease. It follows that, no matter what the values of the other (fixed) parameters, μ = 0 maximizes the sharpness. This corresponds to perfect irreversibility of the forward enzyme, E. The sharpness is then given by Equation 31.
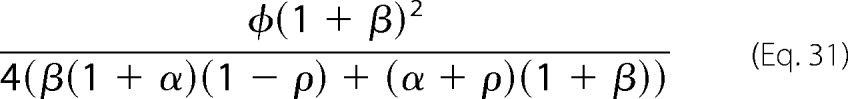 |
The parameter ρ only appears in the denominator, where it has the coefficient 1 − αβ. If the enzymes are biased toward their normal directions, as assumed here, then α,β < 1 and so the coefficient of ρ is positive. Accordingly, the expression in Equation 31 is at a maximum when ρ = 0, corresponding to perfect irreversibility of the reverse enzyme, F. Hence, no matter what the value of the parameters α, β, and φ, the sharpness is at a maximum when both enzymes are perfectly irreversible, as illustrated in Fig. 2B.
Bifunctional Enzyme Behavior
We prove that the bifunctional enzyme E × F, in which the two domains are independent of each other, behaves identically to the two monofunctional enzymes E and F, together with an additional conservation law. This was illustrated in Fig. 3 for reversible Michaelis-Menten mechanisms, but we show here that it holds no matter how complex the mechanisms of E and F, as long as they subscribe to the reaction “grammar” of Ref. 13. This grammar allows any mechanism that can be built up out of three basic reactions as follows: binding of substrate to enzyme to form an intermediate, release of substrate and enzyme from an intermediate, and conversion of one intermediate into another as shown in Reaction 5.
Suppose that E uses intermediates Y1, …, Yn and that F uses intermediates Z1, …, Zm. It will be convenient to set Y0 = E and Z0 = F. If the mechanism of E has a basic reaction of the form shown in Reaction 6,
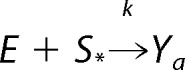 |
where S* is either S0 or S1, then, because the two domains of the bifunctional enzyme operate independently of each other, there are corresponding reactions of the form shown in Reaction 7.
 |
We can summarize these reactions by defining the formal enzyme shown in Equation 32
the formal intermediate shown in Equation 33
and the formal reaction shown in Reaction 8.
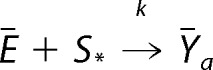 |
Such a formal reaction is just a restatement of the m reactions in Reaction 7, where it is assumed that single component, S*, participates in a proper reaction with each component of the formal enzyme Ē. It is essential for this restatement that the two domains be independent, which is equivalent to each of the reactions in Reaction 7 having the same rate constant, k. This allows k to be “lifted” to the formal reaction in Reaction 8.
We see that Reaction 8 is identical in structure to the basic Reaction 6, with Ē in place of E and Ȳa in place of Ya. A similar restatement using Ē and other formal intermediates, Ȳi for 1 ≤ i ≤ n, defined as in Equation 33, can be undertaken for every basic reaction in Reaction 5 which appears in the mechanism for E. It is clear that this procedure simply reconstructs the mechanism of the enzyme E with the intermediates Y1,···, Yn in terms of the formal enzyme Ē and the formal intermediates Ȳ1,···, Ȳn. An exactly similar construction can be made for F and the intermediates Z1,···, Zm in terms of the formal enzyme shown in Equation 34
and the formal intermediates shown in Equation 35
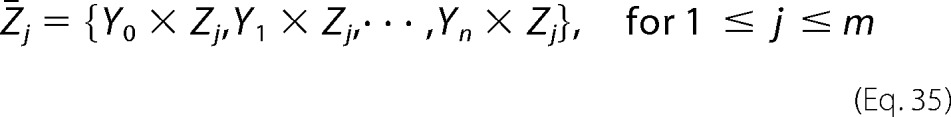 |
to reconstruct the mechanism of F. It follows that the dynamical system defined by E, F, and their respective mechanisms is identical to the dynamical system defined by Ē, F̄, and their respective mechanisms. In addition, we have Equation 36
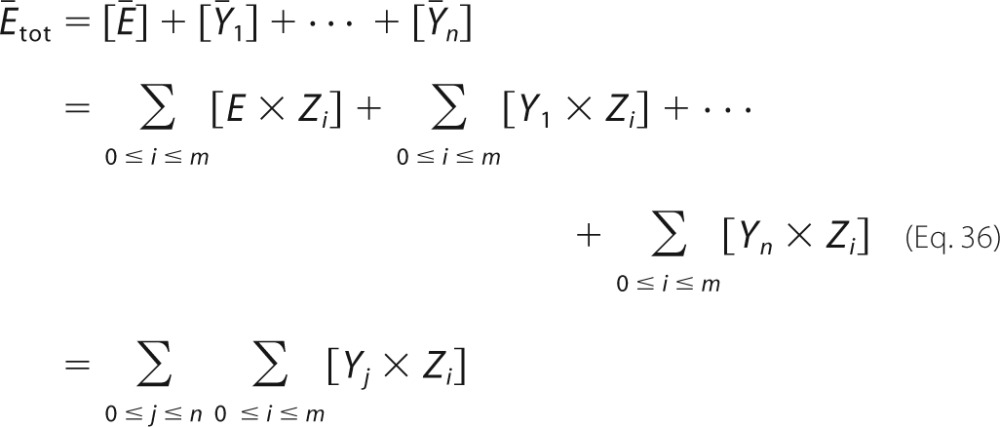 |
and Equation 37
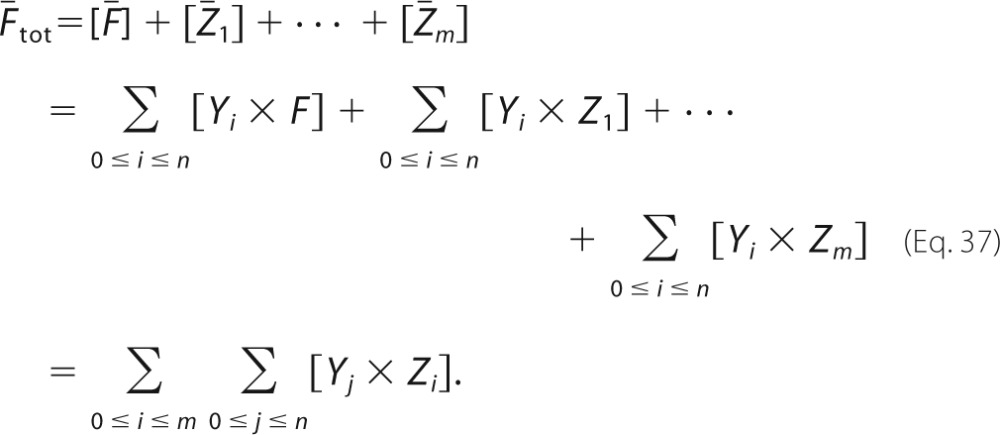 |
It follows by interchange of the summations that Ētot = F̄tot, as required.
This work was supported, in whole or in part, by National Institutes of Health Grant P50 GM068762 (to T. D. and J. G.).
- PFK-2/FBPase-2
- 6-phosphofructo-2-kinase/fructose-2,6-bisphosphatase
- F2,6BP
- fructose 2,6-bisphosphate
- F6P
- fructose 6-phosphate.
REFERENCES
- 1. Shacter-Noiman E., Chock P. B., Stadtman E. R. (1983) Protein phosphorylation as a regulatory device. Philos. Trans. R. Soc. Lond. B Biol. Sci. 302, 157–166 [DOI] [PubMed] [Google Scholar]
- 2. Goldbeter A., Koshland D. E. (1981) An amplified sensitivity arising from covalent modification in biological systems. Proc. Natl. Acad. Sci. U.S.A. 78, 6840–6844 [DOI] [PMC free article] [PubMed] [Google Scholar]
- 3. Malleshaiah M. K., Shahrezaei V., Swain P. S., Michnick S. W. (2010) The scaffold protein Ste5 directly controls a switch-like mating decision in yeast. Nature 465, 101–105 [DOI] [PubMed] [Google Scholar]
- 4. Melen G. J., Levy S., Barkai N., Shilo B.-Z. (2005) Threshold responses to morphogen gradients by zero-order ultrasensitivity. Mol. Syst. Biol. 1, 2005.0208 [DOI] [PMC free article] [PubMed] [Google Scholar]
- 5. Berg O. G., Paulsson J., Ehrenberg M. (2000) Fluctuations and quality of control in biological cells: zero-order ultrasensitivity reinvestigated. Biophys. J. 79, 1228–1236 [DOI] [PMC free article] [PubMed] [Google Scholar]
- 6. Ciliberto A., Capuani F., Tyson J. J. (2007) Modeling networks of coupled enzymatic reactions using the total quasi-steady state approximation. PLoS Comp. Biol. 3, e45. [DOI] [PMC free article] [PubMed] [Google Scholar]
- 7. Gomez-Uribe C., Verghese G. C., Mirny L. A. (2007) Operating regimes of signaling cycles: statics, dynamics and noise filtering. PLoS Comp. Biol. 3, e246. [DOI] [PMC free article] [PubMed] [Google Scholar]
- 8. Qian H. (2003) Thermodynamic and kinetic analysis of sensitivity amplification in biological signal transduction. Biophys. Chem. 105, 585–593 [DOI] [PubMed] [Google Scholar]
- 9. van Albada S. B., ten Wolde R. R. (2007) Enzyme localization can drastically affect signal amplification in signal transduction pathways. PLoS Comp. Biol. 3, e195. [DOI] [PMC free article] [PubMed] [Google Scholar]
- 10. Michaelis L., Menten M. (1913) Die kinetik der Invertinwirkung. Biochem. Z. 49, 333–369 [Google Scholar]
- 11. Ortega F., Acerenza L., Westerhoff H. V., Mas F., Cascante M. (2002) Product dependence and bifunctionality compromise the ultrasensitivity of signal transduction cascades. Proc. Natl. Acad. Sci. U.S.A. 99, 1170–1175 [DOI] [PMC free article] [PubMed] [Google Scholar]
- 12. Blüthgen N., Bruggeman F. J., Legewie S., Herzel H., Westerhoff H. V., Kholodenko B. N. (2006) Effects of sequestration on signal transduction cascades. FEBS J. 273, 895–906 [DOI] [PubMed] [Google Scholar]
- 13. Xu Y., Gunawardena J. (2012) Realistic enzymology for post-translational modification: zero-order ultrasensitivity revisited. J. Theor. Biol. 311, 139–152 [DOI] [PMC free article] [PubMed] [Google Scholar]
- 14. Cornish-Bowden A. (1995) Fundamentals of Enzyme Kinetics, 2nd Ed., Portland Press, London, UK [Google Scholar]
- 15. Thomson M., Gunawardena J. (2009) Unlimited multistability in multisite phosphorylation systems. Nature 460, 274–277 [DOI] [PMC free article] [PubMed] [Google Scholar]
- 16. Thomson M., Gunawardena J. (2009) The rational parameterisation theorem for multisite post-translational modification systems. J. Theor. Biol. 261, 626–636 [DOI] [PMC free article] [PubMed] [Google Scholar]
- 17. Gunawardena J. (2012) A linear framework for time scale separation in nonlinear biochemical systems. PLoS ONE 7, e36321. [DOI] [PMC free article] [PubMed] [Google Scholar]
- 18. Mirzaev I., Gunawardena J. (2013) Laplacian dynamics on general graphs. Bull. Math. Biol. 75, 2118–2149 [DOI] [PubMed] [Google Scholar]
- 19. Gunawardena J. (2014) Time-scale separation: Michaelis and Menten's old idea, still bearing fruit. FEBS J. 281, 473–488 [DOI] [PMC free article] [PubMed] [Google Scholar]
- 20. Okar D. A., Wu C., Lange A. J. (2004) Regulation of the regulatory enzyme, 6-phosphofructo-2-kinase/fructose-2,6-bisphosphatase. Adv. Enzyme Regul. 44, 123–154 [DOI] [PubMed] [Google Scholar]
- 21. Kurland I. J., Chapman B., El-Maghrabi M. R. (2000) N and C termini modulate the effects of pH and phosphorylation on hepatic 6-phospho-fructo-2-kinase/fructose-2,6-bisphosphatse. Biochem. J. 347, 459–467 [DOI] [PMC free article] [PubMed] [Google Scholar]
- 22. Pilkis S. J., Claus T. H., Kountz P. D., El-Maghrabi M. R. (1987) in The Enzymes: Control by Phosphorylation (Boyer P. D., Krebs E. G., eds) Part B, Vol. XVIII, pp. 4–46, Academic Press, Orlando, FL [Google Scholar]
- 23. El-Maghrabi M. R., Pate T. M., Pilkis S. J. (1984) Characterization of the exchange reactions of 6-phosphofructo-2-kinase/fructose-2,6-bisphosphatase. Biochim. Biophys. Res. Commun. 123, 749–756 [DOI] [PubMed] [Google Scholar]
- 24. Okar D. A., Manzano A., Navarro-Sabatè A., Riera L., Bartrons R., Lange A. J. (2001) PFK-2/FBPase-2: maker and breaker of the essential biofactor fructose-2–6-bisphosphate. Trends Biochem. Sci. 26, 30–35 [DOI] [PubMed] [Google Scholar]
- 25. Mallavarapu A., Thomson M., Ullian B., Gunawardena J. (2009) Programming with models: modularity and abstraction provide powerful capabilities for systems biology. J. R. Soc. Interface 6, 257–270 [DOI] [PMC free article] [PubMed] [Google Scholar]
- 26. Gibson D. A., Harris R. A. (2002) Metabolic Regulation in Mammals, Taylor & Francis, London, UK [Google Scholar]
- 27. Manrai A. K., Gunawardena J. (2008) The geometry of multisite phosphorylation. Biophys. J. 95, 5533–5543 [DOI] [PMC free article] [PubMed] [Google Scholar]
- 28. Karp R. L., Pérez Millán M., Dasgupta T., Dickenstein A., Gunawardena J. (2012) Complex-linear invariants of biochemical networks. J. Theor. Biol. 311, 130–138 [DOI] [PubMed] [Google Scholar]
- 29. Dexter J. P., Gunawardena J. (2013) Dimerization and bifunctionality confer robustness to the isocitrate dehydrogenase regulatory system in Escherichia coli. J. Biol. Chem. 288, 5770–5778 [DOI] [PMC free article] [PubMed] [Google Scholar]
- 30. Markevich N. I., Hoek J. B., Kholodenko B. N. (2004) Signalling switches and bistability arising from multisite phosphorylation in protein kinase cascades. J. Cell Biol. 164, 353–359 [DOI] [PMC free article] [PubMed] [Google Scholar]
- 31. Hopfield J. J. (1974) Kinetic proofreading: a new mechanism for reducing errors in biosynthetic processes requiring high specificity. Proc. Natl. Acad. Sci. U.S.A. 71, 4135–4139 [DOI] [PMC free article] [PubMed] [Google Scholar]
- 32. Beard D. A., Qian H. (2008) Chemical Biophysics: Quantitative Analysis of Cellular Systems. Cambridge Texts in Biomedical Engineering, Cambridge University Press, Cambridge, UK [Google Scholar]
- 33. Feinerman O., Veiga J., Dorfman J. R., Germain R. N., Altan-Bonnet G. (2008) Variability and robustness in T cell activation from regulated heterogeneity in protein levels. Science 321, 1081–1084 [DOI] [PMC free article] [PubMed] [Google Scholar]
- 34. Spencer S. L., Gaudet S., Albeck J. G., Burke J. M., Sorger P. K. (2009) Non-genetic origins of cell-to-cell variability in TRAIL-induced apoptosis. Nature 459, 428–432 [DOI] [PMC free article] [PubMed] [Google Scholar]
- 35. Saier M. H. (1987) Enzymes in Metabolic Pathways: A Comparative Study of Mechanism, Structure, Evolution and Control. Harper and Row, New York [Google Scholar]
- 36. Mor I., Cheung E. C., Vousden K. H. (2011) Control of glycolysis through regulation of PFK1: old friends and recent additions. Cold Spring Harbor Symp. Quant. Biol. 76, 211–216 [DOI] [PubMed] [Google Scholar]
- 37. El-Maghrabi M. R., Noto F., Wu N., Manes N. (2001) 6-Phosphofructo-2-kinase/fructose-2,6-bisphosphatase: suiting structure to need, in a family of tissue-specific enzymes. Curr. Opin. Clin. Nutr. Metab. Care 4, 411–418 [DOI] [PubMed] [Google Scholar]
- 38. Rider M. H., Bertrand L., Vertommen D., Michels P. A., Rousseau G. G., Hue L. (2004) 6-Phosphofructo-2-kinase/fructose-2,6-bisphosphatase: head-to-head with a bifunctional enzyme that controls glycolysis. Biochem. J. 381, 561–579 [DOI] [PMC free article] [PubMed] [Google Scholar]
- 39. Goldstein B. N., Maevsky A. A. (2002) Critical switch of the metabolic fluxes by phosphofructo-2-kinase:fructose-2,6-bisphosphatase. A kinetic model. FEBS Lett. 532, 295–299 [DOI] [PubMed] [Google Scholar]
- 40. Batchelor E., Goulian M. (2003) Robustness and the cycle of phosphorylation and dephosphorylation in a two-component regulatory system. Proc. Natl. Acad. Sci. U.S.A. 100, 691–696 [DOI] [PMC free article] [PubMed] [Google Scholar]
- 41. Shinar G., Milo R., Martínez M. R., Alon U. (2007) Input-output robustness in simple bacterial signaling systems. Proc. Natl. Acad. Sci. U.S.A. 104, 19931–19935 [DOI] [PMC free article] [PubMed] [Google Scholar]
- 42. Shinar G., Rabinowitz J. D., Alon U. (2009) Robustness in glyoxylate bypass regulation. PLoS Comp. Biol. 5, e1000297. [DOI] [PMC free article] [PubMed] [Google Scholar]
- 43. Hart Y., Madar D., Yuan J., Bren A., Mayo A. E., Rabinowitz J. D., Alon U. (2011) Robust control of nitrogen assimilation by a bifunctional enzyme in E. coli. Mol. Cell 44, 117–127 [DOI] [PubMed] [Google Scholar]
- 44. Hart Y., Mayo A. E., Milo R., Alon U. (2011) Robust control of PEP formation rate in the carbon fixation pathway of C4 plants by a bifunctional enzyme. BMC Syst. Biol. 5, 171. [DOI] [PMC free article] [PubMed] [Google Scholar]
- 45. Hart Y., Alon U. (2013) The utility of paradoxical components in biological circuits. Mol. Cell 49, 213–221 [DOI] [PubMed] [Google Scholar]
- 46. Shinar G., Feinberg M. (2010) Structural sources of robustness in biochemical networks. Science 327, 1389–1391 [DOI] [PubMed] [Google Scholar]
- 47. Smith W. E., Langer S., Wu C., Baltrusch S., Okar D. A. (2007) Molecular coordination of hepatic glucose metabolism by the 6-phosphofructo-2-kinase/fructose-2,6-bisphosphatase:glucokinase complex. Mol. Endocrinol. 21, 1478–1487 [DOI] [PubMed] [Google Scholar]
- 48. Jungermann K., Thurman R. G. (1992) Hepatocyte heterogeneity in the metabolism of carbohydrates. Enzyme 46, 33–58 [DOI] [PubMed] [Google Scholar]
- 49. Torre C., Perret C., Colnot S. (2010) Molecular determinants of liver zonation. Prog. Mol. Biol. Transl. Sci. 97, 127–150 [DOI] [PubMed] [Google Scholar]
- 50. Atsumi T., Chesney J., Metz C., Leng L., Donnelly S., Makita Z., Mitchell R., Bucala R. (2002) High expression of inducible 6-phosphofructo-2-kinase/fructose-2,6-bisphosphatase (iPFK-2; PFKFB3) in human cancers. Cancer Res. 62, 5881–5887 [PubMed] [Google Scholar]
- 51. Fersht A. (1985) Enzyme Structure and Mechanism. W. H. Freeman & Company, New York [Google Scholar]
- 52. Anderson K. S. (2003) in Kinetic Analysis of Macromolecules: A Practical Approach (Johnson K. A., ed) pp. 19–47, Oxford University Press, Oxford, UK [Google Scholar]
- 53. Straube R. (2013) Sensitivity and robustness in covalent modification cycles with a bifunctional converter enzyme. Biophys. J. 105, 1925–1933 [DOI] [PMC free article] [PubMed] [Google Scholar]
- 54. Michels P. A., Rigden D. J. (2006) Evolutionary analysis of fructose 2,6-bisphosphate metabolism. IUBMB Life 58, 133–141 [DOI] [PubMed] [Google Scholar]
- 55. Johnson L. N. (2009) The regulation of protein phosphorylation. Biochem. Soc. Trans. 37, 627–641 [DOI] [PubMed] [Google Scholar]
- 56. LaPorte D. C., Koshland D. E. (1983) Phosphorylation of isocitrate dehydrogenase as a demonstration of enhanced sensitivity in covalent regulation. Nature 305, 286–290 [DOI] [PubMed] [Google Scholar]
- 57. Pilkis S. J., Claus T. H., Kurland I. J., Lange A. J. (1995) 6-phosphofructo-2-kinase/fructose-2,6-bisphosphatase: a metabolic signaling enzyme. Annu. Rev. Biochem. 64, 799–835 [DOI] [PubMed] [Google Scholar]