

Background: The bacterium Dinoroseobacter shibae was exposed to environmental anoxia.
Results: Systems biology analyses showed the time-resolved cellular adaptation processes of D. shibae during oxygen depletion.
Conclusion: Oxygen depletion led to a metabolic crisis due to the missing regeneration of ATP and reduction equivalents, until denitrification was established.
Significance: Here we have elucidated the adaptation processes of marine bacteria to anoxic respiration.
Keywords: Energy Metabolism, Metabolism, Metabolomics, Proteomics, Respiration, Systems Biology, Transcriptomics, Roseobacter, Polyhydroxybutanoate
Abstract
Metabolic flexibility is the key to the ecological success of the marine Roseobacter clade bacteria. We investigated the metabolic adaptation and the underlying changes in gene expression of Dinoroseobacter shibae DFL12T to anoxic life by a combination of metabolome, proteome, and transcriptome analyses. Time-resolved studies during continuous oxygen depletion were performed in a chemostat using nitrate as the terminal electron acceptor. Formation of the denitrification machinery was found enhanced on the transcriptional and proteome level, indicating that D. shibae DFL12T established nitrate respiration to compensate for the depletion of the electron acceptor oxygen. In parallel, arginine fermentation was induced. During the transition state, growth and ATP concentration were found to be reduced, as reflected by a decrease of A578 values and viable cell counts. In parallel, the central metabolism, including gluconeogenesis, protein biosynthesis, and purine/pyrimidine synthesis was found transiently reduced in agreement with the decreased demand for cellular building blocks. Surprisingly, an accumulation of poly-3-hydroxybutanoate was observed during prolonged incubation under anoxic conditions. One possible explanation is the storage of accumulated metabolites and the regeneration of NADP+ from NADPH during poly-3-hydroxybutanoate synthesis (NADPH sink). Although D. shibae DFL12T was cultivated in the dark, biosynthesis of bacteriochlorophyll was increased, possibly to prepare for additional energy generation via aerobic anoxygenic photophosphorylation. Overall, oxygen depletion led to a metabolic crisis with partly blocked pathways and the accumulation of metabolites. In response, major energy-consuming processes were reduced until the alternative respiratory denitrification machinery was operative.
Introduction
Dinoroseobacter shibae DFL12T belongs to the family of Rhodobacteriaceae within the Alphaproteobacteria (1, 2). The Gram-negative D. shibae DFL12T is a member of the Roseobacter clade, which is highly abundant in marine habitats (2, 3). This heterogeneous group of bacteria exhibits a wide potential of metabolic capacities (2). Therefore, they play a major role in the remineralization of the oceans and thus in the global carbon cycle (4). The mixotrophic D. shibae DFL12T can utilize a relatively small range of carbon sources like carboxylic acids, glucose, and glycerol. However, it is not able to grow with butanoate, ethanol, or methanol (1, 5). Because a phosphofructokinase activity is missing, D. shibae DFL12T uses the Entner-Doudoroff pathway instead of the standard glycolysis pathway (6). Moreover, D. shibae DFL12T is able to perform aerobic anoxygenic photophosphorylation to gain additional energy (1). Recently, the anaerobic growth of D. shibae DFL12T using nitrate as a terminal electron acceptor was shown (7). Indeed, the 4.4-Mb genome of D. shibae DFL12T contains genes encoding enzymes of the denitrification pathway (8). Denitrification is the reduction of nitrate in four sequential steps into dinitrogen by the concomitant generation of a proton-motive force, which fuels ATP synthesis via ATPase (9). Interestingly, the bacterium possesses a nap operon encoding the periplasmic nitrate reductase NapA (EC 1.7.99.4) catalyzing the reduction of NO3− to NO2− instead of a cytoplasmic NarG nitrate reductase (EC 1.7.99.4) as known from other denitrifying bacteria (9). The nir operon encoding the periplasmic nitrite reductase NirS (EC 1.7.2.1) that catalyzes the reduction of NO2− to NO, the nor operon encoding the nitric oxide reductase NorB (EC: 1.7.2.5) that reduces NO to N2O, and the nos operon encoding the nitrous oxide reductase NosZ (EC: 1.7.2.4) that converts N2O to N2 are also present in the genome of D. shibae DFL12T (8, 9). Furthermore, D. shibae DFL12T possesses genes for the assimilatory nitrate reductase NasA (EC 1.7.99.4) and the two subunits of the assimilatory nitrite reductase NasDE (EC 1.7.1.4). Additionally, genes for high affinity cbb3-type cytochrome c oxidases and alternative oxygen-independent NADH dehydrogenases necessary for energy generation via anaerobic respiration were identified in the genome of D. shibae DFL12T (8). This gene cluster (ccoGHI, NOQS) is widespread in bacteria of the Roseobacter clade but was not found as a gene cluster in 30 other analyzed bacteria; no orthologues are found in other bacteria, only a few orthologues concerning the enzyme activity.
Genes encoding enzymes of fermentative pathways are also present in the genome of D. shibae DFL12T (8). The arcABC operon encodes enzymes mediating the conversion of arginine to ornithine with the concomitant production of one ATP under anoxic conditions (10). Moreover, genes necessary for mixed acid fermentation were identified in the genome of D. shibae DFL12T (8). With its genetic equipment, D. shibae DFL12T should be able to convert pyruvate to acetate and ethanol. However, experimental details of its regulatory and metabolic response to lack of oxygen are still missing.
Recently, a transposon mutagenesis study using D. shibae DFL12T identified nitrate reductase and corresponding cofactor-synthesizing enzyme-encoding genes as essential for anaerobic growth (11). Surprisingly, chromosomal and plasmid-encoded genes involved in membrane-localized sodium gradient-dependent processes, genomic rearrangements, and cellular envelope restructuring were indispensable for growth without oxygen (11). Until now, our knowledge about the details of the metabolic processes in Roseobacter clade members has been rather limited. Recently, first systems biology-oriented studies with Phaeobacter inhibens DSM 17395 (formerly deposited as Phaeobacter gallaeciensis DSM 17395) (12) were published covering the analysis of the proteomic and metabolic response to rich medium and amino acid-containing medium (13, 14). In comparison with D. shibae DFL12T, P. inhibens DSM 17395 is able to degrade a wide range of carbon sources. It shows a preference for amino acids as carbon sources related to its habitat (15). This underlines the need for systematic investigations of this group of bacteria as a precondition to unravel the survival strategies of Roseobacter clade bacteria in the marine environment.
Here, we present a systematic investigation using transcriptome, proteome, and metabolome analysis to unravel the metabolic adaptation of D. shibae DFL12T to oxygen depletion with nitrate as the terminal electron acceptor.
EXPERIMENTAL PROCEDURES
Chemostat Cultivation of D. shibae DFL12T
Continuous cultivation of D. shibae DFL12T was performed in salt water minimal medium with 5 mm succinate as a carbon source and 25 mm nitrate as an alternative electron acceptor in an Inforce HT Multifors 2 reactor (Infors, Bottmingen, Switzerland) at 30 °C, pH 8.0, with aeration of 0.7 liter of air/min and a stirring speed of 150 rpm. The working volume of the reactor was 1 liter. The chemostat was protected from light by covering with aluminum foil to avoid aerobic anoxygenic photosynthesis of D. shibae DFL12T. Inoculation, starting of the continuous cultivation, and the anaerobic shift were done as described before (11). Nitrate at a concentration of 25 mm was continuously supplemented to the culture. Fig. 1 shows the consumption of the residual oxygen and the slightly decreasing cell, optical density, and time points of sampling for the observation of the adaptation.
FIGURE 1.
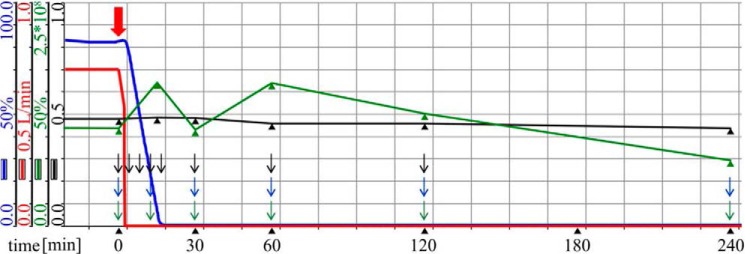
Continuous cultivation of D. shibae DFL12T under oxygen-depleted conditions. D. shibae DFL12T was grown under continuous aerated conditions in salt water minimal medium supplemented with 25 mm nitrate to the steady state. Shown are aeration (red line), the oxygen partial pressure (blue line), colony-forming units (green line), and the cell density A578 (black line). The red arrow indicates the time point when the oxygen supply (red line) was switched off. Black arrows indicate sampling time points for transcriptome analyses, green arrows indicate proteome sampling time points, and blue arrows indicate sampling time points for metabolome analyses.
Determination of Nitrate and Nitrite
For determination of the nitrate concentration, a 2-ml sample of a D. shibae DFL12T culture was heated for 20 min at 80 °C and centrifuged for 3 min at 10,000 × g, and the supernatant was sterilized using a cellulose-acetate filter with a pore size of 0.2 μm (Sarstedt, Nümbrecht, Germany). The investigated time points were prior to the anaerobic shift (0 min) and 15, 30, 60, 120, and 240 min after the oxygen supply was switched off. The determination of nitrate and nitrite was performed using the nitrite/nitrate colorimetric test (Roche Applied Science) according to the manufacturer's instructions.
Microarray Experiment and Data Analysis
A whole genome microarray of D. shibae DFL12T from Agilent (8 × 15K format; Agilent, Santa Clara, CA) was used as described before (16). Time-resolved transcriptome analyses were performed with three technical and three biological replicates. Pairwise comparisons of obtained expression rates for different time points after the shift to anoxic conditions with data obtained prior to anaerobic shift (0 min) were made (Table 1). The investigated time points were 5, 10, 15, 20, 30, 60, and 120 min after the oxygen supply was switched off (Fig. 1). Cell harvesting, RNA isolation, and DNA arrays were processed as described before (11). The data discussed here have been deposited in the NCBI Gene Expression Omnibus (17) and are accessible through GEO Series accession number GSE47445. Genes were considered to be differently transcribed with a -fold change above 1.7 (supplemental Table S1).
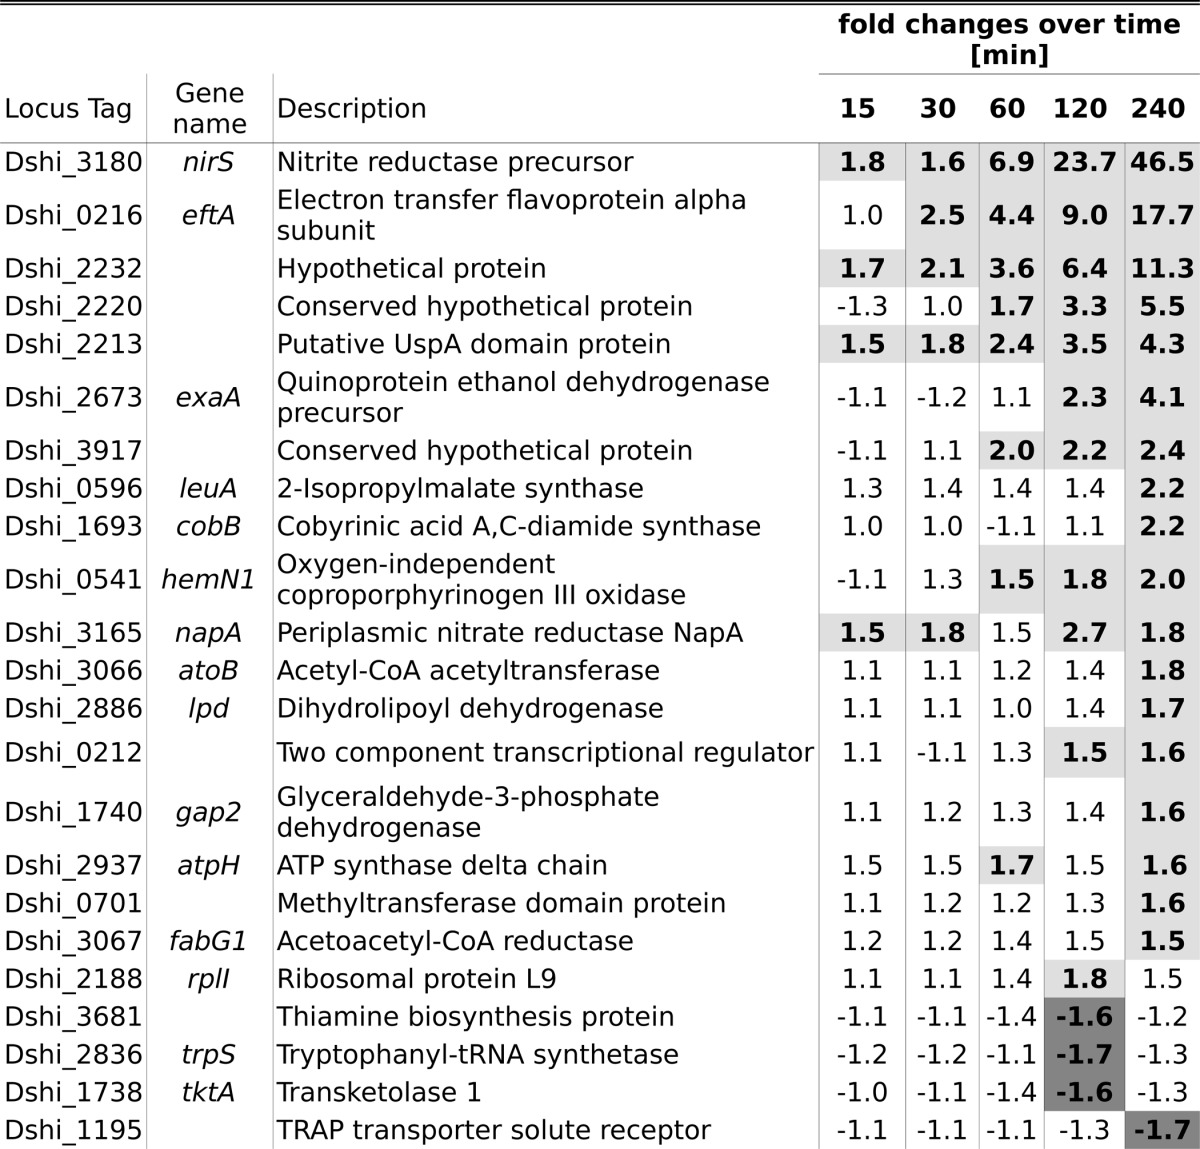
TABLE 1.
-Fold changes of proteins displaying significantly changed abundances relative to aerobic growth as determined by 2D-DIGE
Shading corresponds to an abundance change ≥1.5 (light gray) or ≤−1.5 (dark gray).
Shotgun Proteome Analysis by Nanoliquid Chromatography-Electrospray Ionization Tandem Mass Spectrometry (Nano-LC-ESI-MS/MS)
The investigated time points were 15, 30, 60, 120, and 240 min after the oxygen supply was switched off (Fig. 1). Cell pellets of ∼50 mg wet weight were resuspended in 200 μl of lysis buffer, and cells were disrupted using the PlusOne grinding kit (GE Healthcare) as described before (13). Protein concentration was determined according to a method described previously (18). Following reduction and alkylation of 50 μg of total cellular protein, proteolytic digest was performed overnight with 0.5 μg of trypsin GOLD (Promega, Mannheim, Germany). Finally, 1 μg of total digested protein was separated applying a 215-min gradient of increasing acetonitrile concentration using an UltiMate 3000 nano-LC (Thermo Scientific, Bremen, Germany) online-coupled to an electrospray-ionization ion trap mass spectrometer (amaZon ETD, Bruker Daltonik GmbH, Bremen, Germany) operated as described before (13). Three biological replicates were analyzed.
Protein identification was performed with ProteinScape (version 3.0; Bruker Daltonik GmbH) on a Mascot server (version 2.3; Matrix Science Ltd., London, UK) searching against a genomic database of D. shibae DFL12T translated into amino acid sequences, including a target-decoy strategy. A single missed cleavage was allowed for tryptic peptides. Furthermore, carbamidomethylation (cysteine) as a fixed modification and oxidation of methionine as a variable modification as well as a mass tolerance (monoisotopic) of 0.4 Da for MS and MS/MS were chosen. Searching was restricted to doubly and triply charged peptides. The instrument type was ESI-TRAP. A false discovery rate of <1.0% was set. The significance threshold was p < 0.05, and only peptides with a Mascot score of >25 were considered for protein identification.
Analysis of the Membrane Protein-enriched Fraction by Nano-LC-ESI-MS/MS
The investigated time points were 15, 30, 60, 120, and 240 min after the oxygen supply was switched off (Fig. 1). Preparation and SDS-PAGE separation of the membrane protein-enriched fraction was performed as described recently (13). For each sample, one gel lane was cut into 11 slices that were further cut into smaller pieces for washing, reduction, alkylation, and tryptic digest as described before (13). Separation of generated peptides was performed with an UltiMate 3000 nano-LC (Thermo Scientific) applying a 95-min linear gradient of increasing acetonitrile concentration (13). Mass spectrometric analysis of the nano-LC eluent was performed with an online-coupled ion trap mass spectrometer (amaZon ETD; Bruker Daltonics GmbH) operated as described before (13). Protein identification was performed as outlined above.
Analysis of Soluble Proteins by Two-dimensional Difference Gel Electrophoresis (2D-DIGE)3 and Protein Identification by MALDI-TOF-MS/MS
Time-resolved proteome analysis was performed with three biological replicates. Pairwise comparisons with data obtained prior to anaerobic shift (0 min) were made. The investigated time points were 15, 30, 60, 120, and 240 min after the oxygen supply was switched off (Fig. 1). 40 ml of culture were harvested and centrifuged for 5 min (4 °C, 10,000 × g), and the cell pellet was washed with 1 ml of 100 mm Tris-HCl (pH 7.5) supplemented with 5 mm MgCl2 and centrifuged for 3 min (4 °C, 13,400 rpm, Minispin, Eppendorf, Hamburg, Germany) to yield 50 mg wet weight. Resuspension of cells and cell breakage were performed as described recently (13). Subsequent protein content determination was done according to the method described previously (18), and pre-electrophoretic labeling was carried out as described before (19). Protein extracts of cells grown under oxic conditions (0 min) served as reference state and were labeled with Cy5. Protein extracts of cells harvested after shutdown of the oxygen supply served as test states and were each labeled with Cy3. The internal standard was composed of equal amounts of all test states and the reference state and was labeled with Cy2. Isoelectric focusing (pH range of 3.0–5.6 and 3–11 non-linear) and second dimension separation were performed as described previously (13). Spots fulfilling the following criteria were considered to have significantly different abundances: -fold change of ≤−1.5 or ≥1.5 (20), an analysis of variance p value of <0.05, t test value of <10−4, and matched in at least 75% of the analyzed gel images.
For protein identification, the 2D-DIGE gels were stained with colloidal Coomassie Brilliant Blue as described before (12), and spots of interest were robotically excised using the EXQuest spot cutter (Bio-Rad). In-gel digest, sample spotting, and acquisition of mass spectra by MALDI-TOF-MS with an UltrafleXtreme MALDI-TOF/TOF mass spectrometer (Bruker Daltonik GmbH) as well as protein identification with a mass tolerance of 50 ppm (MS) and 100 ppm (MS/MS) were performed as reported before (13).
Poly-3-hydroxybutanoate (PHB) Determination
Time-resolved analysis of PHB concentration was performed in three biological replicates. The investigated time points were 0 min (before stopping the aeration), 15, 30, 60, 120, and 240 min after oxygen supply was switched off.
2 ml of the chemostat culture were harvested and centrifuged for 5 min at 10,000 × g and 4 °C. The cells were hydrolyzed with 2 m NaOH as described previously (21). In parallel, standards with pure PHB (Sigma-Aldrich) were hydrolyzed in the same way. PHB was then quantified by HPLC (La Chrome EliteR HPLC, HWR-Hitachi International HPLC, Darmstadt, Germany) using an Aminex HPX-87H column (300 mm × 7.8 mm; Bio-Rad) at 45 °C with 12 mm H2SO4 as mobile phase with a flow rate of 0.5 ml min−1 and UV detection at 210 nm.
Metabolome Analysis
Cultures were harvested and washed as described previously (22) with the exception of using 3.5% (w/v) sodium chloride solution for washing; centrifugation was performed at 8819 × g for 3 min. Pairwise comparisons with data obtained prior to anaerobic shift (0 min) were made. The investigated time points were 15, 30, 60, 120, and 240 min after the oxygen supply was switched off (Fig. 1). Intracellular metabolites were extracted as described previously (23) with the exceptions of using 0.75 ml of ethanol, containing 15 μl of a 0.2 mg/ml ribitol solution, for resuspension and 0.75 ml of iced water for further extraction. After chloroform extraction, 0.75 ml of the polar phase were withdrawn and dried in a vacuum concentrator overnight. The two-step derivatization reaction was performed as described recently (14). Gas chromatography (GC) was performed with a 7890 Agilent GC chromatograph, equipped with a ZB-5MS column (30 m × 0.25-mm inner diameter, 25-μm particle size; Phenomenex, Aschaffenburg, Germany). MS analysis of intracellular metabolites was performed as described recently (13, 14) using a Leco Pegasus 4D GCxGC-TOF-MS (Leco Instrumente, Mönchengladbach, Germany) operated in GC-TOF mode and equipped with an MPS 2 XL autosampler (Gerstel, Mühlheim an der Ruhr, Germany); full-scan mass spectra were collected from m/z 45 to 600 at 4 scans/s, and the re-equilibration time at 330 °C was shortened from 8 to 3 min.
Data analysis was done with the Metabolite Detector software (24) as described recently (14). Data were normalized by cell mass (7 mg cell dry weight), the internal standard ribitol, and finally by central normalization. Changes in metabolite concentrations extending a threshold of 1.5 were analyzed (supplemental Table S2).
Cultivation for ATP Measurement
For the ATP measurement D. shibae DFL12T was cultivated in darkness in salt water minimal medium at 30 °C and a stirring speed of 150 rpm, supplying 16.9 mm succinate as a carbon source and 25 mm nitrate as an alternative electron acceptor. After the culture reached an optical density A600 of 0.9, the culture was converted into 50-ml falcons and transferred to an anaerobic chamber, and the stirring was stopped.
Measurement of ATP
For determination of the ATP content, about 500 μl of culture were quick-frozen by using liquid nitrogen. Afterward, the samples were diluted (5-fold; only reference was diluted 20-fold). In the following, ATP levels were determined by the BacTiter-Glo Microbial Cell Viability Assay (Promega, Germany) following the manufacturer's instructions, using a sample volume of 50 μl. ATP content was determined using a calibration curve (range 1.25–20 pmol). The investigated time points were 0, 15, 30, 60, 120, 180, 240, 300, and 360 min after oxygen shutdown. Data were normalized by cell mass.
Transmission Electron Microscopy
One ml of cell culture was taken from the chemostat after 0, 15, 30, 60, 120, and 240 min. Samples were centrifuged (5 min, 15,000 × g, 4 °C), the supernatant was discarded, and cell pellets were stored at −80 °C until further processing. Cells were fixed with 2% glutaraldehyde, 5% formaldehyde in cacodylate buffer for 1 h on ice, washed with buffer, and further fixed with 1% aqueous osmium for 1 h at room temperature. Samples were then dehydrated with a graded series of acetone (10, 30, 50%). At the 70% dehydration step, samples were left overnight in 70% acetone containing 2% uranylacetate and further dehydrated with 90 and 100% acetone. Samples were then embedded in the epoxy resin Spurr according to procedures described previously (25). Ultrathin sections were cut with a diamond knife, picked up with Butvar-coated grids, counterstained with uranyl acetate and lead citrate, and examined in a TEM910 transmission electron microscope (Carl Zeiss) at an acceleration voltage of 80 kV. Images were recorded digitally at calibrated magnifications of ×5000 (×4000 for the 15 min image) with a Slow-Scan CCD camera (ProScan, 1024 × 1024, Scheuring, Germany) with ITEM software (Olympus Soft Imaging Solutions, Münster, Germany). Contrast and brightness were adjusted with Adobe Photoshop CS3.
RESULTS AND DISCUSSION
Physiological Adaptation of D. shibae DFL12T to Oxygen Depletion
A combination of transcriptome, proteome, and metabolome analyses served to investigate the dynamic metabolic adaptation of D. shibae DFL12T to oxygen limitation. For this purpose, D. shibae DFL12T was cultivated in an aerated chemostat at steady state. After two reactor residence time periods, the aeration was switched off, and the oxygen concentration in the culture decreased within 20 min to 0.05 μm (Fig. 1), establishing microoxic to anoxic conditions. The A578 slightly decreased from 0.5 to 0.45, and the viable cell count decreased from 1.1 × 10⁸ to 7.2 × 10⁷ cfu/ml within the first 60 min after the oxygen shutdown (Fig. 1). Electron microscopy analyses of the culture at different time points revealed a constant cell size but an accumulation of strongly refractive intracellular granula (see below). Nitrate at a concentration of 25 mm was continuously supplemented to the culture. During prolonged time of anoxic cultivation, the nitrate concentration in the effluent of the reactor was found constant at 20 mm, indicating that D. shibae DFL12T utilized the supplied nitrate. Because the medium also contained a 4.7 mm concentration of the preferred, already reduced nitrogen source ammonium chloride and the concentration of the toxic reduction product nitrite was below the detection limit in the effluent at all sample time points, a complete reduction of nitrate to dinitrogen via denitrification was concluded.
We intended to systematically determine the cellular dynamics during adaptation of D. shibae DFL12T to oxygen limitation to identify key enzymes and metabolic pathways used by this bacterium during oxygen depletion. Time-resolved studies exhibited 792 genes differently transcribed over a prolonged time of oxygen depletion, indicating a complex adaptation process of D. shibae DFL12T (Table 2). The strongest transcriptional response was reached 30 min after oxygen shutdown (Table 3). The adaptation of the proteome was much slower where the maximal difference compared with aerobic growth was observed 240 min after oxygen shutdown (Tables 1 and 3). In total, 875 different proteins were identified by shotgun analysis, and 1210 were identified in the membrane protein-enriched fraction. Interestingly, 2D-DIGE analysis revealed only 23 (of 1325 separated protein spots) differentially formed proteins upon oxygen limitation, 19 of which had increased and 4 of which had decreased abundance (Table 1). Apparently, the observed strong transcriptional adaptation is not completely translated into an adaptation on the proteome level as observed for other adaptation processes (26). Moreover, the production of metabolically active enzymes is controlled by substrate availability rather than by oxygen concentration (27, 28).
TABLE 2.
Numbers of transcripts, proteins, and metabolites of D. shibae DFL12T with differential abundances upon prolonged time of oxygen depletion
| Increased | Reduced | Total | |
|---|---|---|---|
| Transcripts | 314 | 478 | 792 |
| Proteinsa | 19 | 4 | 23 |
| Metabolites | 48 | 32 | 89 |
a Here only 2D-DIGE results are shown.
TABLE 3.
Mean absolute -fold changes between the pairwise compared cellular states over all differently expressed genes, proteins, and all metabolites
| Mean fold changes |
||||||||
|---|---|---|---|---|---|---|---|---|
| 5 min | 10 min | 15 min | 20 min | 30 min | 60 min | 120 min | 240 min | |
| Transcriptome | 1.91 | 1.17 | 1.37 | 1.75 | 4.16 | 3.06 | 2.54 | NDa |
| Proteomeb | ND | ND | 1.22 | ND | 1.33 | 1.87 | 3.27 | 5.14 |
| Metabolome | ND | ND | 1.4 | ND | 2.71 | 3.37 | 2.60 | 1.83 |
a ND, not determined.
b Differently abundant proteins detected by 2D-DIGE were considered.
The concentration of 80 identified metabolites changed over time, with 48 metabolites showing increased and 32 showing decreased concentrations. The hierarchical cluster analysis over all metabolites revealed the first clear differences from the aerobic situation 30 min after oxygen shutdown, followed by a major shift between 30 and 60 min (Fig. 2 and Table 3). The results from the transcriptome, proteome, and metabolome analyses were combined to unravel the metabolic networks involved in the adaptation of D. shibae DFL12T to anoxic, nitrate-reducing conditions.
FIGURE 2.

Hierarchical cluster analysis of metabolome data. Hierarchical cluster analysis of metabolome data was done with TIGRMeV4 (46) using a critical p value of 0.05 and the adjusted Bonferroni correction.
The Denitrification Machinery Substitutes for Oxygen Respiration
The transcription of genes and the abundances of corresponding enzymes of the denitrification pathway were found significantly induced starting 20 min after oxygen shutdown (supplemental Table S4 and Fig. 3). Because sufficient nitrogen in the reduced form was present in the growth medium, nitrate assimilation (NasA, NasDE) was not influenced by the change in oxygen tension.
FIGURE 3.

Electron transport and energy generation in D. shibae DFL12T grown under anoxic, nitrate-reducing conditions. a, schematic representation of the denitrification apparatus present in D. shibae DFL12T. Shown are periplasmic nitrate reductase (NapA), nitrite reductase (NirS), nitric oxide reductase (NorB), nitrous oxide reductase (NosZ), ATPase, NADH dehydrogenase (NuoA-N), quinone pool (Q), electrons (e−), cytochrome c (Cyt c), and cytochrome bc1 (Cyt bc1). b, expression dynamics of genes encoding the enzymes involved in denitrification: napA, nirS, norB, and nosZ. c, protein abundance as detected via membrane proteome and shotgun analyses: NapA, NirS, NorB, and NosZ. d, time-dependent abundance increase of NirS (marked by a white circle) as detected by 2D-DIGE.
The nap operon (Dshi_3161-Dshi_3167) encoding the periplasmic nitrate reductase Nap (EC 1.7.99.4), which catalyzes the first step of denitrification, was only slightly induced (e.g. napA 4.4-fold, 30 min after oxygen shutdown; Fig. 3, a and b). Furthermore, the NapA protein was also found in significant amounts under oxic conditions in the proteome (Fig. 3c, Table 1, and supplemental Table S3.1–2). Accordingly, the Nap proteins of other denitrifying bacteria are known to be synthesized and active under oxic as well as under anoxic conditions (9). This allows for an immediate transition from oxygen respiration to nitrate reduction when oxygen becomes limited (9). D. shibae DFL12T possesses only the periplasmic nitrate reductase Nap (EC 1.7.99.4) and not the membrane-bound nitrate reductase NarG, which is the main nitrate reductase of many other species (8, 9). It was shown for Nar-negative bacteria, that Nap is involved in the formation of a proton-motive force efficient for energy generation based on the additional proton translocation mediated by the ferrodoxins NapG and NapH (29). The corresponding genes napGH are part of the nap operon of D. shibae DFL12T.
Transcripts of the nir operon, encoding the respiratory nitrite reductase (NirS) and enzymes for cofactor biosynthesis, showed a progressive increase in abundance beginning 20 min after oxygen shutdown and reaching a maximum after 30 min (e.g. nirS >30-fold; Fig. 3b and supplemental Table S4). Accordingly, the nitrite reductase (NirS) displayed a steady increase in abundance beginning 60 min after the shift with a maximum of 46-fold after 240 min (Fig. 3, c and d). Similar transcript and protein profiles were observed for the nor operon, encoding NO reductase (NorB; EC 1.7.2.5), and the nos operon, encoding N2O reductase (NosZ; EC 1.7.2.4). They showed a concomitant abundance increase beginning 20 min after oxygen shutdown and a maximum after 30 min (supplemental Table S4). Correspondingly, NorCBQ and NosZY proteins were detected 30–60 min after the shift (supplemental Table S4). This abundance pattern suggests a fine-tuned regulatory network with (i) nitrite formed by Nap most likely triggering nir gene expression and (ii) the nitrite reduction product NO initiating expression of nor and nos genes as described for P. aeroginosa (30). Furthermore, direct reduction of nitrite prevents its intermediary accumulation, thereby avoiding accumulation of toxic nitrite levels.
Adaptation of the Electron Transfer Chains to Anoxic Conditions
In D. shibae DFL12T, respiratory energy generation employs various primary dehydrogenases for electron abstraction from different substrates (NADH, glucose, gluconate, lactate, glycerol 3-phosphate, and succinate) to shuttle them via ubiquinone to terminal reductases and oxidases. The latter mediate the reduction of oxygen, N-oxides (see above), and dimethyl sulfoxide (8). The generated proton gradient is used for ATP generation.
However, most of the mentioned primary dehydrogenases were not differentially produced under oxygen limitation. Only the transcription of nuoH, nuoI, and nuoK encoding NADH dehydrogenase I (EC 1.6.99.5), Dshi_1390 encoding an alternative NADH dehydrogenase (EC 1.6.5.3 and 1.6.99.3), and sdhAB encoding the succinate dehydrogenase (EC 1.3.99.1) were found slightly enhanced under anoxic conditions (supplemental Tables S1 and S4). The corresponding proteins were detected under oxic as well as anoxic conditions by proteome analyses (Tables S3.1–2 and S4). As expected, most primary dehydrogenases were employed during aerobic as well as anaerobic respiration.
The terminal reductases of cbb3-type cytochrome oxidase type are characterized by their high O2 affinity and are often found to be essential for growth and survival under microoxic conditions (10, 31). D. shibae DFL12T exhibits two gene clusters encoding cbb3-type cytochrome oxidases: the fixNOQPGHIS- (Dshi_0661-0668) and the cytochrome c oxidase operon (Dshi_3891–Dshi_3894). The transcription of the fix operon was significantly induced 10 min after oxygen shutdown, and seven of eight Fix proteins were detected in the membrane protein-enriched fraction (supplemental Table S4). In contrast, transcription of the associated transcriptional regulator FNR (fixK, Dshi_0660) was slightly decreased at those time points where the highest transcription of the other fix genes was observed. The cytochrome c oxidase operon remained unaffected. Obviously, the fix operon encodes the cbb3-type cytochrome for the transition from oxic to anoxic conditions, whereas the cytochrome c oxidase operon encodes the enzyme for oxic conditions. In Pseudomonas aeruginosa, similar observations were made under low oxygen conditions. P. aeruginosa possesses two cbb3 oxidases encoded by the cco1 and cco2 operons. The cco1 genes were constitutively expressed, whereas the transcription of the cco2 genes was induced under low oxygen conditions (32). As expected, transcription of the oxygen-dependent aa3-type cytochrome oxidases encoded by ctaCBGE (Dshi_1140–Dshi_1144) and ctaD (Dshi_2383) was reduced in response to oxygen depletion (supplemental Tables S1 and S4). However, CtaDC proteins were detected in the membrane protein-enriched fraction across the entire time span, with rather constant abundances indicating a long lifetime (supplemental Tables S3.2 and S4).
Finally, the D. shibae DFL12T genome contains two gene clusters encoding F0F1-ATP synthases (Dshi_0435–Dshi_0445 and Dshi_2933–Dshi_2937/Dshi_3027–Dshi_3031). The first operon was not differently transcribed. Interestingly, the expression of the second gene cluster was reduced 60 min after oxygen shutdown but normalized to aerobic levels after 240 min (supplemental Table S4), whereas protein detection remained constant. (The changes of the ATP concentration during the shift from oxic to anoxic conditions are discussed below.) With the onset of denitrification and the formation of its various terminal reductases, the residual terminal reductase portfolio of D. shibae DFL12T becomes systematically adapted. In contrast, no major adjustments at the level of the primary dehydrogenases were observed.
The genome of D. shibae DFL12T contains the arcABC operon for arginine fermentation (8) and for mixed acid fermentation using pyruvate as substrate. Genes encoding enzymes converting pyruvate to acetoin (Dshi_4158), 2,3-butanediol (Dshi_4158), ethanol (AdhA), or acetate (Pta and AckA) are present in the genome of D. shibae DFL12T (8). For both fermentation types, only small increases of transcription at some time points was observed, but the proteins were not found (supplemental Table S4).
Metabolic Crisis I; Transient Adaptation of the TCA Cycle during Decreasing Oxygen Tension
Metabolome analyses detected interesting concentration changes of metabolites from the central metabolism. Apart from oxaloacetate and succinyl-CoA, all intermediates of the TCA cycle were detected. Interestingly, except for 2-oxoglutarate, these metabolites showed an almost identical concentration pattern over time. Their concentration increased between 15 and 30 min after oxygen shutdown and reached a maximum after 60 min. This was followed by a decrease in metabolite concentration, reaching a level similar to oxic conditions after 240 min.
The determination of the ATP concentration showed a fast decline of ATP by 60% after oxygen shutdown. After 2 h, the ATP concentration increased again, but it reached only two-thirds of the original value at the end of the experiment (Fig. 4). A similar observation was found for S. cerevisiae (33). This is in accordance with expectations, with the ATP formation being impaired due to the lack of oxygen. Nitrate can only replace oxygen as electron acceptor after the alternative respiration apparatus has been formed. Because the respiratory chain is inhibited, no NAD+ can be regenerated in this way. Hence, the discussed concentration patterns are a direct response to the highly decreased redox potential present in the cell during adaptation to anoxic conditions.
FIGURE 4.

ATP concentration over time (oxic (0 min) to 360 min of anoxia) of batch cultures (n = 4) shifted from oxic to anoxic conditions. DW, dry weight. Error bars, S.D.
Aconitate and citrate accumulated during the first 30–60 min probably as a consequence of the inhibition of isocitrate dehydrogenase by NADPH due to missing NADP+ regeneration during respiration (34, 35). The subsequent intermediates of the TCA cycle (succinate, fumarate, and malate) also showed the described characteristic concentration pattern (supplemental Table S2). Again, succinate dehydrogenase as part of the electron transport chain suffers from the missing terminal electron acceptor in the transition state between 15 and 30 min. It appears that the TCA cycle during this period lost its function in energy metabolism and is rather used for biosynthesis only.
The transcriptional response mirrored the compensation for the observed metabolic changes. Transcriptional changes were observed for genes encoding aconitate hydratase (acnB, Dshi_2060) and isocitrate dehydrogenase (icd, Dshi_1986), both decreased after 30 min. The genes encoding enzymes mediating the next steps in the TCA cycle, the ATP-generating conversion of succinyl-CoA to succinate, were found significantly up-regulated in the transcriptome after 20–30 min (sucA, Dshi_2883; sucB, Dshi_2884; Dshi_2866; Dshi_2867; sucC, Dshi_2878; sucD, Dshi_2882). One gene encoding succinate dehydrogenase was also slightly up-regulated after 30 min (sdhA, Dshi_2865).
Metabolic Crisis II; Transient Adaptation of Gluconeogenesis and Pentose Phosphate Pathway
Growth on succinate necessitates gluconeogenesis for the formation of C5 bodies, including the sugar moiety of nucleotides. Interestingly, a significant increase of transcription of the phosphoenolpyruvate carboxykinase (pckA, Dshi_0213) catalyzing the conversion of oxaloacetate to phosphoenolpyruvate, the entry step into gluconeogenesis from the TCA cycle, was detected 30 min after oxygen shutdown. In the proteome, only the abundance of glyceraldehyde-3-phosphate dehydrogenase (Gap2, Dshi_1740) started to increase 60 min after oxygen shutdown and increased significantly up to 240 min (Table 1 and supplemental Table S4).
On the metabolic level, a significant increase of phosphoenolpyruvate (4.19-fold change) was detected 60 min after oxygen shutdown. This was also observed for 2- and 3-phosphoglycerate (Fig. 5 and supplemental Table S2).
FIGURE 5.

Central metabolism. Schematic representation of the central metabolism. Expression of genes and concentration of metabolites found induced (red), reduced (blue), not differently expressed (black), or not detected (gray) in D. shibae DFL12T 60 min after oxygen shutdown. For transcriptomics, a -fold change cut-off of 1.7 and a p value of <0.05 and for metabolites, a -fold change cut-off of 1.5 was applied.
Dihydroxyacetone phosphate, which is almost exclusively formed during gluconeogenesis, is significantly decreased with a minimum at 60 min (0.51-fold change) after the oxygen shutdown. Its balanced tautomer glyceraldehyde 3-phosphate was not detected via GC-MS analysis. These observations suggest that formation of glyceraldehyde 3-phosphate/dihydroxyacetone phosphate from 3-phosphoglycerate was impaired due to their dependence on ATP. Beyond glyceraldehyde 3-phosphate/dihydroxyacetone, reactions in the pentose phosphate pathway are needed to produce C5 carbohydrates. However, the transcript for transketolase and the enzyme concentration (TktA, Dshi_1738) decreased up to −3.5-fold and −1.56-fold, 60 min after oxygen shutdown, respectively. The transketolase catalyzes several balanced reactions of the non-oxidative pentose phosphate pathway. The two detected pentose phosphate pathway intermediates xylulose 5-phosphate and ribose (possible decomposition product of ribose 5-phosphate during sample processing or product of the ribokinase-catalyzed conversion) showed a minimum concentration 60 min after oxygen shutdown. Clearly, the flux into and through the pentose phosphate pathway is reduced by the metabolic changes induced by oxygen limitation, which in addition indicates a reduced formation of nucleotides (see below). As a further consequence, the concentrations of glucose 6-phosphate and fructose 6-phosphate increased up to 120 min (4.79- and 4.36-fold change), due to a lack of electron acceptors after oxygen shutdown. The flow through the Entner-Doudoroff pathway should be reduced due to the inhibition of glucose-6-phosphate dehydrogenase by accumulated NADPH (36–38). In agreement, the intermediate 6-phosphogluconate, which decreased in concentration until 60 min after oxygen shutdown, revealed a high increase in concentration after 120 min, before its concentration reverted to amounts similar to what was found for D. shibae DFL12T grown under oxic conditions after 240 min. This indicates that the Entner-Doudoroff pathway only plays a minor role under succinate feeding conditions.
In general, the results show an early metabolic response due to the missing oxygen and a not yet fully compensating denitrification apparatus (Fig. 3). In consequence, the hampered respiration causes a severe disruption of the oxidative phosphorylation, which leads to an impaired energy balance and, as shown by Watanabe et al. (39) and Gonzalez et al. (33), to an accumulation of reduced reduction equivalents in the cell. Therefore, the observed metabolic regulation is caused by metabolic feedback systems, missing substrates and oxidized cofactors. All changes described above begin to revert 60 min after oxygen shutdown, indicating the regeneration of the metabolism. This corresponds to the establishment of the completely functional denitrification apparatus on the proteome level (Fig. 3), enabling the use of nitrate as an alternative electron acceptor (see above). This leads to the oxidation of the earlier accumulated reduction equivalents and consequently to a re-establishment of a functional energy metabolism.
Metabolic Crisis Management I; PHB Production
The transcription of genes involved in PHB synthesis, poly-β-hydroxybutyrate polymerase (Dshi_2233), and the preceding genes Dshi_2231 and Dshi_2232, showing a certain homology to polyhydroxyalkanoate-associated proteins (e.g. in Jannaschia sp. Jann_1118), was induced 30 min after oxygen shutdown, reaching a maximum after 120 min (∼3-fold change) (supplemental Table S4). The corresponding proteins were only found after oxygen shutdown (supplemental Table S4). The transcription of the related polyhydroxyalkanoate synthesis repressor, PhaR (Dshi_2230) and of Dshi_2234, encoding polyhydroxyalkanoate depolymerase, was not significantly affected.
Polyhydroxybutanoate is produced by numerous microorganisms in response to an imbalanced nutrient supply (40, 41) or, as suggested by Trautwein et al. (42), during impaired denitrification. The polymer is usually employed by microorganisms as a form of energy storage molecule. Biosynthesis of PHB starts with the condensation of two molecules of acetyl-CoA to acetoacetyl-CoA, which is subsequently reduced to (R)-3-hydroxybutanoyl-CoA. This latter compound is then polymerized to PHB (43). In agreement with the initial observations, metabolome analyses detected a constant increase of the PHB intermediate 3-hydroxybutanoate over time (supplemental Table S2). Electron micrographs show the growth of PHB granules over time after oxygen shutdown (Fig. 6), and HPLC analysis shows a 10-fold increase of PHB concentration.
FIGURE 6.

PHB granula formation under anoxic nitrate-reducing conditions (indicated as light spots in the cells). Transmission electron microscopy of D. shibae DFL12T shifted from oxic to anoxic conditions. Top, time of sampling in min; bottom left, concentration of PHB/cfu in pg. PHB concentration was measured via HPLC analysis of hydrolyzed cell samples.
Apparently, D. shibae DFL12T uses the formation of PHB under nitrate-reducing conditions for balancing the disturbed central metabolism (see above) and the regeneration of electron acceptors as shown in previous studies (41, 44). Because NADPH is used in the second step of PHB formation for the reduction to (R)-3-hydroxybutanoyl-CoA, NADP+ becomes again available for other oxidation reactions.
Metabolic Crisis Management II; Reduction of Amino Acid and Protein Biosynthesis
Protein biosynthesis from amino acids consumes a large share of the ATP produced by the cell. As observed in the transcriptome data, protein biosynthesis is down-regulated about 20–30 min after oxygen shutdown (supplemental Table S4). Several aminoacyl-tRNA synthetases (among others, LeuS, PheT, and ThrS) were detected only under oxic conditions, or their concentrations were found strongly diminished after oxygen shutdown. Even more extreme was the effect on transcription of genes encoding ribosomal proteins, which decreased already 15 min after oxygen shutdown by a factor of 7.9 after 60 min.
As expected, most amino acids accumulated in the intracellular metabolome after 60 min as a result of the decreased protein biosynthesis during the transition phase (supplemental Table S2). Especially the branched-chain amino acids (Leu, Ile, Val, and related intermediates) were highly increased in abundance, whereas the aromatic amino acids were decreased. As the synthesis of branched-chain amino acids consumes excess NADPH (ketol-acid reductoisomerase), production is increased as an electron sink, and consumption for protein biosynthesis is decreased. Furthermore, serine and glycine were found increased up to 5.03-fold, indicating a channeling of accumulated 3-phosphoglycerate (see above) into glycine and serine metabolism as an alternative to the hindered gluconeogenesis (see above).
60 min after oxygen shutdown, amino acid concentrations started to decrease again, whereas the expression of genes involved in protein biosynthesis and amino acid metabolism increased. Taken together, the results show that protein biosynthesis in D. shibae DFL12T is reduced during the metabolic crisis after oxygen shutdown due to an excess of reduced reducing equivalents, metabolite accumulation, and a disturbed energy balance. However, after the outlined adaptation for the management of the crisis, protein biosynthesis restarts.
Metabolic Crisis Management III; Reduction of Purine and Pyrimidine Metabolism
In general, down-regulation of many genes encoding enzymes involved in purine and pyrimidine metabolism began after 20 min and showed a minimum of transcription 60 min (up to −3-fold changes) after oxygen shutdown (supplemental Table S4). In agreement, for some metabolic intermediates, a decreased abundance was detected in the metabolome. Clearly, reduced nucleotide formation inhibits DNA and RNA formation, being one of the reasons for the reduced growth of D. shibae DFL12T. However, after metabolic crisis management (see above), these transcriptional processes resume their activity.
Metabolic Crisis Management IV; Adaptation of Bacteriochlorophyll Biosynthesis
Interestingly, although the chemostat was protected from light to avoid aerobic anoxygenic photophosphorylation, many genes encoding enzymes for bacteriochlorophyll synthesis were found up-regulated, some of them immediately after interruption of the oxygen supply with -fold changes of up to 17.7. Others started to increase after 30 min with lower -fold changes of up to 2.1 (Fig. 7 and supplemental Table S4). The transcriptional changes were also mirrored in the proteome at 120 min after oxygen shutdown because oxygen-independent coproporphyrinogen III dehydrogenase (HemN1, Dshi_0541; 2D-DIGE) catalyzing the protoporphyrinogen IX formation showed an increased concentration (up to 2.02-fold change).
FIGURE 7.

Schematic view of bacteriochlorophyll biosynthesis in D. shibae DFL12T. Shown is expression of genes found induced (red), reduced (blue), or not differently expressed (black) 60 min after oxygen shutdown. A -fold change cut-off of 1.7 was applied.
One of the steps in the enzyme of the bacteriochlorophyll biosynthesis can be catalyzed by an oxygen-dependent or an oxygen-independent protoporphyrin monomethyl ester cyclase (45). The transcript for the bchE gene (Dshi_2637) encoding the proposed oxygen-independent Mg-protoporphyrin monomethyl ester cyclase increased after 5 min with a maximum 30 min after oxygen shutdown (up to 17.7-fold change). The oxygen-dependent cyclase gene showed no changes in expression.
The increase of bacteriochlorophyll a during starvation in darkness was already observed before (1, 2). As an alternative energy source, the up-regulation of genes involved in anoxygenic photosynthesis is an efficient rescue strategy for the bacteria under oxygen-depleted conditions.
CONCLUSION
The combination of transcriptome, proteome, and metabolome analysis allowed a detailed time-resolved characterization of the cellular processes of D. shibae DFL12T during the adaptation to oxygen depletion. A fast response in transcription and metabolism 15–30 min after oxygen shutdown is followed by significant changes in the cellular protein inventory after 120–240 min. Overall, oxygen depletion led to a metabolic crisis, where central metabolic processes were blocked due to the missing regeneration of NAD+/NADP+ and lower ATP supply. The transient accumulation of metabolites and a resulting gene regulatory response were observed. Energy-consuming processes, including cell division with corresponding nucleotide and protein biosynthesis, were significantly down-regulated. Interestingly, PHB biosynthesis was induced, most likely for the recovery of accumulated metabolites and the reduction of the pool size of NAD(P)H. After 60 min, the metabolic crisis caused by the oxygen deficiency of D. shibae DFL12T to anoxic conditions was resolved to a large degree, reflected by a changed enzyme repertoire and a relaxed metabolome and transcriptome.
Supplementary Material
Acknowledgment
We gratefully acknowledge the assistance of Marcus Ulbrich with enzyme function prediction.
This work was supported by Deutsche Forschungsgemeinschaft Transregio SFB TRR 51.

This article contains supplemental Tables S1–S4.
- 2D-DIGE
- two-dimensional difference gel electrophoresis
- PHB
- poly-3-hydroxybutanoate
- ESI
- electrospray ionization
- TCA
- tricarboxylic acid.
REFERENCES
- 1. Biebl H., Allgaier M., Tindall B. J., Koblizek M., Lünsdorf H., Pukall R., Wagner-Döbler I. (2005) Dinoroseobacter shibae gen. nov., sp. nov., a new aerobic phototrophic bacterium isolated from dinoflagellates. Int. J. Syst. Evol. Microbiol. 55, 1089–1096 [DOI] [PubMed] [Google Scholar]
- 2. Wagner-Döbler I., Biebl H. (2006) Environmental biology of the marine Roseobacter lineage. Annu. Rev. Microbiol. 60, 255–280 [DOI] [PubMed] [Google Scholar]
- 3. Brinkhoff T., Giebel H.-A., Simon M. (2008) Diversity, ecology, and genomics of the Roseobacter clade: a short overview. Arch. Microbiol. 189, 531–539 [DOI] [PubMed] [Google Scholar]
- 4. Azam F., Fenchel T., Field J., Gray J., Meyer-Reil L., Thingstad F. (1983) The ecological role of water-column microbes in the sea. Mar. Ecol. Prog. Ser. 10, 257–263 [Google Scholar]
- 5. Rex R., Bill N., Schmidt-Hohagen K., Schomburg D. (2013) Swimming in light: a large-scale computational analysis of the metabolism of Dinoroseobacter shibae. PLoS Comput. Biol. 9, e1003224. [DOI] [PMC free article] [PubMed] [Google Scholar]
- 6. Fürch T., Preusse M., Tomasch J., Zech H., Wagner-Döbler I., Rabus R., Wittmann C. (2009) Metabolic fluxes in the central carbon metabolism of Dinoroseobacter shibae and Phaeobacter gallaeciensis, two members of the marine Roseobacter clade. BMC Microbiol. 9, 209. [DOI] [PMC free article] [PubMed] [Google Scholar]
- 7. Piekarski T., Buchholz I., Drepper T., Schobert M., Wagner-Doebler I., Tielen P., Jahn D. (2009) Genetic tools for the investigation of Roseobacter clade bacteria. BMC Microbiol. 9, 265. [DOI] [PMC free article] [PubMed] [Google Scholar]
- 8. Wagner-Döbler I., Ballhausen B., Berger M., Brinkhoff T., Buchholz I., Bunk B., Cypionka H., Daniel R., Drepper T., Gerdts G., Hahnke S., Han C., Jahn D., Kalhoefer D., Kiss H., Klenk H.-P., Kyrpides N., Liebl W., Liesegang H., Meincke L., Pati A., Petersen J., Piekarski T., Pommerenke C., Pradella S., Pukall R., Rabus R., Stackebrandt E., Thole S., Thompson L., Tielen P., Tomasch J., von Jan M., Wanphrut N., Wichels A., Zech H., Simon M. (2010) The complete genome sequence of the algal symbiont Dinoroseobacter shibae: a hitchhiker's guide to life in the sea. ISME J. 4, 61–77 [DOI] [PubMed] [Google Scholar]
- 9. Zumft W. G. (1997) Cell biology and molecular basis of denitrification. Microbiol. Mol. Biol. Rev. 61, 533–616 [DOI] [PMC free article] [PubMed] [Google Scholar]
- 10. Schobert M., Tielen P. (2010) Contribution of oxygen-limiting conditions to persistent infection of Pseudomonas aeruginosa. Future Microbiol. 5, 603–621 [DOI] [PubMed] [Google Scholar]
- 11. Ebert M., Laass S., Burghartz M., Petersen J., Kossmehl S., Wöhlbrand L., Rabus R., Wittmann C., Tielen P., Jahn D. (2013) Transposon mutagenesis identified chromosomal and plasmid genes essential for adaptation of the marine bacterium Dinoroseobacter shibae to anaerobic conditions. J. Bacteriol. 195, 4769–4777 [DOI] [PMC free article] [PubMed] [Google Scholar]
- 12. Buddruhs N., Pradella S., Göker M., Päuker O., Pukall R., Spröer C., Schumann P., Petersen J., Brinkhoff T. (2013) Molecular and phenotypic analyses reveal the non-identity of the Phaeobacter gallaeciensis type strain deposits CIP 105210T and DSM 17395. Int. J. Syst. Evol. Microbiol. 63, 4340–4349 [DOI] [PubMed] [Google Scholar]
- 13. Zech H., Hensler M., Kossmehl S., Drüppel K., Wöhlbrand L., Trautwein K., Hulsch R., Maschmann U., Colby T., Schmidt J., Reinhardt R., Schmidt-Hohagen K., Schomburg D., Rabus R. (2013) Adaptation of Phaeobacter gallaeciensis DSM 17395 to growth with complex nutrients. Proteomics 13, 2851–2868 [DOI] [PubMed] [Google Scholar]
- 14. Zech H., Hensler M., Kossmehl S., Drüppel K., Wöhlbrand L., Trautwein K., Colby T., Schmidt J., Reinhardt R., Schmidt-Hohagen K., Schomburg D., Rabus R. (2013) Dynamics of amino acid utilization in Phaeobacter inhibens DSM 17395. Proteomics 13, 2869–2885 [DOI] [PubMed] [Google Scholar]
- 15. Drüppel K., Hensler M., Trautwein K., Kossmehl S., Wöhlbrand L., Schmidt-Hohagen K., Ulbrich M., Bergen N., Meyer-Kolthoff J., Göker M., Klenk H.-P., Schomburg D., Rabus R. (2014) Pathways and substrate-specific regulation of amino acid degradation in Phaeobacter inhibens DSM 17395 (archetype of the marine Roseobacter clade). Environ. Microbiol. 16, 218–238 [DOI] [PubMed] [Google Scholar]
- 16. Tomasch J., Gohl R., Bunk B., Diez M. S., Wagner-Döbler I. (2011) Transcriptional response of the photoheterotrophic marine bacterium Dinoroseobacter shibae to changing light regimes. ISME J. 5, 1957–1968 [DOI] [PMC free article] [PubMed] [Google Scholar]
- 17. Edgar R., Domrachev M., Lash A. E. (2002) Gene expression omnibus: NCBI gene expression and hybridization array data repository. Nucleic Acids Res. 30, 207–210 [DOI] [PMC free article] [PubMed] [Google Scholar]
- 18. Bradford M. M. (1976) A rapid and sensitive method for the quantitation of microgram quantities of protein utilizing the principle of protein-dye binding. Anal. Biochem. 72, 248–254 [DOI] [PubMed] [Google Scholar]
- 19. Gade D., Thiermann J., Markowsky D., Rabus R. (2003) Evaluation of two-dimensional difference gel electrophoresis for protein profiling. J. Mol. Microbiol. Biotechnol. 5, 240–251 [DOI] [PubMed] [Google Scholar]
- 20. Zech H., Echtermeyer C., Wöhlbrand L., Blasius B., Rabus R. (2011) Biological versus technical variability in 2-D DIGE experiments with environmental bacteria. Proteomics 11, 3380–3389 [DOI] [PubMed] [Google Scholar]
- 21. Don C. D., Hanselmann K. W., Peduzzi R., Bachofen R. (1994) Biomass composition and methods for the determination of metabolic reserve polymers in phototrophic sulfur bacteria. Aquat. Sci. 56, 1–15 [Google Scholar]
- 22. Börner J., Buchinger S., Schomburg D. (2007) A high-throughput method for microbial metabolome analysis using gas chromatography/mass spectrometry. Anal. Biochem. 367, 143–151 [DOI] [PubMed] [Google Scholar]
- 23. Zech H., Thole S., Schreiber K., Kalhöfer D., Voget S., Brinkhoff T., Simon M., Schomburg D., Rabus R. (2009) Growth phase-dependent global protein and metabolite profiles of Phaeobacter gallaeciensis strain DSM 17395, a member of the marine Roseobacter-clade. Proteomics 9, 3677–3697 [DOI] [PubMed] [Google Scholar]
- 24. Hiller K., Hangebrauk J., Jäger C., Spura J., Schreiber K., Schomburg D. (2009) MetaboliteDetector: comprehensive analysis tool for targeted and nontargeted GC/MS based metabolome analysis. Anal. Chem. 81, 3429–3439 [DOI] [PubMed] [Google Scholar]
- 25. Spurr A. R. (1969) A low-viscosity epoxy resin embedding medium for electron microscopy. J. Ultrastruct. Res. 26, 31–43 [DOI] [PubMed] [Google Scholar]
- 26. Taniguchi Y., Choi P. J., Li G.-W., Chen H., Babu M., Hearn J., Emili A., Xie X. S. (2010) Quantifying E. coli proteome and transcriptome with single-molecule sensitivity in single cells. Science 329, 533–538 [DOI] [PMC free article] [PubMed] [Google Scholar]
- 27. Gray C. T., Wimpenny J. W., Hughes D. E., Mossman M. R. (1966) Regulation of metabolism in facultative bacteria: 1. structural and functional changes in Escherichia coli associated with shifts between the aerobic and anaerobic states. Biochim. Biophys. Acta 117, 22–32 [DOI] [PubMed] [Google Scholar]
- 28. Nam T.-W., Park Y.-H., Jeong H.-J., Ryu S., Seok Y.-J. (2005) Glucose repression of the Escherichia coli sdhCDAB operon, revisited: regulation by the CRP·cAMP complex. Nucleic Acids Res. 33, 6712–6722 [DOI] [PMC free article] [PubMed] [Google Scholar]
- 29. González P. J., Correia C., Moura I., Brondino C. D., Moura J. J. (2006) Bacterial nitrate reductases: molecular and biological aspects of nitrate reduction. J. Inorg. Biochem. 100, 1015–1023 [DOI] [PubMed] [Google Scholar]
- 30. Tielen P., Rosin N., Meyer A.-K., Dohnt K., Haddad I., Jänsch L., Klein J., Narten M., Pommerenke C., Scheer M., Schobert M., Schomburg D., Thielen B., Jahn D. (2013) Regulatory and metabolic networks for the adaptation of Pseudomonas aeruginosa biofilms to urinary tract-like conditions. PLoS One 8, e71845. [DOI] [PMC free article] [PubMed] [Google Scholar]
- 31. Williams H. D., Zlosnik J. E., Ryall B. (2007) Oxygen, cyanide and energy generation in the cystic fibrosis pathogen Pseudomonas aeruginosa. Adv. Microb. Physiol. 52, 1–71 [DOI] [PubMed] [Google Scholar]
- 32. Arai H. (2011) Regulation and function of versatile aerobic and anaerobic respiratory metabolism in Pseudomonas aeruginosa. Front. Microbiol. 2, 103. [DOI] [PMC free article] [PubMed] [Google Scholar]
- 33. Gonzalez B., de Graaf A., Renaud M., Sahm H. (2000) Dynamic in vivo 31P nuclear magnetic resonance study of Saccharomyces cerevisiae in glucose-limited chemostat culture during the aerobic-anaerobic shift. Yeast 16, 483–497 [DOI] [PubMed] [Google Scholar]
- 34. Lebedeva N. V., Malinina N. V., Ivanovskiı̆ R. N. (2002) [A comparative study of the isocitrate dehydrogenases of Chlorobium limicola forma thiosulfatophilum and Rhodopseudomonas palustris]. Microbiology 71, 762–767 [PubMed] [Google Scholar]
- 35. Pardo M. A., Llama M. J., Serra J. L. (1999) Purification, properties and enhanced expression under nitrogen starvation of the NADP+-isocitrate dehydrogenase from the cyanobacterium Phormidium laminosum. Biochim. Biophys. Acta 1431, 87–96 [DOI] [PubMed] [Google Scholar]
- 36. Hansen T., Schlichting B., Schönheit P. (2002) Glucose-6-phosphate dehydrogenase from the hyperthermophilic bacterium Thermotoga maritima: expression of the g6pd gene and characterization of an extremely thermophilic enzyme. FEMS Microbiol. Lett. 216, 249–253 [DOI] [PubMed] [Google Scholar]
- 37. Lessmann D., Schimz K. L., Kurz G. (1975) d-Glucose-6-phosphate dehydrogenase (Entner-Doudoroff enzyme) from Pseudomonas fluorescens: purification, properties and regulation. Eur. J. Biochem. 59, 545–559 [DOI] [PubMed] [Google Scholar]
- 38. Schaeffer F., Stanier R. Y. (1978) Glucose-6-phosphate dehydrogenase of Anabaena sp. kinetic and molecular properties. Arch. Microbiol. 116, 9–19 [DOI] [PubMed] [Google Scholar]
- 39. Watanabe S., Zimmermann M., Goodwin M. B., Sauer U., Barry C. E., 3rd, Boshoff H. I. (2011) Fumarate reductase activity maintains an energized membrane in anaerobic Mycobacterium tuberculosis. PLoS Pathog. 7, e1002287. [DOI] [PMC free article] [PubMed] [Google Scholar]
- 40. Madison L. L., Huisman G. W. (1999) Metabolic engineering of poly(3-hydroxyalkanoates): from DNA to plastic. Microbiol. Mol. Biol. Rev. 63, 21–53 [DOI] [PMC free article] [PubMed] [Google Scholar]
- 41. Xiao N., Jiao N. (2011) Formation of polyhydroxyalkanoate in aerobic anoxygenic phototrophic bacteria and its relationship to carbon source and light availability. Appl. Environ. Microbiol. 77, 7445–7450 [DOI] [PMC free article] [PubMed] [Google Scholar]
- 42. Trautwein K., Kühner S., Wöhlbrand L., Halder T., Kuchta K., Steinbüchel A., Rabus R. (2008) Solvent stress response of the denitrifying bacterium “Aromatoleum aromaticum” strain EbN1. Appl. Environ. Microbiol. 74, 2267–2274 [DOI] [PMC free article] [PubMed] [Google Scholar]
- 43. Reusch R. N. (2013) The role of short-chain conjugated poly-(R)-3-hydroxbutyrate (cPHB) in protein folding. Int. J. Mol. Sci. 14, 10727–10748 [DOI] [PMC free article] [PubMed] [Google Scholar]
- 44. Senior P. J., Dawes E. A. (1971) Poly-β-hydroxybutyrate biosynthesis and the regulation of glucose metabolism in Azotobacter beijerinckii. Biochem. J. 125, 55–66 [DOI] [PMC free article] [PubMed] [Google Scholar]
- 45. Ouchane S., Steunou A.-S., Picaud M., Astier C. (2004) Aerobic and anaerobic Mg-protoporphyrin monomethyl ester cyclases in purple bacteria: a strategy adopted to bypass the repressive oxygen control system. J. Biol. Chem. 279, 6385–6394 [DOI] [PubMed] [Google Scholar]
- 46. Saeed A. I., Sharov V., White J., Li J., Liang W., Bhagabati N., Braisted J., Klapa M., Currier T., Thiagarajan M., Sturn A., Snuffin M., Rezantsev A., Popov D., Ryltsov A., Kostukovich E., Borisovsky I., Liu Z., Vinsavich A., Trush V., Quackenbush J. (2003) TM4: a free, open-source system for microarray data management and analysis. BioTechniques 34, 374–378 [DOI] [PubMed] [Google Scholar]
Associated Data
This section collects any data citations, data availability statements, or supplementary materials included in this article.