Abstract
This paper describes the development and characterization of a fully automated in vitro cell irradiator using an electronic brachytherapy source to perform radiation sensitivity bioassays. This novel irradiator allows complex variable dose and dose rate schemes to be delivered to multiple wells of 96-well culture plates used in standard biological assays. The Xoft Axxent® eBx™ was chosen as the x-ray source due to its ability to vary tube current up to 300 μA for a 50 kVp spectrum using clinical surface applicators. Translation of the multiwell plate across the fixed radiation field is achieved using a precision motor driven computer controlled positioning system. A series of measurements were performed to characterize dosimetric performance of the system. Measurements have shown that the radiation output measured with an end window ionization chamber is stable between operating currents of 50 μA to 300 μA. In addition, radiochromic film was used to characterize the field flatness and symmetry. The average field flatness in the in-plane and cross-plane direction was 2.9 ±1.0% and 4.0 ±1.7%, respectively. The average symmetry in the in-plane and cross-plane direction was 1.8 ±0.9% and 1.6 ±0.5%, respectively. The optimal focal spot resolution at the cellular plane was determined by measuring sequential irradiations on radiochromic film for three different well spacing schemes. It was determined that the current system can irradiate every-other well with negligible impact on the radiation field characteristics. Finally, a performance comparison between this system and a common cabinet irradiator is presented.
Keywords: Radiobiology, Irradiator, Bioassay, Radiosensitivity, Radiotherapy
1. Introduction
There is substantial evidence suggesting that large variations exist in the radiosensitivity of normal tissue between individual patients (Bentzen and Overgaard, 1994, Borger et al., 1994, Burnet et al., 1998, Raaphorst et al., 2002, Russell and Begg, 2002). The development of an assay that can help identify which cancer patients are likely to develop acute and late toxicities following radiation therapy will enable physicians to personalize therapy to maximize the therapeutic index (Ho et al., 2006, Tucker et al., 1996, Mackay and Hendry, 1999).
Gene expression assays have been recently developed to improve upon the sensitivity, specificity and reproducibility of individual radiosensitivity investigations (Kruse and Stewart, 2007, West et al., 2007). Gene expression microarrays provide the ability to rapidly and simultaneously monitor the RNA expression levels from thousands of genes to the entire genome (West et al., 2007). Gene expression arrays have been used as a predictive tool for acute and late toxicities in patients with head-and-neck cancer (Mayer et al., 2011, Sonis et al., 2007), breast cancer (Badie et al., 2008, Mayer et al., 2011, Rieger et al., 2004), Hodgkin’s disease (Rieger et al., 2004), cancer of the tongue (Rieger et al., 2004), prostate cancer (Svensson et al., 2006), and other sites (Rieger et al., 2004).
Despite demonstrated success of using gene expression profiling to determine patient-specific radiation sensitivity, integration of this technology into routine clinical practice has been difficult. The largest hurdle to overcome has to do with the logistical challenge of accommodating a large volume of patients treated in radiation oncology clinics. The development of rapid, high-throughput DNA sequencing tools has put patient-specific gene expression profiling for radiation sensitivity within reach (Boyd, 2013, Hsiao and Kuo, 2006). However, a major bottleneck to the efficiency of the genetic profiling process is the incompatibility of conventional x-ray irradiators (i.e. radioisotope or cabinet x-ray irradiators) with current high-throughput biological assaying techniques. Conventional x-ray irradiators are designed to provide maximum versatility to radiobiology researchers, typically accommodating small animals, tissue samples, and cellular applications. However, this added versatility often impedes the overall sensitivity and specificity of an experiment. As a result, there is a trade-off between the number of absorbed doses and endpoints that can be investigated in vitro and the synchronization of these irradiated cells with current high-throughput sequencing technologies. The loss of dosimetric resolution in dose-response experiments is detrimental because new radiation therapy technology and treatment methods generate non-uniform dose distributions that vary widely from patient to patient. Furthermore, important dosimetry and calibration characteristics (i.e. dose build-up region, beam attenuation, and beam scatter) of these irradiators are typically unknown to the end user. This gap in irradiator specificity and user knowledge can result in significant deviation between delivered dose and intended dose that ultimately adversely impacts experimental results.
Therefore, it is the aim of this research to design and develop a fully automated high-throughput micro-irradiator to aid in radiation sensitivity investigations. In designing this irradiator the following critical design goals were identified: 1) high-throughput, 2) variable dose/dose-rate, 3) high radiation field uniformity, 4) full automation, 5) National Institute of Standards and Technology (NIST) traceable dosimetry. This paper describes our initial dosimetric characterization of the irradiator.
2. Methods and materials
2.1 Irradiator design and construction
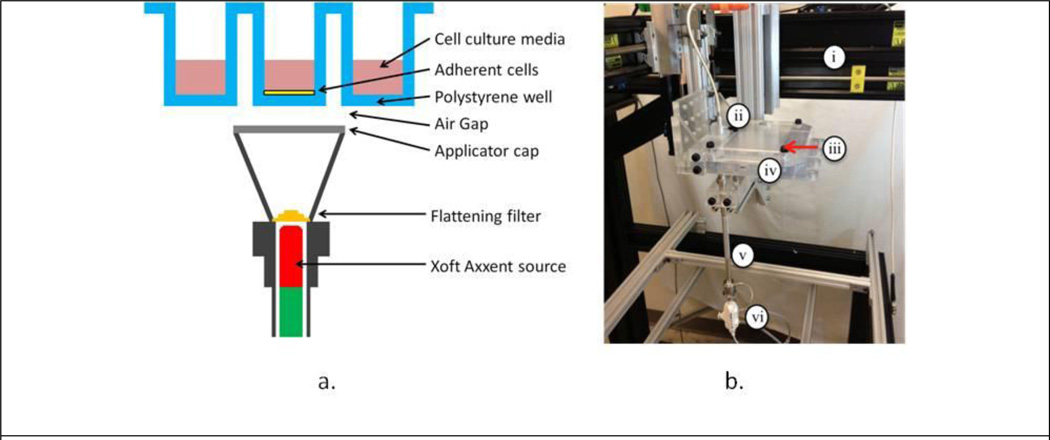
To take advantage of emerging high-throughput robotic bioassay equipment, a system was developed that would accommodate assays performed in a 96-well microtiter plate. The 96-well cell culture plates feature 96 wells with an area of 0.32 cm2 and an average yield of 3.2×10⁴ cells that are ideal for bioassay experiments where large amounts of data are to be collected or multiple variables manipulated. A mock-up of the proposed design is illustrated in Figure 1a. In this system, a fixed miniature x-ray source with adequate collimation irradiates single-wells of a microtiter plate. It was decided that the Xoft Axxent eBx® electronic brachytherapy system (iCAD, Inc, Nashua, NH) with clinical surface applicators best matched our source criteria because it features a 50 kVp spectrum, as provided in Rivard et al. (Rivard et al., 2006), that is easily collimated and reduces well-to-well scatter. Using the Manufacturing Test Fixture (MTF) controller, the x ray tube current can be adjusted up to 300 μA allowing dose-rate modulation without effecting beam spectrum. The surface applicators developed for this system feature a beam profile flattening filter for each of four size applicators: 10, 20, 35, and 50 mm. A 10 mm applicator was used for all of the irradiations presented in this work.
Figure 1.
A) 96-well microtiter irradiation geometry. B) High-throughput micro-irradiator prototype unit consisting of: i) robotic test fixture, ii) ionization chamber, iii) machined acrylic translation stage lid, iv) 3D printed translation stage base, v) surface applicator, and vi) Xoft Axxent source.
To achieve precise automation, the 96-well cell culture plate is translated via a 3-axis, motor-driven translation stage above the fixed x-ray source. The source is fixed to minimize disruption of the coolant and high-voltage supply lines. The translation stage is positioned 0.2 mm above the surface applicator to ensure smooth translation of the stage without collisions with the source and provides a framework to support the microtiter plate without interfering with the x-ray beam. Given the complexity of the translation stage, it was originally designed using the CAD software SolidWorks® (Dassault Systemes SolidWorks Corp., Waltham, MA) and then fabricated using a 3D acrylic printer. The translation stage is operated using precision Velmex™ motors (Bloomfield, NY) located on each independent axis. The motors are controlled by LabVIEW (National Instruments Corp., Austin, TX), a program which permits automated control of the stage position and irradiation dwell time. The irradiator translation stage also includes an Exradin A20 (Standard Imaging, Madison, WI) end-window ionization chamber to provide periodic NIST traceable air-kerma rate verification. A digital video camera is mounted underneath the translation stage to allow real-time visual tracking of the irradiation process.
2.2 System performance characteristics
All US Food and Drug Administration (FDA) approved medical electrical equipment must comply with operation requirements and safety standards recommended by the International Electrotechnical Commission (IEC). Currently, there are no IEC recommendations for the operation of in vitro irradiators. Following recommendations for other devices that utilize x-ray tubes (e.g. radiography and mammography equipment), three important performance characteristics of the system including radiation output linearity, radiation field flatness and symmetry, and focal spot resolution at the cellular plane were investigated.
2.2.1. Radiation output linearity
For the purpose of this work, the radiation output is defined by the ratio of the measured absorbed dose rate in water at the cellular plane and the operating tube current. All dose rate measurements were performed on the source using an Exradin A20 end window ionization chamber that was specifically designed for Xoft Axxent surface applicator dosimetry, and a Standard Imaging SuperMax electrometer (Standard Imaging, Madison, WI). An air-kerma calibration was performed on the A20 chamber in the University of Wisconsin Accredited Dosimetry Laboratory (UW-ADCL) using the UW60-M standard calibration x-ray beam quality.
Using the protocol and dose formalism derived by Fulkerson (Fulkerson and DeWerd, 2013) the absorbed dose rate to water at the surface of the skin applicator was calculated as,
| (1) |
where Ḋwater,0 is the dose rate to water at depth [Gy/s] and Ṁ is the current collected by the ionization chamber [C/s]. Nk is the ionization chamber air-kerma calibration coefficient for the UW60-M beam quality [Gy/C] determined to be 3.821×10⁸ Gy/C. Pelec is the electrometer calibration coefficient, PTP is the temperature-pressure correction factor, and PPOM is the effective point of measurement correction factor calculated as,
| (2) |
where SSD is the applicator-specific source to surface distance and d is the distance from the entrance window of the chamber to the center of the chamber collecting volume. Pcham is an ionization chamber scatter correction factor. Table 1 provides a list of the correction factors that were used in this work.
Table 1.
Correction factors used in Eq. 2 as derived by Fulkerson et al. (Fulkerson and DeWerd, 2013).
| P-value | |
|---|---|
| Pelec | 0.999 |
| PTP | 1.013 |
| Pcham | 0.960 |
| *PPOM | 1.181 |
| PDw | 1.073 |
Note SSD = 20.7 mm and d = 1.8 mm for our measurements.
2.2.2. Radiation field flatness and symmetry
Radiation field flatness and symmetry at the cellular plane was examined using GafChromic EBT-3 film (International Specialty Products, Wayne, NJ). The bottom of a polystyrene 96-well cell culture plate was removed using a vertical mill, and a thin film of polyvinylidene chloride (PVDC) plastic was adhered to the bottom of the plate to form a watertight seal, with negligible radiation attenuation, in order to position the film at the cellular plane. The EBT-3 film was inserted between the PVDC and a 1.3 mm layer of polystyrene plastic to simulate the bottom of the wells previously removed. The wells were filled with 200 μL of water to provide proper x-ray backscatter of cell culture media, the static 10 mm skin applicator was positioned below the well, and a 2 Gy dose was delivered using a 50 kVp beam operating at 300 μA. Hereafter all doses referred to in this work are calculated in water at the surface of the surface applicator as outlined in the dose formalism derived by Fulkerson (Fulkerson and DeWerd, 2013) unless specifically noted. The measured relative dose was normalized to the maximum dose delivered within the region of the beam incident on the targeted cell culture well. Three separate profile measurements were taken using the 96-well microtiter phantom to determine the statistical variation of these values. For each profile, both in-plane (i.e. x-axis) and cross-plane (i.e. y-axis) flatness and symmetry were calculated.
The flatness and symmetry of the beam was calculated only for the region of the beam incident on the targeted cell culture well (Kouloulias et al., 2003, Nath et al., 1994). The flatness is given by,
| (3) |
Dmax and Dmin are the maximum and minimum dose values within region of the beam incident on the targeted cell culture well. The symmetry is also defined in the region of the beam incident on the targeted cell culture well and is given by the average ratio of doses at symmetric points from the central beam axis. The symmetry is given by,
| (4) |
2.2.3 Focal spot resolution and accuracy
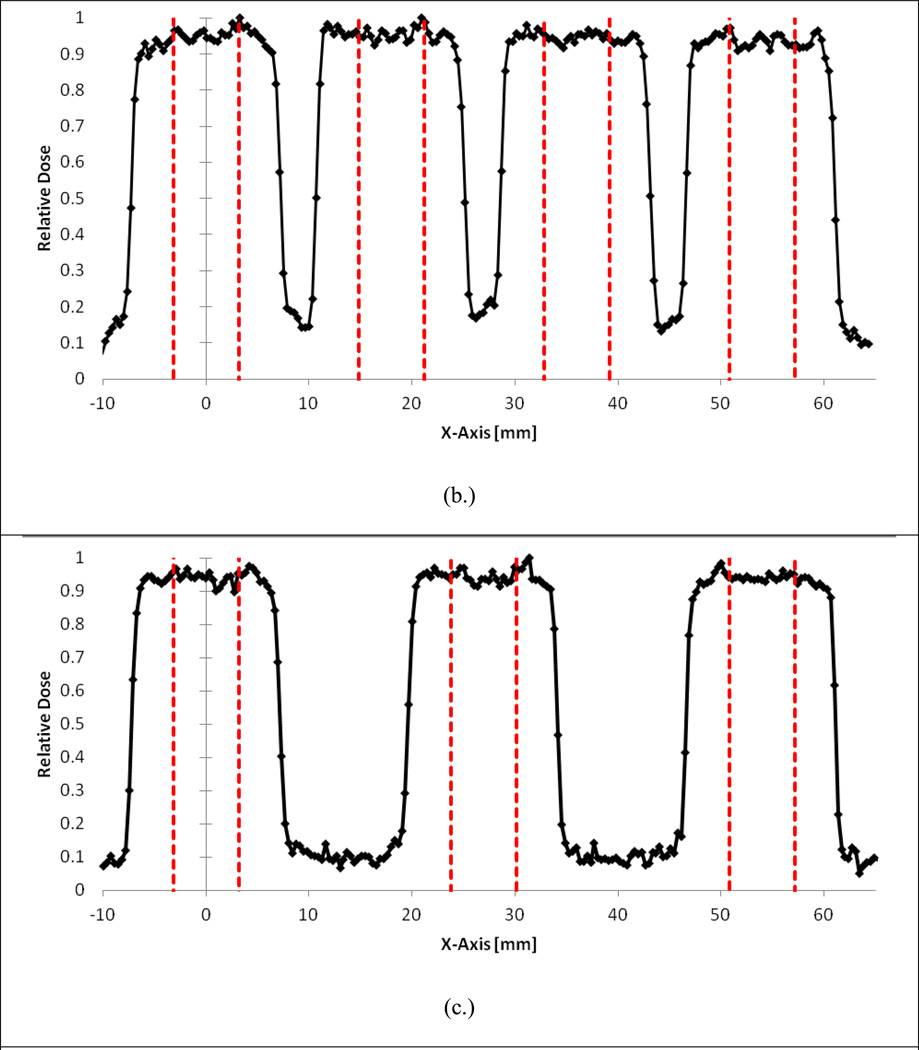
In order to investigate the focal spot resolution at the cellular plane, a set of sequential irradiations was performed. Using the same modified microtiter plate as described in Section 2.2.1, EBT-3 film was irradiated with three different focal spot arrangements: every well, every-other well, and every-two wells. A total of 2 Gy was delivered to each spot. Following the formalisms provided in Eq. (3) and (4), the flatness and symmetry of the first three profiles in the series were determined for each focal spot arrangement.
In addition, the full-width at half-max (FWHM) was calculated by linear interpolation of the 50% relative dose points in the profile penumbra region to determine the center of the dose profile. Peak-to-peak translation distances were calculated from these values to assess the accuracy of the precision positioning system.
2.3 Cabinet irradiator comparison
Using the aforementioned 96-well microtiter phantom with wells filled uniformly with 200 μL of water, the UW Wisconsin Institutes for Medical Research X-RAD 320 cabinet irradiator (Precision X-Ray, North Branford, CT) was setup to deliver a 4 Gy dose using a tube potential of 320 kVp and a tube current of 12.50 mA. The source-to-surface distance was set to 73 cm and the film was irradiated for 182 seconds. The plate was placed at the center of the field during irradiation. The film was digitized after 24 hours (Casanova Borca et al., 2013, Andres et al., 2010, Devic et al., 2010) using a Epson Expression 10000 XL flatbed scanner (Epson America, Long Beach, CA) and analyzed using ImageJ (National Institutes of Health, Bethesda, MD) and MATLAB (MathWorks, Natick, MA) using procedures from McCaw et al. (McCaw et al., 2011). Relative dose was determined by background subtraction of unexposed film and scaled to the maximum dose delivered.
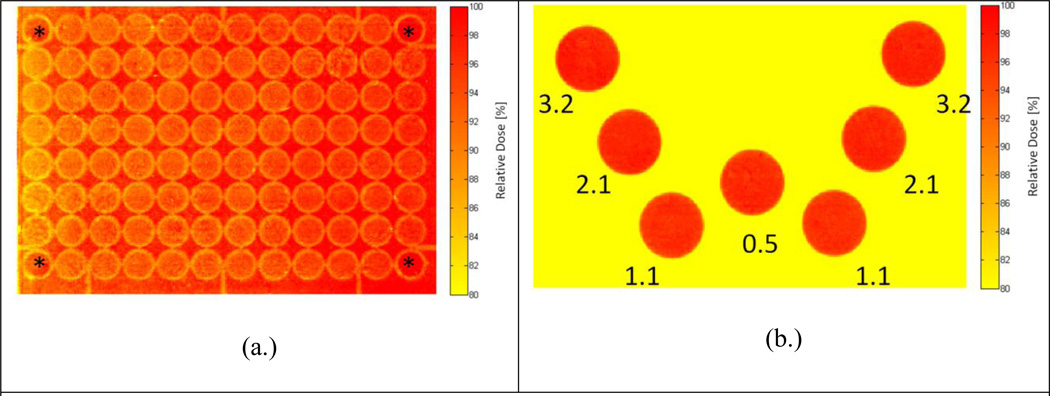
For comparison, the same phantom with film was irradiated with our high-throughput irradiator. To demonstrate the versatility of the system, designated wells in a 96-well microtiter plate were irradiated to create a W-pattern. Two wells received a dose rate of 3.2 cGy/sec, two wells received a dose rate of 2.1 cGy/sec, two wells received a dose rate of 1.1 cGy/sec, and one well received a dose rate of 0.5 cGy/sec. A total of 2 Gy was delivered to each well. The film was once again digitized after 24-hours and analyzed using ImageJ to determine relative dose with background subtraction.
3. Results
3.1. System Performance
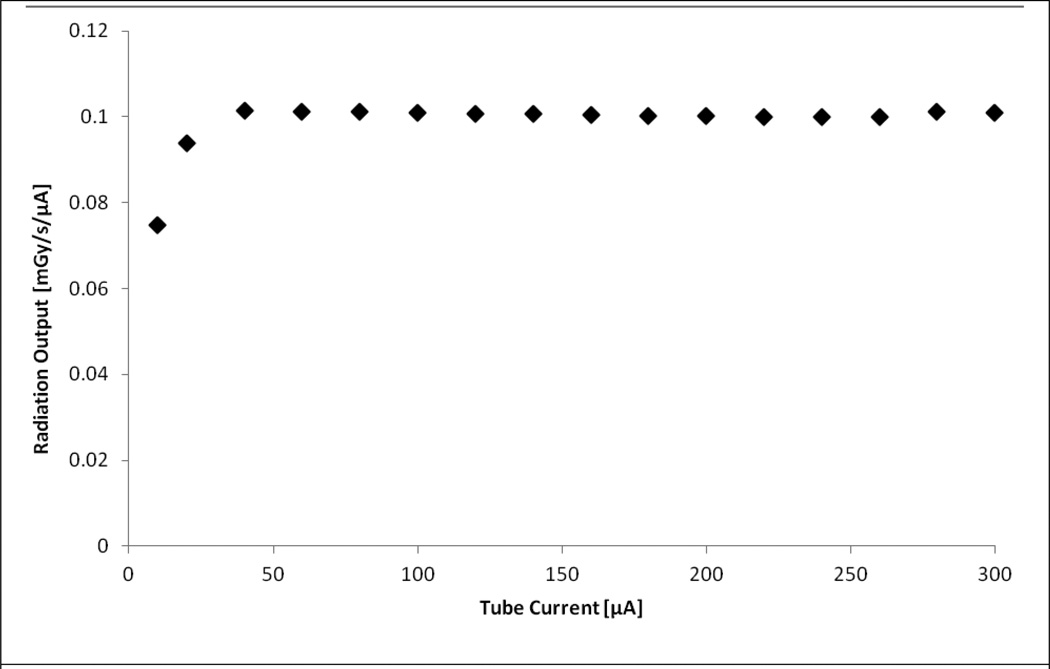
Figure 2 plots the radiation output as a function of tube current. All dose rates were derived using the formalism provided in Eq. 1. As shown in the figure, the system can operate with a stable radiation output between operating tube currents of 50–300 μA. Note that this suggests excellent dose rate linearity within this tube current range. At lower operating tube currents there is an approximate 26% reduction in output between the 40 μA and 10 μA operating currents.
Figure 2.
Radiation output as a function of beam current showing dose-rate linearity. Note: Error bars are small enough to be obscured by the data points.
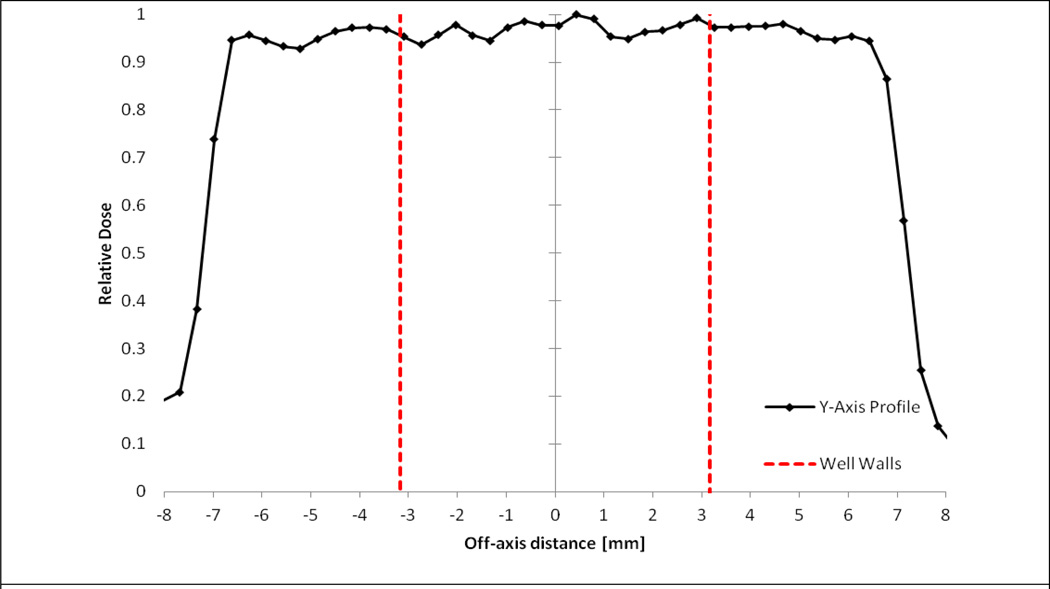
Figure 3 provides one of three profile measurements taken to investigate the systems' dose flatness and symmetry characteristics. Using Eq. 3 and 4, both in-plane and cross-plane flatness and symmetry were calculated for all three measured profiles as shown in Table 2. It was determined that the flatness and symmetry is slightly better in the in-plane direction than the cross-plane direction. The average flatness in the in-plane direction was 3.0% across all three profiles, whereas in the cross-plane direction, it was 3.8%. The average symmetry in the in-plane direction was 1.8%, whereas in the cross-plane it was 2.7%.
Figure 3.
Relative cross-plane dose profile highlighting the region of the beam incident on cell culture well.
Table 2.
Flatness and symmetry of incident beam over the region of the target well.
| Flatness (%) | Symmetry (%) | |||
|---|---|---|---|---|
| In-plane (x-axis) |
Cross-plane (y-axis) |
In-plane (x-axis) |
Cross-plane (y-axis) |
|
| Profile 1 | 3.8 | 6.0 | 2.3 | 2.1 |
| Profile 2 | 3.2 | 2.8 | 2.2 | 1.6 |
| Profile 3 | 1.8 | 3.2 | 0.8 | 1.2 |
| Ave. | 2.9 | 4.0 | 1.8 | 1.6 |
| Std. Dev. | 1.0 | 1.7 | 0.9 | 0.5 |
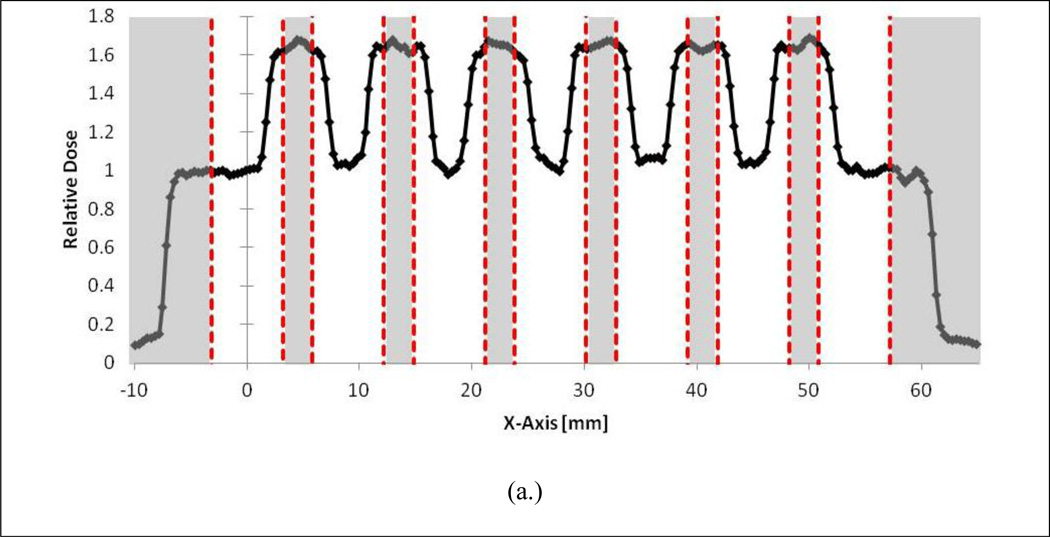
The results of the serial focal spot resolution irradiations are provided in Figure 4a–c. As shown in Fig. 4a, irradiating every well is not possible with the current system. However, as demonstrated in Fig. 4b, it is possible to irradiate every-other well with negligible impact on the radiation field characteristics. This is supported by the in-plane flatness and symmetry values for each of the first three peaks of the serial irradiations provided in Table 3 where good agreement is shown between the flatness and symmetry values of the every-other well and every-two well irradiations. In addition, Table 4 shows that the position delivery system can deliver the focal spot to every-other well with extremely high precision. On average, the system translated the stage 17.95 mm between targeted wells, which represents a average relative percent error of 0.3% from the nominal 18 mm shift between wells.
Figure 4.
A) Adjacent well irradiations showing significant dose profile overlap. B) Every-other well irradiation showing flat beam profiles over targeted wells. C) Skipping two wells between targets.
Table 3.
Flatness and symmetry comparison for the first three peaks of different well irradiation configurations.
| Flatness [%] | Symmetry [%] | |||||
|---|---|---|---|---|---|---|
| Adjacent | 1 Skipped |
2 Skipped |
Adjacent | 1 Skipped |
2 Skipped |
|
| Peak 1 | 24.8% | 2.7% | 3.8% | 30.4% | 1.3% | 2.3% |
| Peak 2 | 23.4% | 4.0% | 3.2% | 2.3% | 1.6% | 2.2% |
| Peak 3 | 25.3% | 2.6% | 1.8% | 5.3% | 1.8% | 0.8% |
| Ave. | 24.0% | 3.1% | 2.9% | 12.7% | 1.5% | 1.8% |
| Std. Dev. | 0.9% | 0.8% | 1.0% | 15.4% | 0.3% | 0.9% |
Table 4.
Assessment of precision positioning system.
| Shift [mm] | Relative Percent Error |
|
|---|---|---|
| Profile 1 | - | - |
| Profile 2 | 17.92 | 0.45% |
| Profile 3 | 17.96 | 0.21% |
| Profile 4 | 17.95 | 0.26% |
| Ave. | 17.95 | 0.30% |
| Std. Dev. | 0.02 | 0.13% |
3.2 Cabinet irradiator comparison
Figure 5 provides the relative absorbed dose colorwashes for the 96-well plate being irradiated using the conventional top-down cabinet XRAD320 irradiator and the high-throughput irradiation system. Figure 5a demonstrates the large dose non-uniformities (up to 20%) that can be produced across individual wells for standard top-down irradiation delivery systems. The dose heterogeneity can be attributed to increased scatter from the well walls into the cellular plane and anode heel effects. Furthermore, unless additional shielding is used, these systems are usually designed for single uniform irradiations. In contrast, Figure 5b demonstrates the remarkable versatility afforded by the high-throughput system. The W-pattern was delivered to predetermined well positions using a variety of dose rates and a uniform absolute dose of 2 Gy. With the bottom-up approach of this irradiator, non-uniformities within each well were kept below 5%.
Figure 5.
Relative absorbed dose colorwash for the 96-well plate relative dose distribution of (a.) the XRAD320 conventional cabinet irradiator and (b.) the high-throughput system. Note that the corner wells during the XRAD irradiation were not filled with media, and are labeled with an asterisks (*). Also provided for the W-pattern irradiation are associated dose rates (in cGy/sec) for each 2 Gy irradiation to each well.
5. Discussion
There is significant variation in the severity of toxicity among patients that receive equivalent absorbed doses during radiation therapy. This variation has led to the development of genetic profiles that predict a patient’s probability of suffering toxicity following radiotherapy. Reliable predictive assays of normal-tissue dose response could permit the escalation of dose to the tumor leading to a higher probability of loco-regional tumor control. It is believed that even a 1% increase in dose could lead to 1–2% percent increase in the tumor control probability and that this dose response relationship scales linearly (Barnett et al., 2009).
New radiation therapy technology and treatment methods generate highly heterogeneous non-target dose distributions that vary widely from patient to patient. As pointed out by Bentzen et al, dose-volume effects significantly impact the statistical power needed to detect biological predictive factors with a specific effect size (Bentzen et al., 2010). Therefore, a practical screening assay to measure patient-specific radiosensitivity in the clinic would not only need to be high-throughput in nature, but would also need to provide adequate dosimetric resolution. In this context, our irradiator is capable of delivering 24 dose points (using an every-other well irradiation scheme) to a single 96-well microtiter plate. For example, our system is capable of irradiating 24 wells with a range of dose points from 0 to 5 Gy in 0.2 Gy increments in approximately 30 minutes. Traditional cabinet irradiators are unable to deliver multiple dose rates and/or doses within a single microtiter plate, each separate irradiation condition must be delivered to individual plates with sample preparation, bioassay, and analysis performed separately. This approach with traditional irradiators is both time consuming and unable to utilize high-throughput bioassay instrumentation to their full potential. Efforts are underway to enable single well resolution using additional collimation.
Recently, Abazeed and colleagues (Abazeed et al., 2013) reported on the development of a high-throughput platform for radiogenomic profiling in vitro. The group optimized clonogenic assay in a 384-well plate format. The dose to each plate ranged from 0 to 10 Gy and was delivered with a commercial 137Cs source. Combining this type of clonogenic assay with robotically controlled high-throughput irradiators will help pave the way for future clinical implementation of patient-specific radiogenomic profiling.
6. Conclusions
The development and characterization of a novel high-throughput irradiator to help support radiation sensitivity bioassays was presented. To the best of our knowledge, this is the first robotically controlled irradiator designed specifically to meet the fast-paced demands of the clinical setting and the modern biologic research lab. In this paper, IEC operational requirements that are traditionally used for larger electronic X-ray sources were adopted in order to characterize the performance of the system. As demonstrated, the system combines superior dosimetric accuracy and high-throughput precision compared to commercially available systems. However, given the impact of the proposed system on treatment outcomes and patient safety, additional quality assurance metrics for this type of system are warranted. Investigation of these metrics and future optimization of the irradiator are ongoing.
Acknowledgements
The authors would like to thank Benjamin Palmer and Samantha Simiele for their assistance in this work. Funding provided by the University of Wisconsin Carbone Comprehensive Cancer Center (UWCCC). This work is also supported in part by NIH/NCI P30 CA014520- UW Comprehensive Cancer Center Support. TLF supported in part by University of Wisconsin Science and Medicine Graduate Research Scholars.
References
- Abazeed ME, Adams DJ, Hurov KE, Tamayo P, Creighton CJ, Sonkin D, Giacomelli AO, Du C, Fries DF, Wong KK, Mesirov JP, Loeffler JS, Schreiber SL, Hammerman PS, Meyerson M. Integrative radiogenomic profiling of squamous cell lung cancer. Cancer Res. 2013;73:6289–6298. doi: 10.1158/0008-5472.CAN-13-1616. [DOI] [PMC free article] [PubMed] [Google Scholar]
- Andres C, Del Castillo A, Tortosa R, Alonso D, Barquero R. A comprehensive study of the Gafchromic EBT2 radiochromic film. A comparison with EBT. Med Phys. 2010;37:6271–6278. doi: 10.1118/1.3512792. [DOI] [PubMed] [Google Scholar]
- Badie C, Dziwura S, Raffy C, Tsigani T, Alsbeih G, Moody J, Finnon P, Levine E, Scott D, Bouffler S. Aberrant CDKN1A transcriptional response associates with abnormal sensitivity to radiation treatment. Br J Cancer. 2008;98:1845–1851. doi: 10.1038/sj.bjc.6604381. [DOI] [PMC free article] [PubMed] [Google Scholar]
- Barnett GC, West CM, Dunning AM, Elliott RM, Coles CE, Pharoah PD, Burnet NG. Normal tissue reactions to radiotherapy: towards tailoring treatment dose by genotype. Nat Rev Cancer. 2009;9:134–142. doi: 10.1038/nrc2587. [DOI] [PMC free article] [PubMed] [Google Scholar]
- Bentzen SM, Overgaard J. Patient-to-Patient Variability in the Expression of Radiation-Induced Normal Tissue Injury. Semin Radiat Oncol. 1994;4:68–80. doi: 10.1053/SRAO00400068. [DOI] [PubMed] [Google Scholar]
- Bentzen SM, Parliament M, Deasy JO, Dicker A, Curran WJ, Williams JP, Rosenstein BS. Biomarkers and surrogate endpoints for normal-tissue effects of radiation therapy: the importance of dose-volume effects. Int J Radiat Oncol Biol Phys. 2010;76:S145–S150. doi: 10.1016/j.ijrobp.2009.08.076. [DOI] [PMC free article] [PubMed] [Google Scholar]
- Borger JH, Kemperman H, Smitt HS, Hart A, Van Dongen J, Lebesque J, Bartelink H. Dose and volume effects on fibrosis after breast conservation therapy. Int J Radiat Oncol Biol Phys. 1994;30:1073–1081. doi: 10.1016/0360-3016(94)90312-3. [DOI] [PubMed] [Google Scholar]
- Boyd SD. Diagnostic applications of high-throughput DNA sequencing. Annu Rev Pathol. 2013;8:381–410. doi: 10.1146/annurev-pathol-020712-164026. [DOI] [PubMed] [Google Scholar]
- Burnet NG, Johansen J, Turesson I, Nyman J, Peacock JH. Describing patients' normal tissue reactions: concerning the possibility of individualising radiotherapy dose prescriptions based on potential predictive assays of normal tissue radiosensitivity. Steering Committee of the BioMed2 European Union Concerted Action Programme on the Development of Predictive Tests of Normal Tissue Response to Radiation Therapy. Int J Cancer. 1998;79:606–613. doi: 10.1002/(sici)1097-0215(19981218)79:6<606::aid-ijc9>3.0.co;2-y. [DOI] [PubMed] [Google Scholar]
- Casanova Borca V, Pasquino M, Russo G, Grosso P, Cante D, Sciacero P, Girelli G, La Porta MR, Tofani S. Dosimetric characterization and use of GAFCHROMIC EBT3 film for IMRT dose verification. J Appl Clin Med Phys. 2013;14:4111. doi: 10.1120/jacmp.v14i2.4111. [DOI] [PMC free article] [PubMed] [Google Scholar]
- Devic S, Aldelaijan S, Mohammed H, Tomic N, Liang LH, Deblois F, Seuntjens J. Absorption Spectra Time Evolution Of Ebt-2 model GAFCHROMIC film. Med Phys. 2010;37:2207–2214. doi: 10.1118/1.3378675. [DOI] [PubMed] [Google Scholar]
- Fulkerson RK, Dewerd L. Dosimetric characterization and output verification for conical brachytherapy surface applicators. Medical Physics. 2013 doi: 10.1118/1.4862505. In Press. [DOI] [PMC free article] [PubMed] [Google Scholar]
- Ho AY, Atencio DP, Peters S, Stock RG, Formenti SC, Cesaretti JA, Green S, Haffty B, Drumea K, Leitzin L, Kuten A, Azria D, Ozsahin M, Overgaard J, Andreassen CN, Trop CS, Park J, Rosenstein BS. Genetic predictors of adverse radiotherapy effects: the Gene-PARE project. Int J Radiat Oncol Biol Phys. 2006;65:646–655. doi: 10.1016/j.ijrobp.2006.03.006. [DOI] [PubMed] [Google Scholar]
- Hsiao A, Kuo MD. High-throughput biology in the postgenomic era. J Vasc Interv Radiol. 2006;17:1077–1085. doi: 10.1097/01.RVI.0000228840.12260.FF. [DOI] [PubMed] [Google Scholar]
- Kouloulias VE, Poortmans P, Antypas C, Kappas C, Sandilos P. Field flatness and symmetry of photon beams: Review of the current recommendations. Technology & Health Care. 2003;11:283–288. [PubMed] [Google Scholar]
- Kruse JJ, Stewart FA. Gene expression arrays as a tool to unravel mechanisms of normal tissue radiation injury and prediction of response. World J Gastroenterol. 2007;13:2669–2674. doi: 10.3748/wjg.v13.i19.2669. [DOI] [PMC free article] [PubMed] [Google Scholar]
- Mackay RI, Hendry JH. The modelled benefits of individualizing radiotherapy patients' dose using cellular radiosensitivity assays with inherent variability. Radiother Oncol. 1999;50:67–75. doi: 10.1016/s0167-8140(98)00132-7. [DOI] [PubMed] [Google Scholar]
- Mayer C, Popanda O, Greve B, Fritz E, Illig T, Eckardt-Schupp F, Gomolka M, Benner A, Schmezer P. A radiation-induced gene expression signature as a tool to predict acute radiotherapy-induced adverse side effects. Cancer Lett. 2011;302:20–28. doi: 10.1016/j.canlet.2010.12.006. [DOI] [PubMed] [Google Scholar]
- Mccaw TJ, Micka JA, Dewerd LA. Characterizing the marker-dye correction for Gafchromic((R)) EBT2 film: a comparison of three analysis methods. Med Phys. 2011;38:5771–5777. doi: 10.1118/1.3639997. [DOI] [PubMed] [Google Scholar]
- Nath R, Biggs PJ, Bova FJ, Ling CC, Purdy JA, Van De Geijn J, Weinhous MS. AAPM code of practice for radiotherapy accelerators: report of AAPM Radiation Therapy Task Group No. 45. Med Phys. 1994;21:1093–1121. doi: 10.1118/1.597398. [DOI] [PubMed] [Google Scholar]
- Raaphorst GP, Malone S, Alsbeih G, Souhani L, Szumacher E, Girard A. Skin fibroblasts in vitro radiosensitivity can predict for late complications following AVM radiosurgery. Radiother Oncol. 2002;64:153–156. doi: 10.1016/s0167-8140(02)00076-2. [DOI] [PubMed] [Google Scholar]
- Rieger KE, Hong WJ, Tusher VG, Tang J, Tibshirani R, Chu G. Toxicity from radiation therapy associated with abnormal transcriptional responses to DNA damage. Proc Natl Acad Sci U S A. 2004;101:6635–6640. doi: 10.1073/pnas.0307761101. [DOI] [PMC free article] [PubMed] [Google Scholar]
- Rivard MJ, Davis SD, Dewerd LA, Rusch TW, Axelrod S. Calculated and measured brachytherapy dosimetry parameters in water for the Xoft Axxent X-Ray Source: an electronic brachytherapy source. Med Phys. 2006;33:4020–4032. doi: 10.1118/1.2357021. [DOI] [PubMed] [Google Scholar]
- Russell NS, Begg AC. Editorial radiotherapy and oncology 2002: predictive assays for normal tissue damage. Radiother Oncol. 2002;64:125–129. doi: 10.1016/s0167-8140(02)00189-5. [DOI] [PubMed] [Google Scholar]
- Sonis S, Haddad R, Posner M, Watkins B, Fey E, Morgan TV, Mookanamparambil L, Ramoni M. Gene expression changes in peripheral blood cells provide insight into the biological mechanisms associated with regimen-related toxicities in patients being treated for head and neck cancers. Oral Oncol. 2007;43:289–300. doi: 10.1016/j.oraloncology.2006.03.014. [DOI] [PubMed] [Google Scholar]
- Svensson JP, Stalpers LJ, Esveldt-Van Lange RE, Franken NA, Haveman J, Klein B, Turesson I, Vrieling H, Giphart-Gassler M. Analysis of gene expression using gene sets discriminates cancer patients with and without late radiation toxicity. PLoS Med. 2006;3:e422. doi: 10.1371/journal.pmed.0030422. [DOI] [PMC free article] [PubMed] [Google Scholar]
- Tucker SL, Geara FB, Peters LJ, Brock WA. How much could the radiotherapy dose be altered for individual patients based on a predictive assay of normal-tissue radiosensitivity? Radiother Oncol. 1996;38:103–113. doi: 10.1016/0167-8140(95)01669-4. [DOI] [PubMed] [Google Scholar]
- West CM, Elliott RM, Burnet NG. The genomics revolution and radiotherapy. Clin Oncol (R Coll Radiol) 2007;19:470–480. doi: 10.1016/j.clon.2007.02.016. [DOI] [PubMed] [Google Scholar]


