Abstract
BACKGROUND
Multiple reports have demonstrated pancreatic cancer patients undergoing surgery have superior outcomes at high-volume hospitals. This study noted trends in access to high-volume centers for pancreatic resection and identified gaps in improving access.
STUDY DESIGN
We performed a retrospective analysis of the Nationwide Inpatient Sample (NIS 2000 to 2005) linked to the Area Resource File (ARF). Inclusion criteria were patients with primary diagnosis of pancreatic cancer who received pancreatic resection. The primary outcomes variable was treatment at high-volume hospitals (average annual case volume greater than 20). Independent variables included age, gender, race, Charlson Comorbidity Index score, insurance status, calendar year, and region, obtained from the Nation wide Inpatient Sample; community poverty level and density of all physicians, gastroenterologists, surgeons, and radiation oncologists were data obtained from the Area Resource File.
RESULTS
A total of 8,370 patients were identified. A minority (38.51%) were referred to high-volume hospitals. A significant increase in overall referral and odds of referral to a high-volume center was observed over time (22.2% in 2000 to 44.4% in 2005). Patients referred to high-volume centers were younger (61.9 versus 63.2 years, p < 0.001) and more likely to be Caucasian (81.7% versus 73.6%, p < 0.001). Patients greater than 85 years old, African Americans, Hispanics, and Asians were less likely to be referred, relative to their younger, Caucasian counterparts (p < 0.01). The overall trend toward improved referral over time was driven by improved referral among Caucasians. In multivariate analysis, access to high-volume centers was associated with calendar year, patient age, and race. In addition, increase in density of gastroenterologists or radiation oncologists in the population was also associated with higher likelihood of referral.
CONCLUSIONS
This study demonstrated that less than half of pancreatic cancer patients are being referred to high-volume centers. Unlike referral in Caucasians, improvement in referral for minorities has not occurred.
Pancreatic cancer is the fourth leading cause of cancer-related death in the US.1 The annual incidence of pancreatic cancer was 37,680 estimated new cases in 2008, and it accounts for an estimated 34,290 deaths annually. Median survival is 4 to 6 months, and the 5-year survival is less than 5%.2
It has been shown that patients with pancreatic cancer undergoing operations have superior postoperative outcomes at high-volume hospitals as compared with low-volume hospitals.3–7 In addition, recent data showed that these patients may also have improved longterm survival.8
Several studies have shown that access to high-volume centers and hospital outcomes may be affected by race and socioeconomic status.9–12 So the objectives of this study were to examine a large population-based database and determine contemporary trends in access to high-volume centers for pancreatic resections after the publication of volume-outcomes literature in the late 1990s; to identify gaps in the improvement in accessing high-volume centers, if any; and to identify potential public policy targets that may improve access.
METHODS
A retrospective analysis of the Nationwide Inpatient Sample (NIS, 20% of hospitals from 37 states) from 2000 to 2005 was performed. The NIS is a database compiling discharge data from inpatient hospitalizations from 20% of all hospitals from 37 participating states, maintained by the Agency for Healthcare Research and Quality as part of the Healthcare Cost and Utilization Project.13 It contains approximately 7 million patient discharge records per year, originating from approximately 1,000 different hospitals. Data available within the NIS include patient and hospital demographics, payer information, treating and concomitant diagnoses, in-patient procedures, in-patient mortality, and length of stay. This publicly available dataset was deemed by the Johns Hopkins Institutional Review Board exempt from review.
Health systems factors were assessed through Area Resource File (ARF), 2004 version, maintained by the Health Resources and Services Administration. This database contains more than 6,000 variables such as socioeconomic, environmental, geographic, and health systems characteristics, for each county within the US.14 This file was linked to the NIS through a common five-digit state/county modified Federal Information Processing Standards code. The publicly available ARF dataset was also deemed by the Johns Hopkins Institutional Review Board exempt from review.
Initial inclusion criteria screened patients with the ICD-9 diagnosis codes of pancreatic cancer (157.x), who received pancreatic resection (ICD9 procedure codes of 52.6, 52.7, 52.51, 52.52, 52.53, 52.59).3 Patients less than 18 years of age, and in whom the diagnosis of interest was not coded in the first two diagnosis fields were excluded. This increased specificity for patients undergoing a pancreatectomy for cancer and not for a benign condition.
The primary outcomes variable examined was treatment at a high-volume hospital, defined as average annual case volume of ≥20 pancreatic resections. This threshold was chosen based on previous work demonstrating that hospitals performing >20 pancreatic resections per year had notably better outcomes than hospitals that did not meet this threshold.4,7 Hospital procedure volume was determined by calculating the number of total pancreatic resections per NIS-assigned unique hospital identification numbers.
Independent variables examined included patient race, age in 5-year categories, gender, insurance status, disease severity and comorbidities as measured by the Charlson Index, calendar year, and region of the country. The Charlson Index is a standardized measure of patient comorbidities, and is determined by weighted scoring of comorbidities including cardiac, vascular, pulmonary, neurologic, endocrine, renal, hepatic, gastrointestinal, and immune diseases, and any documented history of cancer.15 It was adapted for use on an administrative dataset by Romano and colleagues.16 In addition, from the ARF, community poverty level (defined as the percent of population below poverty level) and the density of all physicians, gastroenterologists, surgeons, and radiation oncologists (calculated as number per 10,000 population) were included.
Statistical analysis was performed using the software package STATA MP Version 10.0. Bivariate analysis of categorical data was performed using the chi-squared test. Analysis of continuous data was performed using Student’s t-test. Multivariate analysis was performed using multiple logistic regression models. A p value <0.05 was considered statistically significant.
RESULTS
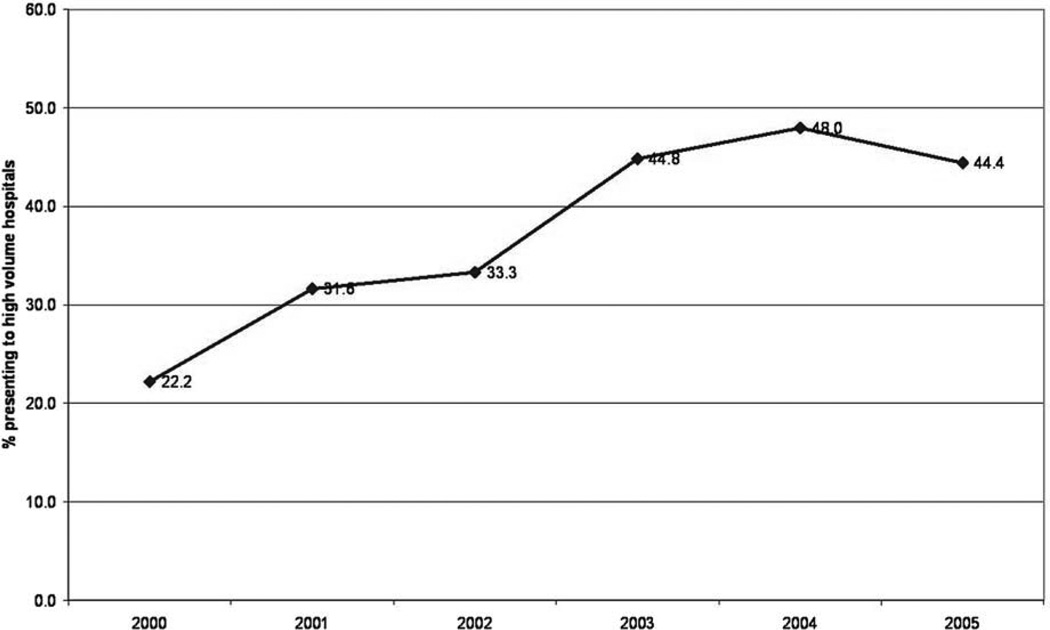
A total of 8,370 pancreatic cancer patients undergoing the Whipple procedure were identified using ICD-9 diagnosis and procedural codes over a 6-year period (2000 to 2005). Patients had a mean (median) age of 62.7 (65) years and a slight majority were men (51.8%). Most patients (76.7%) were Caucasian. Patients had a mean (median) Charlson Index score of 6.1 (5). Almost all (99.81%) patients were insured, reflecting a large proportion of older patients insured through Medicare. Most patients were seen in urban hospitals (83.2%).The majority of patients underwent a pancreaticoduodenectomy at low-volume hospitals (61.49%), although there was a steady and significant increase in the proportion of patients presenting to high-volume hospitals over the course of the study period, from 22.2% in 2000 to 44.4% in 2005 (p < 0.001; Fig. 1).
Figure 1.
There has been a steady, significant increase in the proportion of patients being referred to high-volume hospitals over time, from 22.2% of patients in 2000 to 44.4% in 2005 (p < 0.001).
Table 1 presents the characteristics of patients presenting to high-volume versus low-volume hospitals. Patients presenting to high-volume centers were younger (61.9 versus 63.2 years, p < 0.001) and more likely to be Caucasian (81.7% of high-volume patients were Caucasian versus 73.6% of low-volume patients, p < 0.001); African Americans and Hispanics are more likely to present to low-volume hospitals (Table 1). There was no significant difference in access to high-volume centers by gender. Additionally, the comorbidity profiles of the patients, as measured by mean Charlson Index score, were not significantly different. Themortality rate among patients treated at high-volume centers, as has been demonstrated previously, was significantly lower than that at low-volume centers (3.1% versus 9.0%, p < 0.001), confirming the volume-outcomes relationship demonstrated in previous studies was also present in this dataset.
Table 1.
Baseline Characteristics of Study Population
| Characteristic | High-volume (n = 3,223) |
Low volume (n = 5,147) |
p Value |
|---|---|---|---|
| Mean age, y (SD) | 61.9 (13.3) | 63.2 (13.3) | <0.001 |
| Gender, n (%) | 0.349 | ||
| Male | 1,648 (51.2) | 2,686 (52.2) | |
| Female | 1,573 (48.8) | 2,458 (47.8) | |
| Race, n (%) | <0.001 | ||
| Caucasian | 1,952 (81.7) | 2,833 (73.6) | |
| African-American | 172 (7.2) | 418 (10.9) | |
| Hispanic | 138 (5.8) | 350 (9.1) | |
| Asian or Pacific Islander | 59 (2.5) | 133 (3.5) | |
| Native-American | 11 (0.5) | 13 (0.3) | |
| Other | 58 (2.4) | 104 (2.7) | |
| Mean Charlson Index (SD) | 6.1 (3.7) | 6.1 (3.7) | 0.273 |
| Mortality, % | 3.1 | 9.0 | <0.001 |
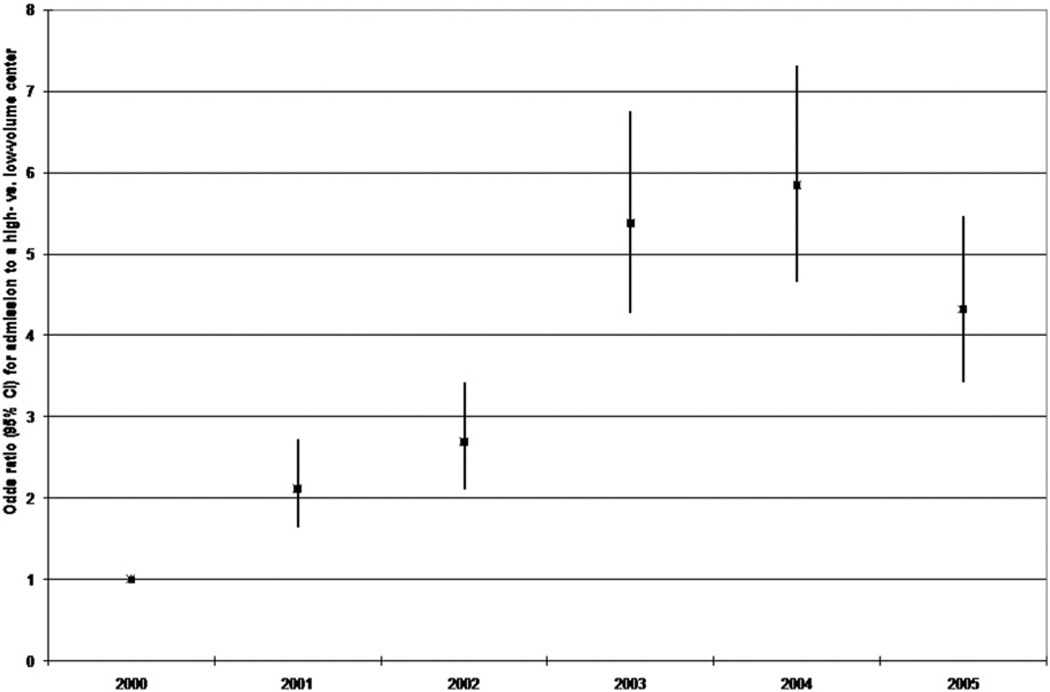
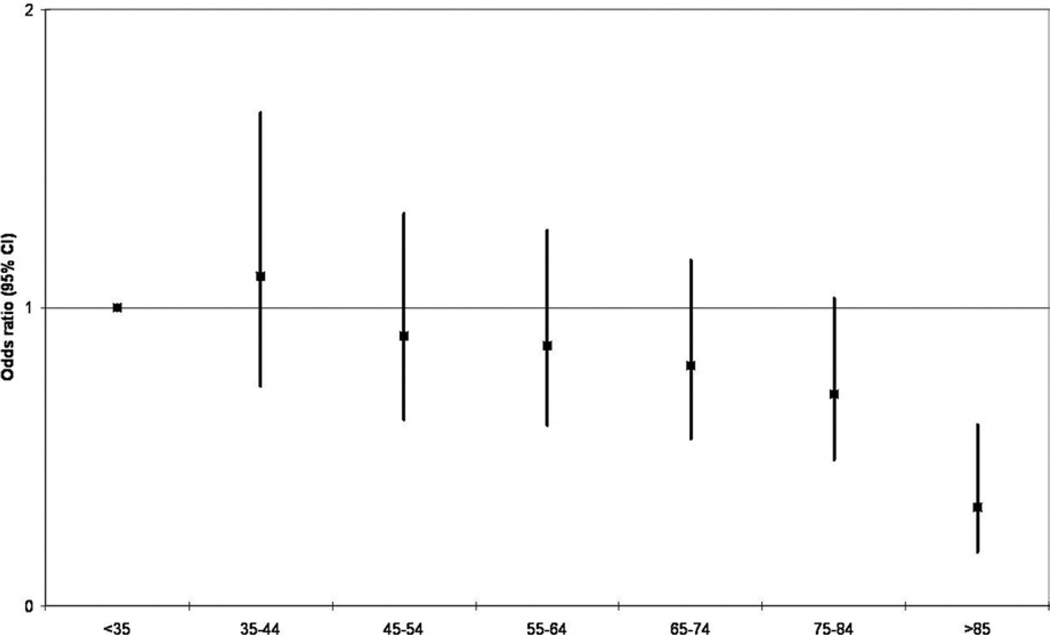
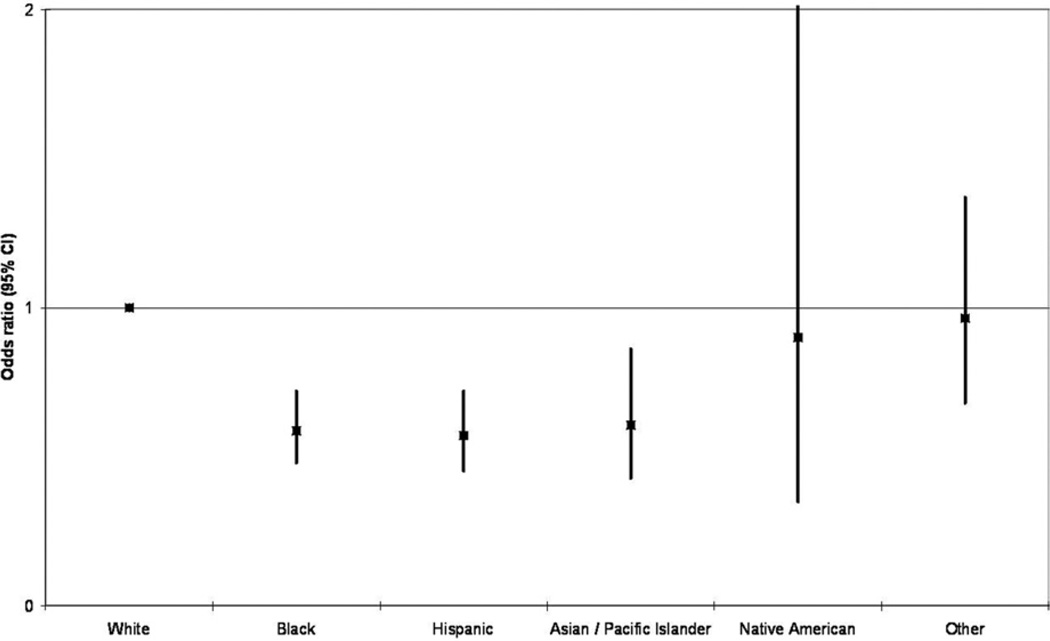
In multivariate analysis, three factors were associated with access to high-volume centers: calendar year, patient age, and patient race. Between 2000 and 2005, there was a significant increase in the likelihood of patients to be admitted to high-volume centers, confirming the trends observed on unadjusted analyses. By 2005, the likelihood of a pancreatic cancer patient being admitted to a high-volume center was 4.3 times (95% CI 3.42 to 5.47, p < 0.001) the likelihood of a similar patient in the year 2000 (Fig. 2). Age did not significantly influence access to high-volume centers, except in patients over 85 years of age, who were approximately 65% less likely as younger patients to be referred to a high-volume center (odds ratio [OR] 0.33, 95% CI 0.18 to 0.61) (Fig. 3). Finally, patient race was significantly associated with access to high-volume centers. African Americans, Hispanics, and Asians were all significantly less likely to be treated at high-volume centers, approximately 40% less likely compared with their Caucasian counterparts (OR 0.59, 95% CI 0.48 to 0.72 for African Americans; OR 0.57, 95% CI 0.45 to 0.72 for Hispanics; and OR 0.61, 95% CI 0.43 to 0.86 for Asians; Fig. 4).
Figure 2.
Multivariate analysis by year demonstrates a significant increase in the likelihood of patients being referred to high-volume centers over time.
Figure 3.
Multivariate analysis by age demonstrates patients older than 85 years old are less likely than their younger counterparts to be referred to high-volume centers.
Figure 4.
Multivariate analysis by race demonstrates that African Americans, Hispanics, and Asians are all significantly less likely to be referred to high-volume centers compared with their Caucasian counterparts.
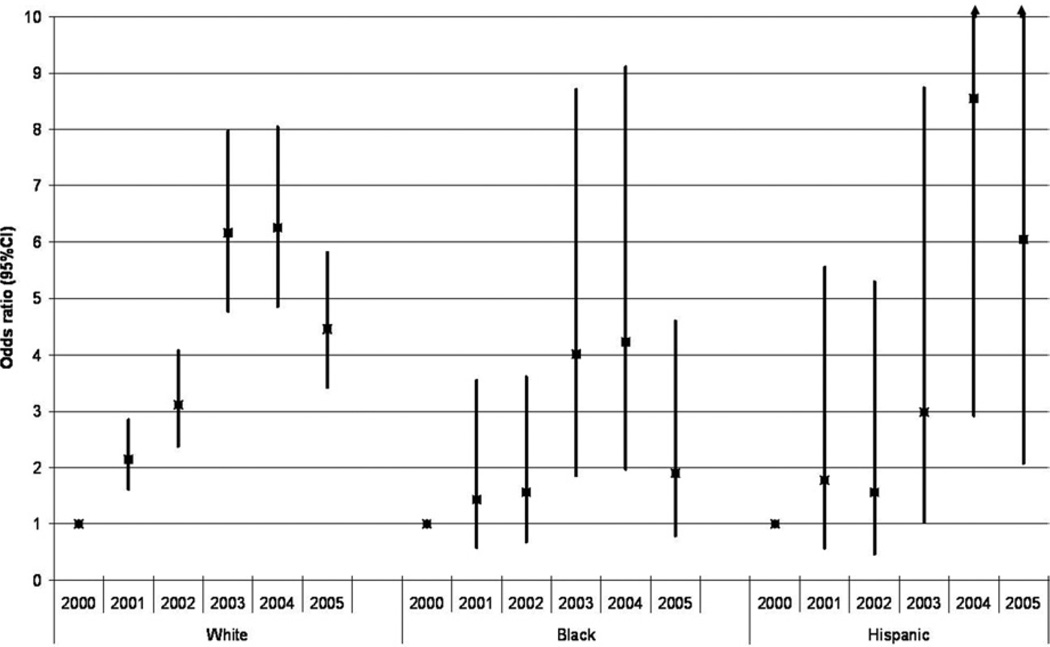
To characterize the relationship between calendar year, race, and access to high-volume centers, a subset analysis was performed to examine each racial group separately. This analysis demonstrated that the overall trend toward improved access to high-volume centers was being driven primarily by improved access among Caucasians (Fig. 5). In contrast, African Americans and Hispanics had not had significantly improved access to high-volume centers for pancreatic resection over this time period. Asians were not analyzed because of their small sample size.
Figure 5.
The overall trend toward improved referral was driven primarily by the Caucasian subset, which demonstrated significantly improved referral to high-volume centers over time, as opposed to African Americans and Hispanics, who did not demonstrate any persistent, significantly improved referral over time.
To better understand health system factors that may affect access to high-volume centers, the NIS database was linked to the ARF file, which includes poverty level and density of different provider specialties. The linkage was successful for 76.0% of the patients in our study population. On multivariate analysis, adjusting for the same set of variables described in previous paragraphs, it was found that poverty level does not significantly affect access to high-volume centers. In contrast, the density of gastroenterologists and radiation oncologists in the area was found to be associated with differences in access to high-volume centers for pancreatic resections. For every increase of 1 gastroenterologist per 10,000 population, the likelihood of treatment at a high-volume center increased 3.0 times (95% CI 1.8 to 4.9, p < 0.001), and for every increase of 1 radiation oncologist per 10,000 population, the likelihood of treatment at a high-volume center increased 66.3 times (95% CI 30.9 to 141.9, p < 0.001). The density of surgeons in the area, on the other hand, was not associated with increased likelihood of treatment at high-volume centers (OR 0.94, 95% CI 0.83 to 1.1, p < 0.42).
DISCUSSION
Despite the literature on a volume-outcomes relationship for pancreatic surgery, our study found that a significant proportion of patients are still being referred to low-volume centers in the US. This has important implications for treatment of pancreatic cancer patients because high-volume centers have been shown to be associated with a significant decrease in postoperative mortality3–7 and an increase in longterm survival.8 But there has been an encouraging trend toward improvement over the years since 2000. Nevertheless, this improvement is seen only in Caucasian patients; all other racial groups are approximately 40% less likely to be treated at high-volume centers.
There has been extensive published literature on racial disparity in access to care, and our study confirms that minorities have not benefited from the same improvement in access to high-volume centers as Caucasians have. An interesting extension of our study is the finding that density of gastroenterologists and radiation oncologists in the com- munity may improve access to high-volume centers. This may be a reflection of the enhanced awareness of the literature on pancreatic surgery by physicians in those communities. Such a finding can also have important public policy implications because it identifies potential targets on which to focus longterm outreach efforts. But increasing the numbers of gastroenterologists and radiation oncologists in all communities is not immediately feasible or economically viable. A more immediate and practical approach may be to educate existing internists and primary care providers in the community with specialist knowledge related to complex resections such as pancreatic surgery and emphasizing the literature on the volume-outcomes relationship for such operations. Additionally, market forces, such as incurring the costs of liability coverage for complex surgery, may cause community surgeons to refrain from undertaking complex pancreatic resections at relatively low-volume centers. In addition, patient-specific rationales for seeking care at low-volume centers, such as ease of transportation, may exist for select patient populations.
The observation that the majority of patients are insured highlights another potential leverage point for improving access. These data may be conveyed to insurance companies, which may want to start preferentially referring their patients to high-volume centers as part of their coverage networks. It should be noted that the observation that almost all pancreaticoduodenectomy patients are insured does not mean that all patients with the disease are insured; it merely means that by the time of operation, these patients have obtained insurance coverage, or, as is more likely, the other patients who were not insured simply did not undergo operations.
There are many limitations of this study. This is a retrospective analysis of a large population database, which can contain errors in coding. But there is no reason to suspect that the errors would be more or less concentrated in any particular group, so it is unlikely that they contribute to these findings. Additionally, missing data is an issue, such as race data and county code data, which are relied on in this study. Some states simply choose, as a matter of policy, not to collect or release certain data elements. Because these administrative decisions are unrelated to our study question, they are unlikely to bias our findings; in other words, there is no reason to suspect that the relationship observed would be different among patients who have complete data versus patients in states that choose not to release certain demographic data. We have no cancer staging data in this database, and so it may be argued that African-American and other minority patients may be less likely to be referred for operation because they may present with unresectable disease. But this analysis focuses only on patients who received a surgical resection, so the patients whose disease was not resectable were excluded from our analysis. Another limitation of our study relates to the use of the ARF, which identifies the providers of services by the county in which they are located rather than the counties that they serve. So, we may be underestimating the full reach of providers in this analysis by assuming that providers deliver care primarily to patients within their county as opposed to patients from more distant sites. But this may not be an issue unless there is a significant proportion of patients who leave their home area to seek the advice of a gastroenterologist. Such may be the case for surgical specialists, but is less likely to be the case for internists.
This study demonstrates that less than half of patients with pancreatic cancer are being referred to high-volume centers. Our study raises the question about road blocks in the referral process to high-volume centers, especially among minority patients, but also among Caucasian patients. Future studies should delineate whether the referrals are being driven by providers or patients themselves, or by external forces such as insurance companies, to allow us to better focus health policy interventions. Finally, such studies will also have implications for other complex surgical procedures for which there are significant volume-outcomes relationships.
Abbreviations and Acronyms
- ARF
Area Resource File
- NIS
Nationwide Inpatient Sample
- OR
odds ratio
Footnotes
Disclosure Information: Nothing to disclose.
Author Contributions
Study conception and design: Chang, Ahuja
Acquisition of data: Chang
Analysis and interpretation of data: Chang, Zhang, Mukherjee, Ahuja
Drafting of manuscript: Chang, Mukherjee, Ahuja
Critical revision: Chang, Zhang, Mukherjee, Wolfgang, Schulick, Cameron, Ahuja
REFERENCES
- 1.Jemal A, Siegel R, Ward E, et al. Cancer statistics 2008. CA Cancer J Clin. 2008;58:71–96. doi: 10.3322/CA.2007.0010. [DOI] [PubMed] [Google Scholar]
- 2.Baxter NN, Whitson BA, Tuttle TM. Trends in the treatment and outcome of pancreatic cancer in the United States. Ann Surg Oncol. 2007;14:1320–1326. doi: 10.1245/s10434-006-9249-8. [DOI] [PubMed] [Google Scholar]
- 3.Gordon TA, Burleyson GP, Tielsch JM, Cameron JL. The effects of regionalization on cost and outcome for one general high-risk surgical procedure. Ann Surg. 1995;221:43–49. doi: 10.1097/00000658-199501000-00005. [DOI] [PMC free article] [PubMed] [Google Scholar]
- 4.Sosa JA, Bowman HM, Gordon TA, et al. Importance of hospital volume in the overall management of pancreatic cancer. Ann Surg. 1998;228:429–438. doi: 10.1097/00000658-199809000-00016. [DOI] [PMC free article] [PubMed] [Google Scholar]
- 5.Begg CB, Cramer LD, Hoskins WJ, Brennan MF. Impact of hospital volume on operative mortality for major cancer surgery. JAMA. 1998;280:1747–1751. doi: 10.1001/jama.280.20.1747. [DOI] [PubMed] [Google Scholar]
- 6.Birkmeyer JD, Siewers AE, Finlayson EV, et al. Hospital volume and surgical mortality in the United States. N Engl J Med. 2002;346:1128–1137. doi: 10.1056/NEJMsa012337. [DOI] [PubMed] [Google Scholar]
- 7.Meguid RA, Ahuja N, Chang DC. What constitutes a “high-volume” hospital for pancreatic resection? J Am Coll Surg. 2008;206:622.e1–622.e9. doi: 10.1016/j.jamcollsurg.2007.11.011. [DOI] [PubMed] [Google Scholar]
- 8.Birkmeyer JD, Sun Y, Wong SL, Stukel TA. Hospital volume and late survival after cancer surgery. Ann Surg. 2007;245:777–783. doi: 10.1097/01.sla.0000252402.33814.dd. [DOI] [PMC free article] [PubMed] [Google Scholar]
- 9.Liu JH, Zingmond DS, McGory ML, et al. Disparities in the utilization of high-volume hospitals for complex surgery. JAMA. 2006;296:1973–1980. doi: 10.1001/jama.296.16.1973. [DOI] [PubMed] [Google Scholar]
- 10.Lidor AO, Gearhart SL, Wu AW, Chang DC. Effect of race and insurance status on presentation, treatment, and mortality in patients undergoing surgery for diverticulitis. Arch Surg. 2008;143:1160–1165. doi: 10.1001/archsurg.143.12.1160. [DOI] [PubMed] [Google Scholar]
- 11.Rosson GD, Singh NK, Ahuja N, et al. Multilevel analysis of the impact of community vs patient factors on access to immediate breast reconstruction following mastectomy in Maryland. Arch Surg. 2008;143:1076–1081. doi: 10.1001/archsurg.143.11.1076. [DOI] [PubMed] [Google Scholar]
- 12.Ahuja N, Chang D, Gearhart SL. Disparities in colon cancer presentation and in-hospital mortality in Maryland: a ten-year review. Ann Surg Oncol. 2007;14:411–416. doi: 10.1245/s10434-006-9130-9. [DOI] [PubMed] [Google Scholar]
- 13.Healthcare Cost and Utilization Project. Overview of the Nationwide Inpatient Sample (NIS) Rockville, MD: Agency for Healthcare Research and Quality; [Accessed September 21, 2009]. Available at: http://www.hcup-us.ahrq.gov/nisoverview.jsp. [Google Scholar]
- 14. [Accessed January 23, 2009];US Department of Health and Human Services, Health Resources and Services Administration. Area Resource File. Available at: http://www.arfsys.com/.
- 15.Charlson ME, Pompei P, Ales KL, MacKenzie CR. A new method of classifying prognostic comorbidity in longitudinal studies: development and validation. J Chronic Dis. 1987;40:373–383. doi: 10.1016/0021-9681(87)90171-8. [DOI] [PubMed] [Google Scholar]
- 16.Romano PS, Roos LL, Jollis JG. Adapting a clinical comorbidity index for use with ICD-9-CM administrative data: differing perspectives. J Clin Epidemiol. 1993;46:1075–1079. doi: 10.1016/0895-4356(93)90103-8. [DOI] [PubMed] [Google Scholar]


