

Abstract
We investigate the physical origin of peptide-induced membrane curvature by contrasting differences between H-bonding interactions of prototypical cationic amino acids, arginine (Arg) and lysine (Lys), with phosphate groups of phospholipid heads using quantum mechanical (QM) calculations of a minimum model, and test the results via synthetic oxaorbornene-based transporter sequences without the geometric constraints of polypeptide backbones. QM calculations suggest that although individual Lys can in principle coordinate two phosphates, they are not able to do so at small inter-Lys distances without drastic energetic penalties. In contrast, Arg can coordinate two phosphates down to less than 5 Å, where guanidinium groups can stack ‘face to face’. In agreement with these observations, poly-Lys cannot generate the nanoscale positive curvature necessary for inducing negative Gaussian membrane curvature, in contrast to poly-Arg. Also consistent with QM calculations, polyguanidine-oxanorbornene homopolymers (PGONs) showed that curvature generation is exquisitely sensitive to the guanidinium group spacing when the phosphate groups are near close packing. Addition of phenyl or butyl hydrophobic groups into guanidine-oxanorbornene polymers increased the amount of induced saddle-splay membrane curvature, and broadened the range of lipid compositions where saddle-splay curvature was induced. The enhancement of saddle-splay curvature generation and relaxation of lipid composition requirements via addition of hydrophobicity is consistent with activity profiles. While PGON polymers displayed selective antimicrobial activity against prototypical (Gram positive and negative) bacteria, polymers with phenyl and butyl groups were also active against red blood cells. Our results suggest that it is possible to achieve deterministic molecular design of pore forming peptides.
Introduction
Membrane-active peptides and proteins often use arginine to confer strong interactions with cell membranes. For example, hydrophilic arginine-rich cell penetrating peptides (CPP) such as the TAT peptide can efficiently translocate across cellular membranes.1–6 And many types of antimicrobial peptides (AMP) like amphipathic α- and θ-defensins from mammals, which display potent in vitro activity against bacteria via membrane permeabilization, use arginine over lysine.7–9 Due to their biological significance and complex interactions with cell membranes much scientific effort has gone into understanding the observed structure-function relationships between arginine-rich peptides and biomembranes.
There is substantial evidence that the guanidine side chain of arginine is responsible for its unique membrane interactions. For CPPs, the first indication of its importance was demonstrated when Vives1 showed that an arginine-rich, 11AA sequence from the transactivator of transcription (TAT) protein of HIV, YGKKRRQRRR, now referred to as the TAT peptide, is sufficient for cellular uptake. It was soon realized by Wender10 and Mitchell11 that the uptake ability of the TAT peptide was due to its guanidinium ions as exemplified by their demonstrations that L- and D-arginine oligomers were more efficient than the TAT peptide, and homopeptides consisting of other cationic residues including histidine, lysine, and ornithine were less effective. They also showed that cellular uptake was a non-monotonic function of poly-arginine length11 and depended on residue spacing.12 As uptake is sensitive to the arrangement of arginine side chains a number of groups have designed synthetic guanidinium-rich cell penetrating molecules, or molecular transporters, using oligoarginine peptoids,10 and non-peptidic versions including synthetic polymers,13–18 oligocarbamates,19 polyguanidino dendrimers based on diamino acid monomeric units,20 and carbohydrate-based molecules like guanidinylated neomycin.21 Many of these molecules displayed similar or better uptake than poly-arginine and the TAT peptide, suggesting that guanidinium-rich molecular transporters have a rich potential for applications such as drug delivery and antibiotics.
How CPP-membrane interactions promote uptake is not well understood at a fundamental molecular level. To explain the central role of the guanidinium group, Mitchell11 originally cited its ability to form stable bidentate hydrogen bonds with anions such as phosphate or sulfate, which was believed to distinguish arginine from lysine and histidine. This was an interesting and conceptually powerful proposal. It implied that Arg-rich CPPs could in principle form strong complexes with anionic membrane components like phospholipid headgroups and enable uptake.22 Conversely, the monodentate H-bonding abilities of Lys might be incapable of stabilizing strong complexes so Lys-rich peptides exhibit poor uptake.22,23 As the CPP discourse has primarily focused on whether they enter cells by direct translocation24–29 or endocytosis,30–34 the prevailing explanation for why Arg-rich peptides have better uptake than Lys-rich peptides has remained in terms of qualitative H-bonding descriptions.29,35–38 Despite the widespread description of Arg vs Lys in terms of bidentate vs monodentate H-bonding for cationic, membrane-active transporters, there is no molecular understanding of how the interactions of guanidinium groups with anionic membrane components lead to translocation, while the interactions of amine groups with these components do not.
In recent work, we proposed a qualitative nanoscale model for understanding membrane curvature generation by CPPs39 and AMPs40. Cationic polymers such as poly-Arg and poly-Lys can generate negative curvature via electrostatic interactions with anionic membranes.41 For guanidinium groups, bidentate H-bonding42 can in principle lead to enhanced steric effects that generate positive membrane curvature along a poly-Arg chain. Therefore, poly-Arg can generate negative Gaussian curvature, positive and negative curvature in orthogonal directions, which is necessary for active membrane permeation43 processes like pore formation and the membrane protrusions and invaginations present in endocytic processes.41,44,45 This stands in contrast to presumed monodentate H-bonding of primary amine groups, the side chain of Lys, which cannot translocate across membranes. In this proposed qualitative model, the propensity for monodentate and bidentate H-bonding for lysine and arginine is assumed for simplicity. However, such propensity is likely complex because these interactions depend on the molecular details of the surrounding environment. Previous theoretical works34,35,46,47 on Arg-Arg and Lys-Lys associations in bulk water have shown that like-charge pairing is more stable between guanidinium groups than ammonium groups, and that interactions of guanidinium pairs are optimal when the side chains are in a stacking arrangement. Similar trends were observed at the level of potential of mean force from MD studies of guanidinium groups at the lipid bilayer-water interface.48 What is not known is how these structural tendencies are expressed when Arg and Lys interact with phospholipid headgroups, and how such tendencies are dependent on the effective spacing of the amino acid side chains. There is a significant need for a deeper understanding for how ensembles of side chains hydrogen bond to lipid headgroups.
Here, we investigate the physical origin of peptide-induced membrane curvature by contrasting differences between H-bonding interactions of Arg and Lys with phosphate groups using quantum mechanical (QM) calculations, and test the results via engineered molecular transporters without the geometric constraints imposed by polypeptide backbones. Surprisingly, QM calculations suggest that individual Lys can coordinate two phosphates. However, they are not able to do so at small inter-Lys distances without drastic energetic penalties. In contrast, Arg are able to coordinate two phosphates stably down to inter-guanidinium distances of less than 5 Å, where guanidinium groups stack ‘face to face’. We hypothesize that the persistence of this stacking arrangement in poly-Arg allows it to ‘crosslink’ lipid headgroups into composite objects with a large effective head area, and generate positive intrinsic curvature via excluded volume interactions in a manner that poly-Lys cannot duplicate. In agreement with this hypothesis, poly-Arg can generate the positive membrane curvature necessary for inducing negative Gaussian curvature, whereas poly-Lys cannot. Also consistent with QM calculations, polyguanidine-oxanorbornene homopolymers (PGONs), which have the same guanidinium side-chains as poly-Arg, but are not constrained by distances characteristic of polypeptide chains, showed that curvature generation is exquisitely sensitive to the guanidinium group spacing when the phosphate groups are near close packing. An increase of guanidinium group spacing from 3.6 Å to 5.8 Å decreased the maximum induced negative Gaussian curvature by 22%. Our study provides a unified molecular description for how guanidinium groups contribute to the established membrane translocation abilities of molecular transporters.
Nanoscale positive curvature generation by lipid headgroup coordination is distinct from hydrophobic insertion, a complementary strategy of generating such curvature by peptides.40,49,50 To examine how these two different mechanisms interact with one another phenyl or butyl hydrophobic groups were added into guanidine-oxanorbornene polymers. In general, incorporation of hydrophobicity increased the amount of saddle-splay membrane curvature that was generated as well as broadened the range of lipid compositions where saddle-splay curvature was observed, showing that positive curvature generation by hydrophobicity can combine with lipid headgroup coordination by guanidinium to promote membrane permeation. Our results show that it is possible to design pore forming peptides with programmable membrane curvature generating abilities which influence their pore forming activities.
Experimental Section
QM methods
The global minima for monodentate and bidentate phosphated side chains of Lys and Arg were found using the Density Functional Theory (DFT), B3LYP51–53 /6-31G*54,55, as well as MP256–58/6-311++G** and PDDG/PM359,60 calculations. For the single side chain interacting with phosphate groups, the results obtained with the three methods are in an excellent agreement. For larger systems containing two side chains, the PDDG-PM3 method was used exclusively. We justify our choice of method by the intentionally qualitative nature of the produced results. Our simple model systems are very small as compared to the realistic peptide-membrane systems, and our goal is to compare several similar systems. Scans along the reaction coordinates, corresponding to two side chains decorated with phosphate groups approaching each other, were done with PDDG/PM3 (See Supporting Information for details). Calculations were done with the use of the GB/SA61 implicit solvation model. The effect of the salt present in solution on the reaction profiles was not included. All degrees of freedom in the complexes, including those associated with phosphate groups, and except for the reaction coordinate and the angles and torsions defining the mutual orientations of the two side chains (Supporting Information), were optimized in the scans. Gaussian 0962 was used for DFT calculations, and BOSS63 was used for semiempirics.
Polymer synthesis
Polymers were synthesized similar to literature procedures with minor modifications.14,16,17,64 Detailed synthetic procedures are in the Supporting Information. The base for both the guanidine and hydrophobe monomers was synthesized by a Diels-Alder reaction between maleimide and furan. For the guanidine monomer, the functional group was added by Mitsunobu coupling followed by guanidinylation. The hydrophobic monomers were similarly synthesized using Mitsunobu coupling. Polymers were synthesized from these monomers by ring-opening-metathesis polymerization (ROMP) using a 3rd generation Grubbs’ catalyst.
Antimicrobial and hemolysis testing
Antimicrobial and hemolysis testing were done similar to previous procedures.64 Bacterial strains of E. coli (D31) and S. aureus (ATCC 25923) were incubated in Mueller-Hinton Broth overnight at 37°C. The culture is then diluted to 106 CFU/mL, as measured by OD600. Polymers were then dissolved in a stock solution of 40 mg/mL in DMSO. Serial dilutions were performed in phosphate-buffered saline (PBS). Antibacterial activity was expressed as the minimum inhibitory concentration (MIC90), the concentration at which bacterial growth was inhibited by at least 90% compared to growth in broth alone after 6 h at 37°C, as measured by OD600. Hemolytic activity was measured using separated red blood cells. 30 μL of human blood was suspended in 10 mL PBS and centrifuged three times, resuspending in buffer each time. Polymers were dissolved in a stock solution of 40 mg/mL in DMSO. Serial dilutions are performed in PBS. 100 μL of these polymer solutions were added to 100 μL of the blood cell solutions. These suspensions were allowed to stir for 30 min, then centrifuged. The absorbance of the supernatant at 414 nm was used to measure the amount of hemoglobin release. The positive control (total hemolysis) was obtained by adding 10 μL 20% Triton X-100 solution to the red blood cells. The HC50 was reported as the concentration of polymer that causes 50% release of hemoglobin.
Liposome preparation for X-ray measurements
Liposomes were prepared as described previously.40 Briefly, DOPC (1,2-dioleoyl-sn-glycero-3-phosphocholine), DOPE (1,2-dioleoyl-sn-glycero-3-phosphoethanolamine), and DOPS (1,2-dioleoyl-sn-glycero-3-phospho-L-serine (sodium salt)), lyophilized lipids from Avanti Polar lipids were used without further purification. SUVs were prepared by sonication. Individual stock solutions of DOPS, DOPC, and DOPE were prepared in chloroform at ~20 mg/ml. Ternary mixtures of these lipids were prepared at mass ratios, e.g. DOPS/DOPE/DOPC = 20/60/20 corresponds to a 1:3:1 mass ratio. Chloroform was evaporated under N2, and the mixtures were further dried by overnight desiccation under vacuum. The dried lipids were resuspended the next day in 100 mM NaCl or in Millipore H2O. Solutions were incubated at 37°C for 12–24 hours and then sonicated until clear. Small unilamellar vesicles (SUV’s) were obtained via extrusion (0.2 μm pore Nucleopore filter).
SAXS experiments
All polymers were resuspended in either 100 mM NaCl or in Millipore H2O. Lipids were thoroughly mixed with polymers at specific peptide to lipid ratios (P/L) in 100 mM NaCl. The solutions were hermetically sealed in quartz capillaries (Hilgenberg GmbH, Mark-tubes, Code No: 4017515). SAXS experiments at synchrotron sources were conducted at the Stanford Synchrotron Radiation Laboratory (BL 4-2), and the Advanced Light Source (beamline 7.3.3). Monochromatic X-rays with energies 9–11 keV were used at SSRL and 10 keV at ALS. The scattered radiation was collected using a Rayonix MX225-HE detector (pixel size, 73.2 μm) at SSRL and a Pilatus 100k detector (pixel size, 172 μm). Samples were also measured at the California NanoSystems Institute (CNSI) at UCLA using an in house setup. A compact SAXS light source (Forvis Technologies, Inc.) was used in conjunction with a mar345 image plate detector (pixel size, 150 μm). Identical samples were prepared and measured at multiple sources to check for and ensure mutual consistency. The 2D SAXS powder patterns were integrated using the Nika 1.48 package65 for Igor Pro 6.21 and FIT2D.66
SAXS data fits
A similar approach to the one described previously40 was used to determine cubic phase lattice parameters. The measured cubic Q peak positions were related to the Miller indices h, k, and l, for the observed reflections using the equation for a powder averaged Pn3m cubic phase, QmeasCubic = 2π√(h2 + k2 + l2)/a. The lattice parameter, a, was calculated from the slope of the trendline obtained from a linear fit of QmeasCubic versus √(h2 + k2 + l2). For the plot of |<K>| versus <Degree of Polymerization> for poly-Arg and PGON (Figure 1B), the lines that guide the eye were constructed via fits of the data to exponentially modified Gaussian functions.
Figure 1.
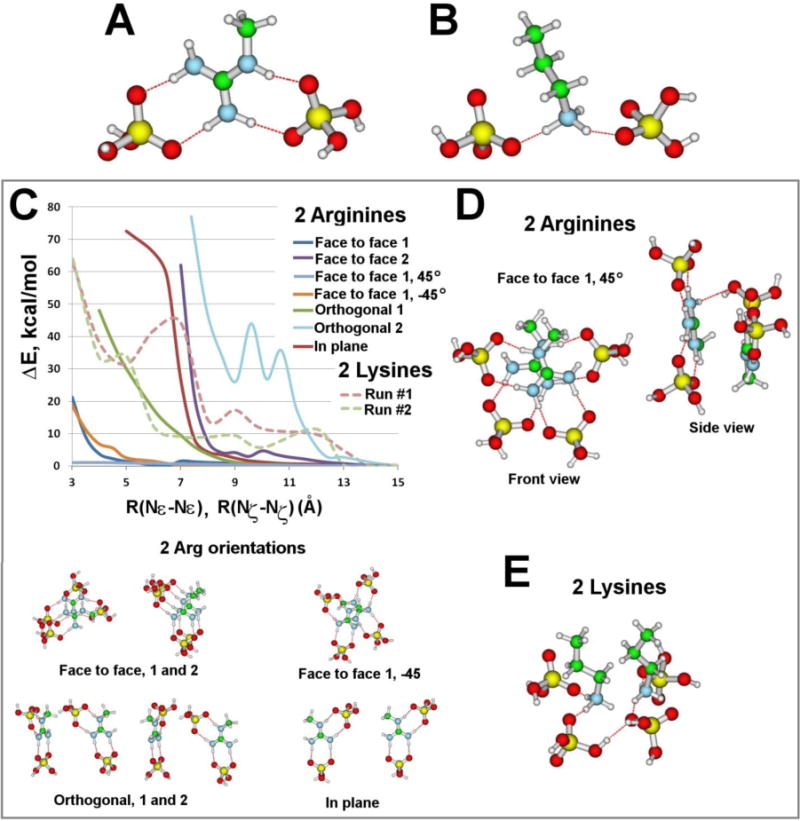
The global minima for (A) an Arg side chain fragment and (B) a Lys side chain fragment, coordinating two phosphates. In each case, the energy of complexation is ca. 160 kcal/mol. For Arg, the shown isomer is at least 8 kcal/mol lower in energy than other isomers. C. Energies of the 2 Arg/Lys(H2PO4)2− complexes as a function of side chain separation for different mutual orientations. The distances between two guanidinium groups or two amine groups are measured from their Nε or Nζ atoms, respectively (see Figure S2 for details). The probed orientations of 2 Arg(H2PO4)2−, are shown below. For Arg the mutual orientations of the 2 Arg(H2PO4)2− complexes strongly affect their complexation energies. As the distance between diphosphated guanidinium groups decreases ΔE substantially increases first for the orthogonal 2 mutual orientation, then face to face 2, in plane, and orthogonal 1. At small separations (< 5 Å), the face to face 1, −45°, face to face 1, and face to face 1, 45°, have much lower ΔE compared with the other mutual orientations, implying that only the face to face 1 orientations can approach each other as close as 3 Å apart. For Lys the complexation energies for both mutual orientations (see SI for details) substantially increase when the distance between the diphosphated amine groups is less than 5 Å. D. Front and side view of one of the most stable 2 Arg(H2PO4)2− isomers, the face to face 1, at 45° angle offset, at 3 Å separation. Bidentate H-bonding between guanidinium and each phosphate arranges the phosphates along the planar Y-shape of the guanidinium group. The arrangement allows 2 Arg(H2PO4)2− complexes to stack at small separations. E. The most stable 2 Lys(H2PO4)2− isomer at 3 Å separation.
Results and Discussion
QM Calculations of Interactions Between Arginine and Lysine with Phosphate Groups
We use QM calculations on a minimal model (see Experimental Section) to gain insight into the interactions of Arg and Lys with phosphate groups of the lipid bilayer, and to see if qualitative differences between Arg and Lys occur at the molecular level. In contrast to expectations from qualitative arguments centering on monodentate versus bidentate H-bonding, QM calculations show that both guanidinium and amine groups favorably coordinate two phosphate groups at once (Figure 1A&B), with complexation energies in both cases of ca. 160 kcal/mol. In isolation, the observed diphosphate-guanidinium complex, stabilized by two (bidentate) H-bonds between the guanidinium group and each phosphate (Figure 1A), are not more energetically favorable than the diphosphate-amine complex, formed by single (monodentate) H-bonds between the amine group and each phosphate (Figure 1B). However, the preferred positions of the two phosphates with respect to the Arg and Lys side chains are quite different. Lys coordinates phosphates to the NH3+ group, in a way suggesting that its side chain remains perpendicular to the bilayer. However, for Arg the preferred coordination mode for the two phosphates follows the planar Y-shape of the guanidinium group,42 implying that the side chain would have to lay on its side with respect to the bilayer. Therefore, while single Lys and Arg both bind two phosphates with the same complexation energy, differences in the molecular geometries of their side chains produce distinct diphosphate coordinations which impact how they interact with phospholipid headgroups in the bilayer.
To examine how Arg and Lys coordinate phosphates when their side chains are close to one another, like in poly-Arg and poly-Lys, we determined the complexation energies for two Arg or Lys residues as a function of side chain separation and orientation. The planar Y-shape of the guanidinium group along with its bidentate H-bonding ability allows it to rigidly arrange the two phosphates along the planar shape of the group. As a consequence of this arrangement two nearby Arg side chains can still coordinate two phosphates each throughout a broad range of inter-guanidinium separations, including those characteristic of poly-R (Figure 1C). At interguanidinium separations greater than 8 Å, all studied mutual orientations of phosphated guanidinium groups are isoenergetic, whereas at smaller separations only some of the mutual orientations remain energetically feasible. Interestingly, at separations of less than 5 Å, guanidinium groups necessarily orient “face to face” with each other (stacking), and can do so with or without an offset perpendicular to the stacking direction (Figure 1D). This is especially important for ‘staggering’ of peptide-bound bulky lipid headgroups, which have typical lateral spatial extents of 7–8 Å.67,68 Conversely, the I-shape of the amine group along with its monodentate H-bonding abilities makes the situation for Lys is quite different. Two diphosphated Lys side chains cannot get closer than 7 Å to each other under any conditions, without a costly energy penalty of 20–70 kcal/mol (Figure 1C). In addition, the resultant diphosphated Lys conformations suggest that phosphates orient in a manner (Figure 1E) that prevents multiple Lys side chains from getting closer than 7 Å to each other, which is the distance that poly-Lys can exhibit in a variety of natural proteins.69 Unlike poly-Arg, where the phosphate conformations permit stacking between guanidinium groups and the complex is compact, poly-Lys would have to be distorted when interacting with multiple phosphates resulting in suboptimal packing of phospholipid headgroups. These results show that multiple guanidinium groups readily maintain and organize a diphosphate coordination over a variety of side chain separations including the small spacing characteristic of poly-Arg, while for poly-Lys the inefficient packing of diphosphated amine groups cannot do so without incurring a large energetic penalty.
Differences in the H-bonding tendencies between guanidinium groups in poly-Arg and amine groups in poly-Lys affect how these peptides interact with lipid membranes. The QM calculations show that the planar guanidinium groups of poly-Arg can each complex two phosphates by stacking (Figure 1D), while it is energetically costly for the amine groups of poly-Lys to maintain an equivalent two phosphate coordination. Guanidinium group stacking, the apparent favored configuration of Arg pairs in a variety of environmental conditions,48,70,71 allows the side groups to reorganize the local lipid headgroups by H-bonding. In poly-Arg, each membrane-bound guanidinium can H-bond with two phosphates and thereby crosslink the lipid headgroups into a large composite headgroup, effectively producing a series of stacked positive intrinsic curvature amphiphiles along the peptide chain. This stress will tend to bend the membrane toward the non-polar interior to provide greater area to accommodate the cross-linked lipid headgroups. Therefore, by stacking its constituent diphosphated guanidinium groups, poly-Arg is able to coordinate a maximal number of bulky lipid headgroups, and thereby generate positive curvature buckling along the peptide chain via lipid steric crowding interactions. Negative Gaussian membrane curvature, which is necessary for membrane permeation, requires positive curvature along one principal direction, and negative curvature along the other. Since both poly-Arg and poly-Lys can generate negative curvature perpendicular to the chain,41 the QM calculations support experimental observations that poly-Arg can generate negative Gaussian curvature, whereas poly-Lys does not.72
QM calculations provide precise atomistic insight into the complex interactions between the phosphates of lipid headgroups and guanidinium and amine groups. Small angle x-ray scattering can complement the computational data since these experiments directly measure the nanoscale membrane curvature generated by guanidinium polymers. The QM calculations suggest that guanidinium groups of poly-Arg stack “face to face” when inter-guanidinium group separations are < 5 Å. In this regime, changes in the inter-guanidinium group spacing should lead to changes in induced curvature. We explore membrane curvature generation as a function of inter-guanidinium group spacing using CPPs based on non-peptide polyguanidine-oxanorbornene homopolymers (PGONs), which are not constrained to have the same geometric inter-guanidinium spacing as those based on polypeptide backbones. We present a systematic comparison between PGON and poly-Arg in the context of their membrane interactions.
SAXS Study of PGON Polymers with Lipid Membranes
We use synchrotron small angle x-ray scattering (SAXS) to characterize the interactions of model membranes with polyguanidine-oxanorbornene homopolymers (PGONs), which have been used as molecular transporters.14,16–18 PGON polymers substantially remodel small unilamellar vesicles (SUVs) into strongly scattering liquid crystalline structures as indicated by the appearance of sharp structure factor correlation peaks shown in representative spectra for PGON polymers with average degree of polymerization <N> = 7, 18, 50 (Figure 2A). For each polymer the scattering spectra contains peaks with Q positions at ratio √2: √3: √4, evidence of the presence of Pn3m ‘double-diamond’ cubic phases. The Pn3m is a bicontinuous cubic phase composed of two nonintersecting tetrahedral water channels separated by the lipid bilayer. The midpoint of the bilayer traces out a minimal surface which has zero mean curvature and negative Gaussian curvature at every point. Geometrically, minimal surfaces locally have the shape of a saddle; the surface curves maximally upward and downward in orthogonal directions. Negative Gaussian curvature is ubiquitous in membrane permeation. It is present in the interior of toroidal pores, as well as at the base of blebs and the ‘neck’ of budding events which are topologically identical and morphologically similar to the membrane protrusions and invaginations observed in endocytic processes. For example, the surface of a lipid-lined toroidal pore has the same shape as the surface surrounding the hole in a donut. The surface curves toward the hole as the interior of the pore is traced, while moving out of the pore the surface curves away from the hole; opposite curvatures in orthogonal directions just like in a saddle (Figure S3). Because negative Gaussian curvature is necessary for all these membrane destabilization processes, the generation of saddle-splay curvature by molecular transporters is a potent way to circumvent the barrier function of cell membranes and enable uptake into cells. Interestingly, although negative Gaussian curvature on a monolayer leaflet (as in a transmembrane pore) is distinct from negative Gaussian curvature in a bilayer (as in a bud or bleb), there is strong correlation between peptide-induced membrane permeation and peptide-induced formation of cubic phases,39,40,72 which suggests that the root phenomenon of negative Gaussian membrane curvature generation by peptides can be expressed as different structural outcomes in isolated membranes under different conditions. By relating the peak Q positions to their Miller indices h, k, l, for each reflection using the equation for a powder averaged cubic phase, Qmeas = 2π√(h2+k2+l2)/a, we calculate lattice parameters aN=7 = 16.0 nm, aN=18 = 15.0 nm, and aN=50 = 18.0 nm. Cubic phases are observed in PE-rich membranes for PGONs with <N> = 7, 9, 14, 18, 27, and 50, implying that generation of negative Gaussian curvature is a general feature of PGON polymers with <N> = 7–50.
Figure 2.
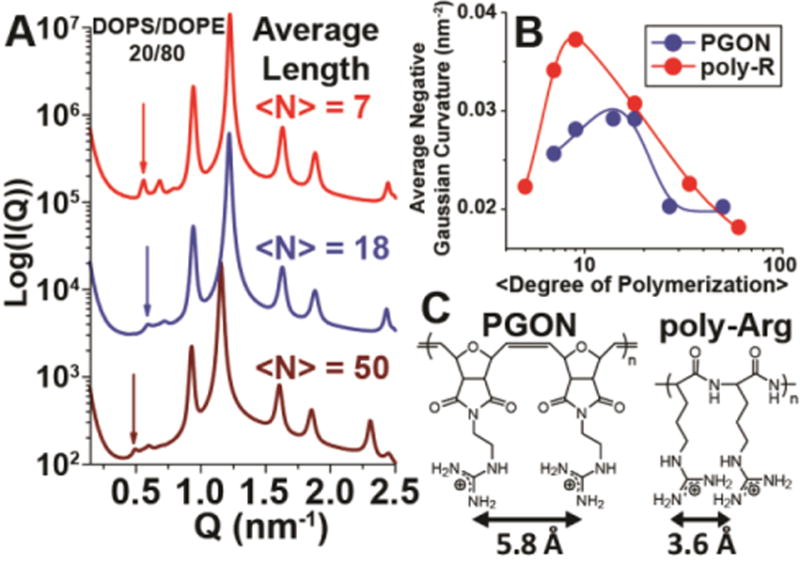
Generation of negative Gaussian curvature by guanidinium-rich polymers depends on average polymer length and average spacing between monomers. A. Representative scattering spectra of PGONs with degree of polymerization 7, 18, & 50 (top to bottom) with DOPS/DOPE = 20/80 membranes at the polymer to lipid isoelectric point. Arrows indicate the first order reflection of the Pn3m cubic phase. A first order reflection at higher Q indicates the generation of greater negative Gaussian curvature. B. Plots of polymer-induced average negative Gaussian curvature generation, |<K>|, versus polymer length for both PGON and poly-arginine. The maximum amount of |<K>| occurs around Arg9 for poly-arginine, while for PGON it is around an average degree of polymerization of 14. The lines are to guide the eye (see Methods for details). C. Schematic showing structural features of PGON and poly-arginine, and effective spacing between guanidine groups.
A non-monotonic relationship between PGON length and cubic phase lattice parameter is observed (Figure 2A&B). This is strikingly similar to the trend found for poly-Arg.39 Since the minimal surface of a cubic phase has average negative Gaussian curvature <K> = 2πχ/a2A0, where a is the measured cubic lattice parameter, χ is the Euler characteristic, and A0 is the surface area per unit cell, the measured cubic lattice parameters can be used to extract the <K> values for PGON polymers of different lengths.73 Both PGON and poly-Arg generate maximum |<K>| at intermediate polymer lengths (Figure 2B). The polymer length where maximum |<K>| occurs for poly-Arg is around Arg9, whereas for PGON the maximum is shifted outward to an average degree of polymerization of about 14. The differences in |<K>| versus polymer length must originate from the different structural properties of their backbones which necessarily influence how the guanidinium groups interact with membrane lipids.
The QM calculations presented above are consistent with the hypothesis that positive curvature generation by guanidinium group-directed lipid headgroup crowding can promote negative Gaussian curvature. This mechanism of generating positive curvature depends on a substantial degree of cooperativity, since both PGON and poly-Arg require a minimum number of guanidinium groups to induce such curvature. For example, the empirical observations that tetra-arginine, R4, induces an inverted hexagonal (HII) phase with negative mean curvature only and a minimum of 5 arginines is necessary before oligo-arginine can induce a Pn3m phase39 implies that the structural tendency to form negative curvature is stronger than that to form positive curvature in short poly-arginines. These results also suggest that two effects will progressively occur in the limit of dilute polymer to lipid molar ratios as the polymer chain length increases and thereby increases the amount of induced positive curvature. There will be a transition between inducing predominately negative membrane curvature to inducing a minimal surface with equal amounts of negative and positive curvature, or negative Gaussian curvature. The precise amount of induced negative Gaussian curvature depends on the relative amounts of positive and negative curvature generated, and achieves a maximum when the two are equal. Moreover, as the polymer length further increases, the excess induced positive curvature will interfere with generating the negative curvature component, and thereby ultimately limit the generation of negative Gaussian curvature. This is exactly what is observed (Figure 2B) since the amount of negative Gaussian curvature initially increases, achieves a maximum as the curvatures are balanced, and eventually decreases. The precise polymer length that induces the maximum amount of negative Gaussian curvature depends on molecular details such as the effective guanidinium spacing, with closer spacings inducing more lipid head crowding and thereby more negative Gaussian curvature, which can also be seen in the comparison of polyarginine and PGON.
The spacing between guanidinium groups in oxanorbornene polymers is 5.8 Å, approximately 60% larger than the 3.6 Å spacing in poly-arginine (Figure 2C). The larger spacing in PGON along with its stiffer backbone compared to poly-Arg indicate that the average distance between guanidine side chains is greater in PGON than poly-Arg.14 Not only does PGON require more guanidinium units to generate maximal negative Gaussian curvature compared to poly-Arg, the maximum average negative Gaussian curvature generated by PGON is 22% less than that for poly-Arg (Figure 2B).74 These two observations are mutually consistent. Increasing the average distance between guanidinium groups has the effect of relieving stress from molecular crowding interactions between bulky composite headgroups that generate positive membrane curvature. Since negative Gaussian curvature requires both positive and negative curvature, reducing the amount of positive curvature will impair generation of negative Gaussian curvature. Therefore, PGON polymers with larger average spacing between guanidinium groups will be less effective in generating negative Gaussian curvature compared with poly-Arg.
SAXS Study of Amphiphilic Butyl-GON & Phenyl-GON Polymers with Lipid Membranes
Many pore forming peptides such as mammalian defensins contain both arginine and hydrophobic groups.7–9 Since hydrophobicity is known to generate positive curvature49 this trend suggests that hydrophobicity might complement the cooperative positive curvature generation by guanidinium groups, and promote negative Gaussian curvature formation and membrane permeation. To examine this specific hypothesis on the role of hydrophobicity without the potentially confounding factor of facial amphiphilicity, we added hydrophobic groups to these guanidinium-rich polymers by synthesizing random copolymers consisting of guanidinium groups with either hydrophobic butyl or phenyl side chains. 6,17 SAXS experiments show that the strong induction of the Pn3m cubic phase is a general feature in the scattering spectra for both butyl-GON (Figure 3A) and phenyl-GON (Figure 3B). At peptide/lipid, P/L = 1/60 molar ratio, sharp correlation peaks at Q positions with ratios, √2: √3: √4: √6: √8: √9: √10: √11: √12, are seen for both butyl-GON and phenyl-GON. By fitting the peak Q positions to their respective reflections via linear trendlines (Figure 3C&D), we calculate Pn3m cubic lattice parameters of a = 19.4 nm for butyl-GON and a = 20.4 nm for phenyl-GON. Similar spectra are observed when the polymer concentration is doubled to P/L = 1/30 (Figure 3A&B). The cubic phase reflections shift to higher Q values, however, indicating that greater polymer concentrations induce smaller cubic lattices. At P/L = 1/30 the lattice parameters shrink to a = 14.4 nm for butyl-GON (Figure 3C) and a = 15.4 nm for phenyl-GON (Figure 3D). Since, the cubic phase lattice parameter is inversely proportional to its average negative Gaussian curvature, increasing the polymer concentration increases the amount of negative Gaussian membrane curvature, as expected for polymers which generate such curvature.
Figure 3.

Hydrophobicity increases the amount of negative Gaussian curvature that guanidinium-rich polymers generate. A. The butyl-GON polymer, <N> = 11, butyl/guanidine molar ratio = 6/5, generates Pn3m cubic phases in DOPS/DOPE = 20/80 membranes at peptide/lipid = 1/60 & 1/30 molar ratios. The arrow points to the first (110) reflection of the Pn3m, which shifts to higher Q for greater P/L ratios. B. A similar trend is observed for the phenyl-GON polymer, <N> = 11, phenyl/guanidine molar ratio = 6/5. C. &D. Calculation of the Pn3m phase lattice parameters for butyl-GON (P/L = 1/30, red, P/L = 1/60, dark red) and phenyl-GON (P/L = 1/30, blue, P/L = 1/60, dark blue). Smaller lattices are seen for greater P/L ratios. E. Average negative Gaussian curvature, |<K>|, versus polymer/lipid charge ratios for polymers of similar charges and sizes. The hydrophobic butyl-GON and phenyl-GON induce greater |<K>| than the hydrophilic PGONs.
We plot the average negative Gaussian curvature over a range of peptide to lipid ratios for polymers with similar lengths and net charge (Figure 3E), to directly compare their abilities to generate curvature. Interestingly, |<K>| seems to increase linearly with polymer concentration over the range tested. Furthermore, while butyl-GON and phenyl-GON generate roughly equivalent amounts of |<K>|, both amphiphilic polymers consistently generate more |<K>| than the <N> = 7, 9 PGON polymers. Therefore, the net effect of adding hydrophobicity to guanidinium-rich polymers is to increase the amount of negative Gaussian membrane curvature they induce.
Characterizing the effects of lipid composition on the curvature generating abilities of these guanidinium-rich polymers can elucidate their specific membrane permeating activities. To do this, we use DOPS/DOPE/DOPC lipid compositions to perform a phase diagram study of polymer-lipid interactions. By changing the relative amounts of zwitterionic DOPC (spontaneous curvature, c0 = 0) and DOPE (c0 < 0) while holding constant the amount of anionic DOPS (c0 = 0) the amount of negative spontaneous curvature lipids in the membrane can be varied at constant membrane charge density. In DOPS/DOPE/DOPC = 20/70/10 membranes at P/L = 1/30, both butyl-GON and phenyl-GON generate Pn3m cubic phases with lattice parameters a = 20.5 nm and a = 20.0 nm, respectively (Figure 4A). These cubic lattices are larger than the ones for both polymers in 80% PE membranes, demonstrating that negative Gaussian curvature is more difficult to generate in membranes with lowered concentrations of DOPE lipids. Further reducing the amount of negative spontaneous curvature lipids to 60% DOPE suppresses cubic phase generation for both amphiphilic polymers (Figure 4B&C). Instead, pure lamellar phases are observed which consist of stacks of flat membranes with zero curvature. Comparing the phase diagrams for butyl-GON (Figure 4B) and phenyl-GON (Figure 4C) with the phase diagrams for <N> = 7 and 9, PGON (Figure 4D&E, and Figure S4) shows that, in general, the addition of hydrophobicity into guanidinium-rich polymers promotes saddle-splay curvature generation. Cubic phases are observed over a wider region of the phase diagram for the amphiphilic polymers, and the amphiphiles require less membrane PE content to generate negative Gaussian curvature. Clearly, adding hydrophobicity to guanidinium-rich polymers can lead to a large enhancement of their negative Gaussian curvature generation abilities. While polymers with guanidinium decorated monomers generally induce both positive and negative curvature in the two principal directions, the relative amounts of each type of curvature is in general not equal. Since incorporating hydrophobicity into PGON polymers enhances their ability to generate negative Gaussian curvature, this implies that short PGON polymers tend to induce less positive curvature than negative curvature. Supplying additional positive curvature via hydrophobicity effectively makes up the difference resulting in an amphiphilic polymer with better membrane destabilizing activity. This is consistent with our previously reported saddle-splay curvature selection rules for cell-penetrating peptides39 and antimicrobial peptides,40 because in the extreme case of positive curvature starved polymers such as poly-lysine which generate negative curvature only,72 even greater amounts of hydrophobicity will be required to optimize saddle-splay curvature generation. Therefore, while lipid headgroup coordination by poly-guanidinium polymers can be a sufficient condition for generating positive curvature strain and therefore saddle-splay curvature, it can be enhanced by additional positive curvature strain from hydrophobicity. The addition of hydrophobicity, however, will in general make the membrane activity less specific in a broad range of peptides.75–77 The curvature generating mechanism from hydrophobic insertion is inherently less specific than that from headgroup organization via cationic amino acids, since the latter interacts with headgroup chemistry, while the former interacts with the interior of the membrane.
Figure 4.
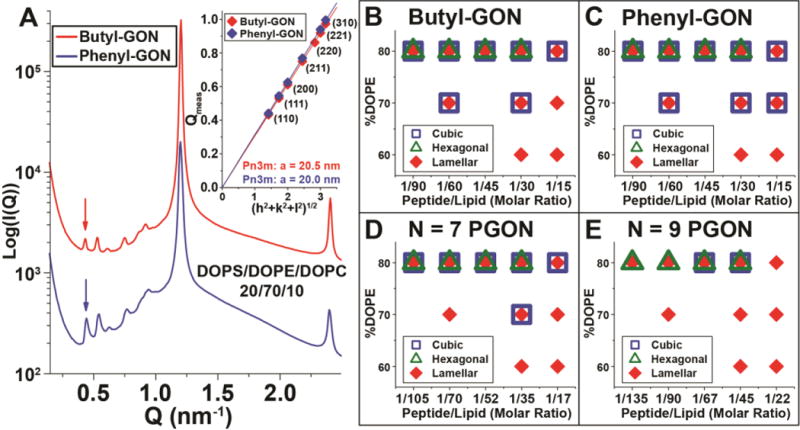
Hydrophobicity broadens the range of lipid compositions where guanidinium-rich polymers induce negative Gaussian curvature. A. At P/L = 1/30, amphiphilic butyl-GON and phenyl-GON polymers both generate Pn3m cubic phases in membranes with reduced amounts of negative spontaneous curvature lipids, DOPS/DOPE/DOPC = 20/70/10. Inset shows indexation of the Pn3m cubic for both polymers. B–E. Phase diagrams for guanidinium-rich polymers over a range of lipid compositions, DOPS/DOPE/DOPC = 20/x/(80-x) where x = %DOPE, and peptide/lipid ratios. The amphiphilic butyl-GON and phenyl-GON polymers generate cubic phases over a larger region of the phase diagram compared with the hydrophilic PGON polymers.
Biological Activity of PGON, Butyl-GON, & Phenyl-GON Polymers
These design rules are evident in the biological activity of these polymers. Table 1 shows the hemolysis values for human red blood cells (RBC) along with the antibacterial activity against a gram-positive (S. aureus) and a gram-negative (E. coli) bacteria for a series of PGON-based polymers. Comparing the HC50 values of the four polymers shows that the two PGON samples have higher values compared to the two samples designed with positive curvature generating components via hydrophobicity. Typically, the HC50 tracks most closely with membrane activity since the RBC is a non-dividing cell type and the assay measures leakage of hemoglobin.78 The antibacterial activity of the four polymer samples is similar and comparable to known antimicrobial peptides like Magainin. Understanding this activity is more complicated since the MIC is not a direct measure of membrane activity.79 For example, it was shown previously that PGON is not strongly membrane active, yet displays MIC values in the range of 6–50 μg/mL.64 Using simple dye release assays (Figure S5), a similar trend is observed for these polymers in which the butyl-GON polymer induces more dye release than any of the PGON derivatives. Consistent with this we recently showed that incorporation of hydrophobic moieties into cell-penetrating peptides can change how they interact with membranes.39 For example, while hydrophilic Arg6 (R6) crossed membranes via a rapid translocation mechanism, the addition of a single tryptophan into the peptide (R6W) was sufficient to induce slow dye leakage from intact vesicles. This change in behavior implies that incorporating hydrophobicity into hydrophilic peptides and polymers like poly-R and PGON can help to stabilize pore formation and increase membrane activity.
Table 1.
Activity against human erythrocytes, S. aureus, and E. coli.
| Polymer | HC50 (ug/mL) | MIC (ug/mL) | |
|---|---|---|---|
| S. aureas | E. coli | ||
| P(GON)7 | 600 | 15 | 25 |
| P(GON)11 | >750 | 25 | 25 |
| P(Ph-r-GON)11 | 30 | 15 | 25 |
| P(Bu-r-GON)11 | 45 | 20 | 25 |
Our results raise the possibility of a mechanistic trade-off between activity from membrane disruption, and translocation across the membrane leading to activity from binding intracellular targets. As shown above, hydrophobicity enhances saddle-splay curvature generation and therefore membrane activity, so association with cell membranes in the form of a stable pore inhibits an amphiphilic antimicrobial from reaching the cell interior. This implies that strong membrane activity may come at the expense of other forms of activity such as binding to intracellular targets. While hydrophilic guanidinium-rich polymers also generate sufficient saddle-splay curvature to permeate cell membranes, their membrane activity is reduced compared to their more hydrophobic counterparts. However, this decreases their likelihood of getting sequestered in the membrane, and upon crossing it, they are free to interact with intracellular targets and exact activity by inhibiting metabolic processes.
Conclusion
In summary we have shown that synthetic polyguanidine-oxanorbornene homopolymers, (PGONs), and amphiphilic phenyl-guanidine and butyl-guanidine random copolymers all generate saddle-splay curvature in membranes enriched with anionic lipids and negative spontaneous curvature lipids. QM calculations of the interactions of Arg with phosphate groups showed that guanidinium groups can coordinate two phosphates down to separations characteristic of poly-Arg via stacking adjacent diphosphated guanidinium complexes. Conversely, for Lys, two diphosphated amino groups cannot get closer than 7 Å without incurring a large energetic penalty. The stacking arrangement allows guanidinium-rich polymers to efficiently pack lipid headgroups, leading to steric crowding effects which generate positive curvature. This appears to be a key feature in its ability to organize lipid headgroups via H-bonding. Consistent with this result, poly-Arg and PGON generated saddle-splay curvature. The amount of curvature generated by PGON polymers was shown to be length dependent with maximal saddle-splay curvature generation occurring at intermediate polymer lengths, similar to the trend observed for poly-Arg. However, in general, PGON generated less saddle-splay curvature than poly-Arg, and the polymer length that maximized saddle-splay curvature generation for PGON was longer than for poly-Arg. This occurs because the larger spacing between guanidine side chains in PGON and its stiffer backbone lessen the positive curvature strain due to guanidinium group-coordinated steric crowding effects, and supplying more guanidinium groups via longer PGON polymers only partially compensates.
Different positive curvature producing mechanisms can be combined to enhance negative Gaussian curvature, since incorporation of hydrophobic butyl and phenyl groups into guanidinium-rich polymers increased the amounts of saddle-splay curvature they generate as well as broadened the range of lipid compositions over which it was observed. This implies that adding hydrophobicity to guanidinium-rich polymers can enhance their saddle-splay curvature generating abilities by supplying additional positive curvature to help balance the unequal amounts of positive and negative curvature produced by certain guanidinium group spacings and polymer lengths. For 5:6 guanidine:hydrophobe polymers negligible differences between the curvature generating abilities of the hydrophobic butyl and phenyl moieties were observed. We believe that these results provide engineering guidelines for designing membrane-active molecules with specific curvature generating properties which control their pore forming activities.
Supplementary Material
Acknowledgments
We dedicate this paper to the memory of Dr. Hiro Tsuruta. X-ray research was carried out at the Stanford Synchrotron Radiation Lightsource, a Directorate of SLAC National Accelerator Laboratory and an Office of Science User Facility operated for the U.S. Department of Energy Office of Science by Stanford University, the Advance Light Source supported by the Director, Office of Science, Office of Basic Energy Sciences, of the U.S. DOE under Contract No. DE-AC02-05CH11231, and at the UCLA CNSI. We thank N. Nayyar and K. Zhang for help with MIC and HC50 assays.
Funding Sources
This work is supported by NIH grant 1UO1 AI082192-01 and NSF grants DMR1106106, and DARPA Young Faculty Award N66001-11-1-4138.
ABBREVIATIONS
- QM
Quantum Mechanical
- MD
Molecular Dynamics
- SAXS
Small Angle X-ray Scattering
- Arg or R
Arginine
- Lys or K
Lysine
- CPP
Cell-Penetrating Peptide
- AMP
Antimicrobial Peptide
- PGON
Polyguanidine-Oxanorbornene Homopolymer
- Butyl-GON
Butyl Guanidine-Oxanorbornene Random Copolymer
- Phenyl-GON
Phenyl Guanidine-Oxanorbornene Random Copolymer
Footnotes
Details of the computational setup including the found isomers for the complex of Arg with a single phosphate group, the system preparation for dimer simulations, and the geometric setup for the 2Arg system, phase diagrams of PGON polymers used in this study, fractional dye release from vesicles treated with PGON and butyl-GON polymers, detailed polymer synthesis procedures, and complete ref 62. This material is available free of charge via the Internet at http://pubs.acs.org.
References
- 1.Vivès E, Brodin P, Lebleu B. J Biol Chem. 1997;272:16010–17. doi: 10.1074/jbc.272.25.16010. [DOI] [PubMed] [Google Scholar]
- 2.Futaki S, Suzuki T, Ohashi W, Yagami T, Tanaka S, Ueda K, Sugiura Y. J Biol Chem. 2001;276:5836–40. doi: 10.1074/jbc.M007540200. [DOI] [PubMed] [Google Scholar]
- 3.El-Sayed A, Futaki S, Harashima H. AAPS J. 2009;11:13–22. doi: 10.1208/s12248-008-9071-2. [DOI] [PMC free article] [PubMed] [Google Scholar]
- 4.Wender PA, Galliher WC, Goun EA, Jones LR, Pillow TH. Adv Drug Delivery Rev. 2008;60:452–72. doi: 10.1016/j.addr.2007.10.016. [DOI] [PMC free article] [PubMed] [Google Scholar]
- 5.Torchilin VP, Rammohan R, Weissig V, Levchenko TS. Proc Natl Acad Sci U S A. 2001;98:8786–91. doi: 10.1073/pnas.151247498. [DOI] [PMC free article] [PubMed] [Google Scholar]
- 6.Lewin M, Carlesso N, Tung C-H, Tang X-W, Cory D, Scadden DT, Weissleder R. Nat Biotechnol. 2000;18:410–14. doi: 10.1038/74464. [DOI] [PubMed] [Google Scholar]
- 7.Ganz T. Nat Rev Immunol. 2003;3:710–20. doi: 10.1038/nri1180. [DOI] [PubMed] [Google Scholar]
- 8.Lehrer RI. Nat Rev Microbiol. 2004;2:727–38. doi: 10.1038/nrmicro976. [DOI] [PubMed] [Google Scholar]
- 9.Selsted ME, Ouellette AJ. Nat Immunol. 2005;6:551–57. doi: 10.1038/ni1206. [DOI] [PubMed] [Google Scholar]
- 10.Wender PA, Mitchell DJ, Pattabiraman K, Pelkey ET, Steinman L, Rothbard JB. Proc Natl Acad Sci U S A. 2000;97:13003–08. doi: 10.1073/pnas.97.24.13003. [DOI] [PMC free article] [PubMed] [Google Scholar]
- 11.Mitchell DJ, Steinman L, Kim DT, Fathman CG, Rothbard JB. J Pept Res. 2000;56:318–25. doi: 10.1034/j.1399-3011.2000.00723.x. [DOI] [PubMed] [Google Scholar]
- 12.Rothbard JB, Kreider E, VanDeusen CL, Wright L, Wylie BL, Wender PA. J Med Chem. 2002;45:3612–18. doi: 10.1021/jm0105676. [DOI] [PubMed] [Google Scholar]
- 13.Cooley CB, Trantow BM, Nederberg F, Kiesewetter MK, Hedrick JL, Waymouth RM, Wender PA. J Am Chem Soc. 2009;131:16401–03. doi: 10.1021/ja907363k. [DOI] [PMC free article] [PubMed] [Google Scholar]
- 14.Hennig A, Gabriel GJ, Tew GN, Matile S. J Am Chem Soc. 2008;130:10338–44. doi: 10.1021/ja802587j. [DOI] [PMC free article] [PubMed] [Google Scholar]
- 15.Kolonko EM, Kiessling LL. J Am Chem Soc. 2008;130:5626–27. doi: 10.1021/ja8001716. [DOI] [PMC free article] [PubMed] [Google Scholar]
- 16.Som A, Reuter A, Tew GN. Angew Chem Int Ed. 2012;51:980–83. doi: 10.1002/anie.201104624. [DOI] [PubMed] [Google Scholar]
- 17.Som A, Tezgel AO, Gabriel GJ, Tew GN. Angew Chem Int Ed. 2011;50:6147–50. doi: 10.1002/anie.201101535. [DOI] [PubMed] [Google Scholar]
- 18.Tezgel AOzl, Telfer JC, Tew GN. Biomacromolecules. 2011;12:3078–83. doi: 10.1021/bm200694u. [DOI] [PubMed] [Google Scholar]
- 19.Wender PA, Rothbard JB, Jessop TC, Kreider EL, Wylie BL. J Am Chem Soc. 2002;124:13382–83. doi: 10.1021/ja0275109. [DOI] [PubMed] [Google Scholar]
- 20.Wender PA, Kreider E, Pelkey ET, Rothbard J, VanDeusen CL. Org Lett. 2005;7:4815–18. doi: 10.1021/ol051496y. [DOI] [PubMed] [Google Scholar]
- 21.Elson-Schwab L, Garner OB, Schuksz M, Crawford BE, Esko JD, Tor Y. J Biol Chem. 2007;282:13585–91. doi: 10.1074/jbc.M700463200. [DOI] [PubMed] [Google Scholar]
- 22.Rothbard JB, Jessop TC, Wender PA. Adv Drug Delivery Rev. 2005;57:495–504. doi: 10.1016/j.addr.2004.10.003. [DOI] [PubMed] [Google Scholar]
- 23.Rothbard JB, Jessop TC, Lewis RS, Murray BA, Wender PA. J Am Chem Soc. 2004;126:9506–07. doi: 10.1021/ja0482536. [DOI] [PubMed] [Google Scholar]
- 24.Drin G, Déméné H, Temsamani J, Brasseur R. Biochemistry. 2001;40:1824–34. doi: 10.1021/bi002019k. [DOI] [PubMed] [Google Scholar]
- 25.Iwasa A, Akita H, Khalil I, Kogure K, Futaki S, Harashima H. Biochim Biophys Acta, Biomembr. 2006;1758:713–20. doi: 10.1016/j.bbamem.2006.04.015. [DOI] [PubMed] [Google Scholar]
- 26.Maiolo JR, Ferrer M, Ottinger EA. Biochim Biophys Acta, Biomembr. 2005;1712:161–72. doi: 10.1016/j.bbamem.2005.04.010. [DOI] [PubMed] [Google Scholar]
- 27.Persson D, Thorén PEG, Herner M, Lincoln P, Nordén B. Biochemistry. 2002;42:421–29. doi: 10.1021/bi026453t. [DOI] [PubMed] [Google Scholar]
- 28.Ter-Avetisyan G, Tünnemann G, Nowak D, Nitschke M, Herrmann A, Drab M, Cardoso MC. J Biol Chem. 2009;284:3370–78. doi: 10.1074/jbc.M805550200. [DOI] [PMC free article] [PubMed] [Google Scholar]
- 29.Thorén PEG, Persson D, Lincoln P, Nordén B. Biophys Chem. 2005;114:169–79. doi: 10.1016/j.bpc.2004.11.016. [DOI] [PubMed] [Google Scholar]
- 30.Drin G, Cottin S, Blanc E, Rees AR, Temsamani J. J Biol Chem. 2003;278:31192–201. doi: 10.1074/jbc.M303938200. [DOI] [PubMed] [Google Scholar]
- 31.Nakase I, Niwa M, Takeuchi T, Sonomura K, Kawabata N, Koike Y, Takehashi M, Tanaka S, Ueda K, Simpson JC, Jones AT, Sugiura Y, Futaki S. Mol Ther. 2004;10:1011–22. doi: 10.1016/j.ymthe.2004.08.010. [DOI] [PubMed] [Google Scholar]
- 32.Richard JP, Melikov K, Brooks H, Prevot P, Lebleu B, Chernomordik LV. J Biol Chem. 2005;280:15300–06. doi: 10.1074/jbc.M401604200. [DOI] [PubMed] [Google Scholar]
- 33.Richard JP, Melikov K, Vives E, Ramos C, Verbeure B, Gait MJ, Chernomordik LV, Lebleu B. J Biol Chem. 2003;278:585–90. doi: 10.1074/jbc.M209548200. [DOI] [PubMed] [Google Scholar]
- 34.Wadia JS, Stan RV, Dowdy SF. Nat Med. 2004;10:310–15. doi: 10.1038/nm996. [DOI] [PubMed] [Google Scholar]
- 35.Ziegler A. Adv Drug Delivery Rev. 2008;60:580–97. doi: 10.1016/j.addr.2007.10.005. [DOI] [PubMed] [Google Scholar]
- 36.Gump JM, Dowdy SF. Trends Mol Med. 2007;13:443–48. doi: 10.1016/j.molmed.2007.08.002. [DOI] [PubMed] [Google Scholar]
- 37.Guterstam P, Madani F, Hirose H, Takeuchi T, Futaki S, El Andaloussi S, Gräslund A, Langel Ü. Biochim iophys Acta, Biomembr. 2009;1788:2509–17. doi: 10.1016/j.bbamem.2009.09.014. [DOI] [PubMed] [Google Scholar]
- 38.Heitz F, Morris MC, Divita G. Br J Pharmacol. 2009;157:195–206. doi: 10.1111/j.1476-5381.2009.00057.x. [DOI] [PMC free article] [PubMed] [Google Scholar]
- 39.Mishra A, Lai GH, Schmidt NW, Sun VZ, Rodriguez AR, Tong R, Tang L, Cheng J, Deming TJ, Kamei DT, Wong GCL. Proc Natl Acad Sci USA. 2011;108:16883–88. doi: 10.1073/pnas.1108795108. [DOI] [PMC free article] [PubMed] [Google Scholar]
- 40.Schmidt NW, Mishra A, Lai GH, Davis M, Sanders LK, Tran D, Garcia A, Tai KP, McCray PB, Ouellette AJ, Selsted ME, Wong GCL. J Am Chem Soc. 2011;133:6720–27. doi: 10.1021/ja200079a. [DOI] [PMC free article] [PubMed] [Google Scholar]
- 41.Schmidt N, Mishra A, Lai GH, Wong GCL. FEBS Lett. 2010;584:1806–13. doi: 10.1016/j.febslet.2009.11.046. [DOI] [PubMed] [Google Scholar]
- 42.Schug KA, Lindner W. Chem Rev. 2004;105:67–114. doi: 10.1021/cr040603j. [DOI] [PubMed] [Google Scholar]
- 43.By ‘active’ membrane permeation, we mean the molecular transporter actively promotes its uptake by locally perturbing and restructuring the cell membrane in a way that facilitates its entry. Uptake of molecular transporters can occur by endocytosis or direct translocation and may or may not involve ATP. This is distinct from ‘passive’ membrane permeation, which refers to the conventional diffusion processes used by small lipophilic drugs where the drug enters cells by passing through the membrane. In this article membrane permeation means active membrane permeation.
- 44.Conner SD, Schmid SL. Nature. 2003;422:37–44. doi: 10.1038/nature01451. [DOI] [PubMed] [Google Scholar]
- 45.Braun AR, Sevcsik E, Chin P, Rhoades E, Tristram-Nagle S, Sachs JN. J Am Chem Soc. 2012;134:2613–20. doi: 10.1021/ja208316h. [DOI] [PMC free article] [PubMed] [Google Scholar]
- 46.Pednekar D, Tendulkar A, Durani S. Proteins: Struct, Funct, Bioinf. 2009;74:155–63. doi: 10.1002/prot.22142. [DOI] [PubMed] [Google Scholar]
- 47.Papoian GA, Ulander J, Eastwood MP, Luthey-Schulten Z, Wolynes PG. Proc Natl Acad Sci U S A. 2004;101:3352–57. doi: 10.1073/pnas.0307851100. [DOI] [PMC free article] [PubMed] [Google Scholar]
- 48.Yuzlenko O, Lazaridis T. J Phys Chem B. 2011;115:13674–84. doi: 10.1021/jp2052213. [DOI] [PMC free article] [PubMed] [Google Scholar]
- 49.McMahon HT, Gallop JL. Nature. 2005;438:590–96. doi: 10.1038/nature04396. [DOI] [PubMed] [Google Scholar]
- 50.Matsuzaki K, Sugishita K-i, Ishibe N, Ueha M, Nakata S, Miyajima K, Epand RM. Biochemistry. 1998;37:11856–63. doi: 10.1021/bi980539y. [DOI] [PubMed] [Google Scholar]
- 51.Parr RG, Yang W. Density-functional theory of atoms and molecules. Oxford Univ. Press; Oxford: 1989. [Google Scholar]
- 52.Becke AD. J Chem Phys. 1993;98:5648–52. [Google Scholar]
- 53.Perdew JP, Chevary JA, Vosko SH, Jackson KA, Pederson MR, Singh DJ, Fiolhais C. Phys Rev B. 1992;46:6671–87. doi: 10.1103/physrevb.46.6671. [DOI] [PubMed] [Google Scholar]
- 54.Clark T, Chandrasekhar J, Spitznagel GW, Schleyer PVR. J Comput Chem. 1983;4:294–301. [Google Scholar]
- 55.Frisch MJ, Pople JA, Binkley SJ. J Chem Phys. 1984;80:3265–69. [Google Scholar]
- 56.Head-Gordon M, Pople JA, Frisch MJ. Chem Phys Lett. 1988;153:503–06. [Google Scholar]
- 57.Frisch MJ, Head-Gordon M, Pople JA. Chem Phys Lett. 1990;166:275–80. [Google Scholar]
- 58.Frisch MJ, Head-Gordon M, Pople JA. Chem Phys Lett. 1990;166:281–89. [Google Scholar]
- 59.Tubert-Brohman I, Guimarães CRW, Repasky MP, Jorgensen WL. J Comput Chem. 2004;25:138–50. doi: 10.1002/jcc.10356. [DOI] [PubMed] [Google Scholar]
- 60.Repasky MP, Chandrasekhar J, Jorgensen WL. J Comput Chem. 2002;23:1601–22. doi: 10.1002/jcc.10162. [DOI] [PubMed] [Google Scholar]
- 61.Jorgensen WL, Ulmschneider JP, Tirado-Rives J. J Phys Chem B. 2004;108:16264–70. [Google Scholar]
- 62.Frisch MJ, et al. Gaussian 09, Revision A.1. Gaussian, Inc.; Wallingford CT: 2009. [Google Scholar]
- 63.Jorgensen WL, Tirado–Rives J. J Comput Chem. 2005;26:1689–700. doi: 10.1002/jcc.20297. [DOI] [PubMed] [Google Scholar]
- 64.Gabriel GJ, Madkor AE, Dabkowski JM, Nelson CF, Nüsslein K, Tew GN. Biomacromolecules. 2008;9:2980–83. doi: 10.1021/bm800855t. [DOI] [PMC free article] [PubMed] [Google Scholar]
- 65.usaxs.xor.aps.anl.gov/staff/ilavsky/nika.html.
- 66.www.esrf.eu/computing/scientific/FIT2D/.
- 67.Harper PE, Mannock DA, Lewis RNAH, McElhaney RN, Gruner SM. Biophys J. 2001;81:2693–706. doi: 10.1016/S0006-3495(01)75912-7. [DOI] [PMC free article] [PubMed] [Google Scholar]
- 68.Tristram-Nagle S, Petrache HI, Nagle JF. Biophys J. 1998;75:917–25. doi: 10.1016/S0006-3495(98)77580-0. [DOI] [PMC free article] [PubMed] [Google Scholar]
- 69.Homchaudhuri L, Swaminathan R. Bull Chem Soc Jpn. 2004;77:765–69. [Google Scholar]
- 70.Vondrášek Jí, Mason PE, Heyda J, Collins KD, Jungwirth P. J Phys Chem B. 2009;113:9041–45. doi: 10.1021/jp902377q. [DOI] [PubMed] [Google Scholar]
- 71.No KT, Nam K-Y, Scheraga HA. J Am Chem Soc. 1997;119:12917–22. [Google Scholar]
- 72.Mishra A, Gordon V, Yang L, Coridan R, Wong G. Angew Chem, Int Ed. 2008;47:2986–89. doi: 10.1002/anie.200704444. [DOI] [PubMed] [Google Scholar]
- 73.Harper PE, Gruner SM. Eur Phys J E: Soft Matter Biol Phys. 2000;2:217–28. [Google Scholar]
- 74.To calculate the percent reduction we used the formula above which relates the measured cubic phase lattice parameter to the average negative Gaussian curvature of the minimal surface. For simplicity we compared the maximum measured average negative Gaussian curvature, |<K>|, generated by poly-R and PGON. This occurred at <N> = 9 for poly-R with value |<K>|polyRmax = 0.37 nm−2, at <N> = 18 for PGON with value |<K>|PGONmax = 0.29 nm−2. Percent reduction = (|<K>|polyRmax − |<K>|PGONmax)/ |<K>|polyRmax.
- 75.Yeaman MR, Yount NY. Pharmacol Rev. 2003;55:27–55. doi: 10.1124/pr.55.1.2. [DOI] [PubMed] [Google Scholar]
- 76.Tew GN, Scott RW, Klein ML, DeGrado WF. Acc Chem Res. 2009;43:30–39. doi: 10.1021/ar900036b. [DOI] [PMC free article] [PubMed] [Google Scholar]
- 77.Tossi A, Sandri L, Giangaspero A. Pept Sci. 2000;55:4–30. doi: 10.1002/1097-0282(2000)55:1<4::AID-BIP30>3.0.CO;2-M. [DOI] [PubMed] [Google Scholar]
- 78.Fischer D, Li Y, Ahlemeyer B, Krieglstein J, Kissel T. Biomaterials. 2003;24:1121–31. doi: 10.1016/s0142-9612(02)00445-3. [DOI] [PubMed] [Google Scholar]
- 79.Epand RF, Mowery BP, Lee SE, Stahl SS, Lehrer RI, Gellman SH, Epand RM. J Mol Biol. 2008;379:38–50. doi: 10.1016/j.jmb.2008.03.047. [DOI] [PubMed] [Google Scholar]
Associated Data
This section collects any data citations, data availability statements, or supplementary materials included in this article.