Abstract
The current RIKEN transcript set represents a significant proportion of the mouse transcriptome but transcripts expressed in the innate and acquired immune systems are poorly represented. In the present study we have assessed the complexity of the transcriptome expressed in mouse macrophages before and after treatment with lipopolysaccharide, a global regulator of macrophage gene expression, using existing RIKEN 19K arrays. By comparison to array profiles of other cells and tissues, we identify a large set of macrophage-enriched genes, many of which have obvious functions in endocytosis and phagocytosis. In addition, a significant number of LPS-inducible genes were identified. The data suggest that macrophages are a complex source of mRNA for transcriptome studies. To assess complexity and identify additional macrophage expressed genes, cDNA libraries were created from purified populations of macrophage and dendritic cells, a functionally related cell type. Sequence analysis revealed a high incidence of novel mRNAs within these cDNA libraries. These studies provide insights into the depths of transcriptional complexity still untapped amongst products of inducible genes, and identify macrophage and dendritic cell populations as a starting point for sampling the inducible mammalian transcriptome.
The elucidation of mammalian genome sequences (Lander et al. 2001; Venter et al. 2001; Waterston et al. 2002) represents a significant step forward in our understanding of the basis of life. Central to this improved understanding is the need for a complete description of the mammalian transcriptome together with the proteome it encodes. Attempts so far to define the transcriptome computationally are likely to have resulted in an underestimation of the true number of transcribed sequences (Hogenesch et al. 2001; Kapranov et al. 2002). cDNA-based surveys, such as the RIKEN mouse gene encyclopaedia project (Kawai et al. 2001; Okazaki et al. 2002), currently represent the approach most likely to reveal the true extent of the transcriptome.
The ultimate success of this approach is still dependent on the selection of tissues/cell types chosen to survey. Many transcripts will only be expressed in certain tissues, at specific time points, or in response to particular stimuli. This constraint is particularly relevant to cells of the immune system, and as a consequence many known, inducible immune response genes are poorly represented in the public EST databases (Staudt and Brown 2000).
Macrophages and dendritic cells (DC) are related cell types with many unique functions in innate and acquired immunity, one of which is the presentation of antigen, together with costimulatory signals, to initiate T cell responses to pathogen. The function of both cell types is acutely regulated by many stimuli, with activation often being associated with extensive remodeling of their transcriptomes (Hashimoto et al. 2000; Ehrt et al. 2001; Ravasi et al. 2002). One of the most studied regulators of macrophage function is bacterial lipopolysaccharide (LPS), with more than 500 known, LPS-inducible genes being currently documented (Hume et al. 2002). The RIKEN mouse gene encyclopaedia represents the most extensive collection of mouse transcription units assembled to date (Kawai et al. 2001; Okazaki et al. 2002). It currently comprises 37,086 transcription units made up from 60,770 full-length clones (Okazaki et al. 2002). Despite this depth of coverage, a survey of its content reveals low representation of known macrophage/DC-expressed or LPS-inducible genes amongst the cDNAs sampled in Phase 1 (EST) sequencing.
In the present study, we have assessed the complexity of the mouse transcriptome expressed in macrophages before and after LPS stimulation using existing RIKEN 19K microarrays. Additionally, given the low representation of known macrophage/DC-expressed genes in the current RIKEN set, we have looked for additional genes by creating cDNA libraries from purified macrophage and DC populations.
RESULTS AND DISCUSSION
The Macrophage Transcriptome
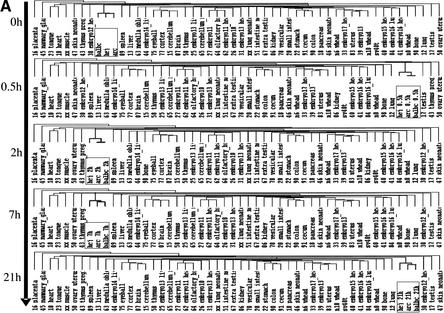
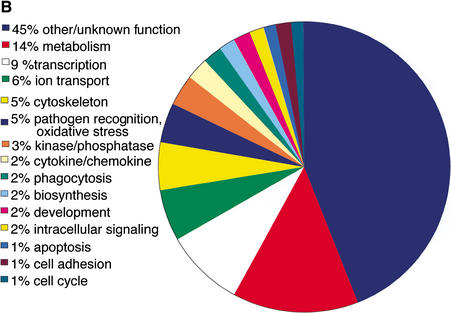
To assess the complexity of the transcriptome expressed in macrophages, RNA was extracted from primary bone marrow-derived macrophages cultured in the presence or absence of LPS and hybridized in duplicate to RIKEN 19K microarrays. Because of the diversity in macrophage function that is known to exist between mouse strains, and to provide additional power to the clustering, we used three different strains. We also examined multiple time points to assess the temporal cascade and assess the optimal time for cDNA library construction (see below). To permit comparison with other tissues studied in the RIKEN Expression Array Database, all hybridizations were performed using 17.5dpc C57Bl/6J whole-embryo RNA as a reference. Following normalization, the gene expression data obtained was clustered together with data obtained from 49 other tissues (Miki et al. 2001) and the results are shown in Figure 1A. The mouse strains segregated on genotype, based on LPS responsiveness, however, when compared to the other tissues, the macrophage arrays formed a distinct cluster. This cluster provides a transcriptional marker of macrophage identity that is independent of the genotype, or state of activation of the macrophages. While the transcripts associated with this cluster (listed in Supplementary Table 1) were not unique to macrophages, the cluster contains 347 genes known to be enriched in cells of this lineage. The majority of these 347 genes have obvious functions, such as endocytosis and phagocytosis (e.g., the lysozyme cathepsin S; the actin binding protein Coronin; and the proteolytic enzyme macropain), cytokines and chemokines (e.g., CXC type chemokines) and myeloid lineage markers such as CD34. The GO annotated functions of this set are described in Figure 1B.
Figure 1.
(A) Comparison of BMM expression profiles during a LPS time-series with the READ mouse tissues expression profiles database on the RIKEN 19,000 element cDNA arrays. The expression profiles of 49-mouse tissue from different developmental stages are compared in hierarchical matter with the expression profiles of BMM from three different mouse strains (BALB/c, C3H/ARC, and C2H/HeJ). The picture shows the experiment trees generated using the unsupervised hierarchical clustering algorithm from GeneSpring4.2 (SiliconGenetics Inc.).
(B) Annotation of the 347 macrophage-enriched genes. The ontology pie was based on the RIKEN clone annotation, curated by the Functional Annotation of Mouse Genome consortium (FANTOM). Further information regarding these genes can be found in Supplementary Table 1.
Table 1.
Characterization of Sequence Data Obtained from LPS-Stimulated Macrophage- and Dendritic Cell-Derived cDNA Libraries
| Clusters (#ESTs) | Singleton ESTs | |
|---|---|---|
| All reads | — | 64,552 |
| Unique sequences | 6352 (48,345) | 16,177 |
| Match “known” genea | 4284 (35,221) | — |
| No match to “known” genea | 2068 (13,124) | 16,177 |
| Match FANTOM2 | 1252 (6,202) | 2874 |
| No match to FANTOM2 | 816 (6,922) | 13,303 |
| Match TIGR MGI | 1583 (11,784) | 5585 |
| Novel unknown sequence | 485 (1,340) | 10,592 |
| —hitting the mouse genome | 206 (576) | 1891 |
| —hitting the human genome | 143 (375) | 2023 |
| —hitting both human & mouse | 50 (127) | 551 |
The known gene set comprised 48,137 nonredundant sequences from GenBank
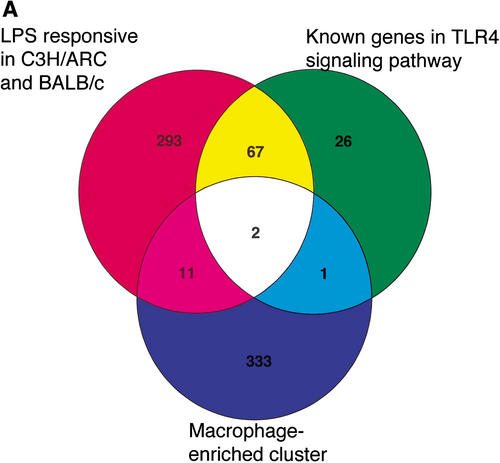
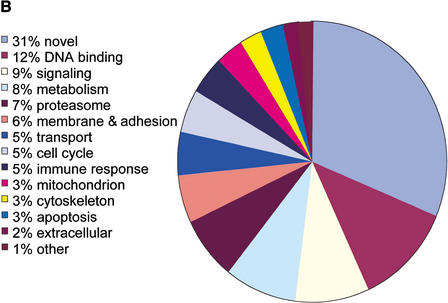
Stimulation with LPS led to a remodeling of macrophage gene expression, and 373 probes were LPS-inducible in the LPS responsive strains, BALB/c and C3H/ARC, but not the hyporesponsive C3H/HeJ strain (Fig. 2, Suppl. Table 2). Interestingly, the majority (86%) of LPS-inducible transcripts were not restricted to the macrophage-enriched set (Fig. 2A). Most of the LPS-responsive probes have no annotated function, but those that could be classified were consistent with a role in macrophage activation, for example, 18% could be classified as playing a role in cell signaling and 10% are involved in antigen presentation (Fig. 2B), while only 4% of the LPS-responsive probes on the array fell into the cytokine/chemokine category. The paucity of macrophage specific genes that were LPS-inducible may reflect the underrepresentation of inflammatory genes in the probe set. Detailed analysis of the function of the known macrophage-specific and LPS-inducible genes on this array is not the core focus of this study. The key observations that can be made from the data are that macrophages are a distinct cell type that has not been sampled adequately in the RIKEN transcriptome project, that the mRNA profiles are complex (75% of elements on the array gave a detectable signal), and are not dominated by a small number of transcripts, and that LPS causes a significant shift in the profiles of expressed genes. These findings indicated to us that in depth sequencing of cDNA libraries from cells of the macrophage lineage was required to ensure the comprehensive sampling of the mouse transcriptome in the RIKEN project.
Figure 2.
(A) Identification of 373 LPS-responsive transcripts conserved between the mouse strains, or known to be involved in TLR4-mediated LPS signaling; 347 transcripts were identified as enriched in BMM compared to nonmacrophage tissues in the READ expression database. Thirteen of these genes (4%) were also induced by LPS across the time course in the LPS-responsive mouse strains C3H/ARC and BALB/c.
(B) Annotation of the 373 LPS responsive transcripts. Transcripts were binned into functions based on the Gene Ontology terms ascribed to each clone during the FANTOM2 process.
Identification of Novel Macrophage/Dendritic Cell Transcripts
To look for additional macrophage/DC-expressed transcripts three cDNA libraries were created from LPS-stimulated macrophage and DC populations. For the macrophages, we chose 4 h poststimulation, a time when most inducible transcripts on the arrays are at least partly induced, and few constitutively-expressed transcripts that were downregulated by LPS were completely repressed. In total, 64,552, 3′ and 5′ single-pass sequence reads were generated from the three libraries (Table 1). The 64,552 reads were clustered together with 48,137 nonredundant sequences representing known mouse genes to give 22,529 unique sequences, of which 6352 were multi-EST clusters and 16,177 were singleton ESTs (Table 1). Among the 6352 clusters, 4284 contained one or more sequences derived from the known gene set, which left 2068 unknown clusters comprised of 13,124 EST reads (Table 1).
To assess the novelty of the data obtained, we determined how many of this set of unknown ESTs are represented in the FANTOM2 data set. Of the 29,301 ESTs that do not match known genes, 20,225 (69%) were also not found in the FANTOM2 set (Table 1). This observation is not just restricted to the singletons; a significant proportion of the unknown clusters, 816 of the 2068 (39%), were not represented in the FANTOM2 set (Table 1). The identification of a large number of novel singletons is not surprising for a number of reasons. Firstly, this mRNA source has not previously been widely sampled. Secondly, the normalization and subtraction strategy employed during library construction is designed to identify rare transcripts and increase diversity in the library, with the consequential identification of many singletons.
To provide additional evidence as to whether these are truly expressed sequences, we compared the unknown unique sequences to the TIGR mouse gene indices (MGI). Of the unknown unique sequences, 1583 clusters and 5585 singleton ESTs matched TIGR MGI, which provides independent evidence that these represent genuine transcripts. Surprisingly, 23% (485/2068) of the unknown clusters were not represented in TIGR MGI (Table 1). Of these clusters, 349 (72%) could be mapped to either the mouse or human genome sequences (Table 1), providing additional support that they represent genuinely transcribed sequences.
While the RIKEN full-length clone collection represents the most comprehensive set of cDNAs assembled to date, the high novelty rate among the sequences obtained in this present study demonstrates the need for continued sequencing of cDNA libraries from specialized cell populations if a complete picture of the transcriptome is to be obtained.
Functional Analysis of Macrophage/Dendritic Cell-Derived Transcripts
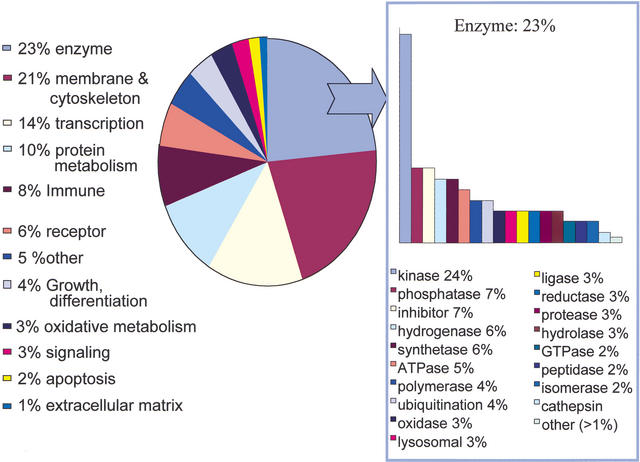
The degree of novelty in the sequence clusters indicates a new depth of transcription in inducible macrophage and dendritic cell populations. We assessed the libraries for enrichment of known inflammatory mediators (Fig. 3), and found high representation of the toll-like receptor family (Tlr1, 2, 3, 4, 7 and 8), adapter proteins (MyD88 and TIRAP), enzymes involved in the lysosome (e.g., lysosomal ATPase), proteasome (such as macropain) and oxidative metabolism (e.g., cytochrome b-245), and a large set (390) of transcriptional regulators. Cytokines and chemokines remained underrepresented (<2% of known genes) in this set for reasons that are not clear.
Figure 3.
Functional analysis of known transcripts in the immunome libraries; 4284 known gene clusters were represented and analyzed using FANTOM2 GO terms extracted from the TC descriptor. Enzymes were the largest category identified, with 1018 unique members. The cytoskeleton category contained 916 members and included membrane bound proteins (excluding receptors), the actin cytoskeleton, and trafficking molecules. Three hundred ninety transcriptional regulators were identified. Three hundred forty-nine TC annotated as immunity/antigen presentation were specifically involved in MHC processing, antigen presentation, chemokine, leukotriene and cytokine production, components of the complement cascade, and interferon signaling. One hundred seventy-two cell cycle, growth and differentiation TC included a number of macrophage-specific, neutrophil-specific, and T-cell-specific differentiation markers. G-proteins, kinases, and the rab/rac signaling pathways were particularly represented in the 108 signaling TCs. The remaining categories included protein synthesis and modification (433 TC), 243 receptors, oxidative metabolism/stress (139 TC), apoptosis (68 TC), and extracellular matrix (52TC).
This study provides a snapshot of the transcriptome in a single inducible cell system. We have demonstrated a molecular lineage marker for primary macrophages. The cluster of genes highly expressed in this set included a large number of full-length RIKEN clones with no annotated function. Interestingly, this set was not dependant on the activation status of the cells, as the LPS hyporesponsive mouse C3H/HeJLpsd clustered with the LPS responsive strains BALB/c and C3H/ARCeven after LPS activation. Indeed, we showed that many LPS-inducible genes are not macrophage-restricted, an observation which itself has broader implications on how we target treatments for inflammatory disease. The RIKEN 19K full-length cDNA set did not contain many known inflammatory mediators. This observation was extended to the public databases generally, and is not surprising given that the large mouse EST projects have focussed on libraries from healthy tissues derived from specific pathogen-free animal house facilities. Our preliminary data set from three activated inflammatory cell populations describes a very high degree of novel transcripts, even among the large tentative consensus sequences. We were able to show broad representation of known cellular processes including signaling, transcription factors, receptors, and enzymes within these libraries. The emphasis of this work was gene discovery and as such a more detailed analysis of the macrophage and dendritic cell gene expression profiles is beyond the scope of this current manuscript. The high degree of novelty found in this study clearly demonstrates the requirement for continued sampling of inducible cell types such as these if a complete picture of the transcriptome, the ultimate aim of projects such as FANTOM2, is to be realized.
METHODS
Mouse Strains, Cell Culture and Total RNA Extraction
Bone marrow-derived macrophages (BMM) were differentiated from primary mouse bone marrow cells obtained from 6-wk-old femurs, collected from pools of male siblings from each of three mouse strains, BALB/c, C3H/ARCLpsn, and C3H/HeJLpsd. The Tlr4 P691H polymorphism in C3H/H3JLpsd was confirmed by sequencing. Cells were differentiated in the presence of 10% Serum Supreme (Gibco-BRL) in RPMI media (Gibco-BRL) and 104 U/mL (10 ng/mL) recombinant human CSF-1 (Chiron). At day 6 cells were harvested and plated in 90mm2 tissue culture dishes at a concentration of 106cells/plate. At day 7, cells were treated with LPS from Salmonella Minnesota (Sigma-Aldrich) for the times shown in the result section. CD11c+ DC were differentiated from bone marrow-derived progenitors by culturing in Iscoves medium containing 10% FCS, 10% GM-CSF (Preprotech). After culturing for 11 d, CD11c+ cells were purified by FACS. Total RNA was extracted using RNAeasy Midi columns (Qiagen) following the vendor's protocol.
Microarray Studies
The 19K full-length cDNA microarrays used for the BMM expression profile studies were generated by the RIKEN genome science center as described previously (Miki et al. 2001). Total RNA from BMM treated or not with LPS at different time points and total RNA from 17.5dpc C57Bl6/J whole-embryos, were labelled with Cy3-aminoallyl and Cy5-aminoallyl, respectively (Amersham Pharmacia) using the indirect labeling protocol as described at http://www.imb.uq.edu.au/groups/hume/. The test (BMM) and the reference (embryo) probes were hybridized at 65°Covernight. The arrays were washed for 5 min in 2×SSC/0.2% SDS buffer and then spun dry. Slides were scanned using a ScanArray 5000 (BioDiscovery). Raw image data was processed using DigitalGenome software (MolecularWare), where data was flagged for signal strength and spot reliability. Data was normalized as previously described (Miki et al. 2001) to the reference standard by subtracting (in log space) the median observed value. We used only data points that were reproducible, by removing those points flagged for intraspot variance and signal threshold below 2× background. Data was interrogated in GeneSpring4.2 (SiliconGenetics), using unsupervised hierarchical clustering. Annotations were determined using Gene Ontology (GO) classifications, and were derived from the RIKEN FANTOM2 database (macrophage restricted set) as described previously (Okazaki et al. 2002), and from UniGene assignments (LPS inducible set), interrogated using the Stanford SOURCE batch server (http://genome-www5.stanford.edu/cgi-bin/SMD/source//sourceBatchSearch).
cDNA Library Construction and Sequencing
cDNA libraries were constructed from purified macrophage and DC populations essentially as previously described (Carninci et al. 2000). Single pass sequencing of the libraries was performed as described previously (Kawai et al. 2001).
Sequence Analysis
The set of ESTs and a set of known genes from GenBank, made nonredundant by eliminating the completely contained sequences, were clustered and assembled using the TGI clustering tools (http://www.tigr.org/tdb/tgi/software/).
The pipeline for clustering and assembly included:
. A cleaning process, in which sequences were trimmed to remove vector, poly-A/T tails, adaptor sequences, and contaminating bacterial sequences.
. A pairwise “all versus all” search step, using megablast (from NCBI Toolkit). The sequence overlaps found were filtered and only those with the minimum length of 40 nucleotides, the minimum percent identity for the overlap of 95% and the maximum mismatched overhangs around the overlap of 30 nucleotides, were kept and used to separate the sequences in clusters. The overlaps were not allowed to start in repeat masked regions, but were allowed to extend into them.
. An assembly step, in which sequences from each of the clusters were passed to the cap3 assembly program for multiple alignment and consensus building.
This process resulted in assemblies—tentative consensus sequences (“TCs”) and “singleton ESTs” (did not cluster with anything else). The resulting assemblies (TCs) were classified into TCs that contain both genes and ESTs and TCs that contain only ESTs. A nonredundant set of “unknown” sequences was built using the TCs containing only ESTs together with the singleton ESTs.
This set was searched using BLAST (E = 1e-5) against the TIGR Mouse Gene Index (http://www.tigr.org/tdb/tgi/mgi—a nonredundant set of all the ESTs in dbEST and genes in GenBank). The hits that were above the thresholds of 90% coverage and 90% identity were considered matching known ESTs. The ones that did not match any sequences in TIGR MGI were considered putative “novel” genes. To verify the validity of these sequences, they were mapped on the latest assemblies of the mouse (MGSCv3) and the human (build30) genomes, using the programs BLAT and Sim4.
For mapping of sequences to the mouse genome, Jim Kent's BLAT program was used, for reasons of high speed and high sensitivity for the same species transcripts/DNA sequences (Kent 2002). For the human genome mappings, Sim4 was used for reasons of higher cross-species sensitivity (Florea 1998). In both cases, the hits reported by these programs were filtered and only those in which the match covered more than a certain percent of the transcript sequence (90% for the mouse genome, 75% for the human genome) and whose overall percent identity was greater than a threshold (95% for mouse genome, 90% for the human genome) were reported.
To evaluate the overlap between the “unknown” set and the sequences produced by the FANTOM2 project, this set was searched against a nonredundant set of sequences from FANTOM2, built in a similar fashion using the TIGR TGI clustering tools. The clones were annotated through human curation of a list of key words that were extracted from the sequence definitions ascribed to each TCor EST.
Acknowledgments
PAL is funded by the Juvenile Diabetes Research Foundation and the Wellcome Trust. CAW and TR are funded by the CRC for chronic inflammatory diseases.
Article and publication are at http://www.genome.org/cgi/doi/10.1101/gr.1056103.
Footnotes
[Supplemental material is available online at www.genome.org.] The sequence data from this study have been submitted to DDBT under accession nos. AK089166–AK089912, BY153905–BY223868, BY681767–BY576025, BY742706–BY765561, BY767554–BY752495, BY761159–BY761576, and BY763617–BY766105. The expression data from this study have been submitted to GEO under accession nos. GPL256, GSM4635–GSM4669, and GSE324–GSE326.
References
- Carninci, P., Shibata, Y., Hayatsu, N., Sugahara, Y., Shibata, K., Itoh, M., Konno, H., Okazaki, Y., Muramatsu, M. and Hayashizaki, Y. 2000. Normalization and subtraction of cap-trapper-selected cDNAs to prepare full-length cDNA libraries for rapid discovery of new genes. Genome Res. 10: 1617-1630. [DOI] [PMC free article] [PubMed] [Google Scholar]
- Ehrt, S., Schnappinger, D., Bekiranov, S., Drenkow, J., Shi, S., Gingeras, T.R., Gaasterland, T., Schoolnik, G. and Nathan, C. 2001. Reprogramming of the macrophage transcriptome in response to interferon-γ and Mycobacterium tuberculosis: Signaling roles of nitric oxide synthase-2 and phagocyte oxidase. J. Exp. Med. 194: 1123-1140. [DOI] [PMC free article] [PubMed] [Google Scholar]
- Florea, L., Hartzell, G., Zhang, Z., Rubin, G.M., and Miller, W. 1998. A computer program for aligning a cDNA sequence with a genomic DNA sequence. Genome Res. 8: 967-976. [DOI] [PMC free article] [PubMed] [Google Scholar]
- Hashimoto, S.-I., Suzuki, T., Nagai, S., Yamashita, T., Toyoda, N. and Matsushima, K. 2000. Identification of genes specifically expressed in human activated and mature dendritic cells through serial analysis of gene expression. Blood 96: 2206-2214. [PubMed] [Google Scholar]
- Hogenesch, J., Ching, K., Batalov, S., Su, A., Walker, J., Zhou, Y., Kay, S., Schultz, P. and Cooke, M. 2001. A comparison of the Celera and Ensembl predicted gene sets reveals little overlap in novel genes. Cell 106: 413-415. [DOI] [PubMed] [Google Scholar]
- Hume, D.A., Ross, I.L., Himes, S. R., Sasmono, R.T., Wells, C.A. and Ravasi, T. 2002. The mononuclear phagocyte system revisited. J. Leukoc. Biol. 72: 621-627. [PubMed] [Google Scholar]
- Kapranov, P., Cawley, S., Drenkow, J., Bekiranov, S., Strausberg, R., Fodor, S. and Gingeras, T. 2002. Large-scale transcriptional activity in chromosomes 21 and 22. Science 296: 916-919. [DOI] [PubMed] [Google Scholar]
- Kawai, J., Shinagawa, A., Shibata, K., Yoshino, M., Itoh, M., Ishii, Y., Arakawa, T., Hara, A., Fukunishi, Y., Konno, H., et al. 2001. Functional annotation of a full-length mouse cDNA collection. Nature 409: 685-690. [DOI] [PubMed] [Google Scholar]
- Kent, W.J. 2002. BLAT—The BLAST-like alignment tool. Genome Res. 12: 656-664. [DOI] [PMC free article] [PubMed] [Google Scholar]
- Lander, E., Linton, L., Birren, B., Nusbaum, C., Zody, M., Baldwin, J., Devon, K., Dewar, K., Doyle, M., FitzHugh, W., et al. 2001. Initial sequencing and analysis of the human genome. Nature 409: 860-921. [DOI] [PubMed] [Google Scholar]
- Miki, R., Kadota, K., Bono, H., Mizuno, Y., Tomaru, Y., Carninci, P., Itoh, M., Shibata, K., Kawai, J., Konno, H., et al. 2001. Delineating developmental and metabolic pathways in vivo by expression profiling using the RIKEN set of 18,816 full-length enriched mouse cDNA arrays. Proc. Natl. Acad. Sci. 98: 2199-2204. [DOI] [PMC free article] [PubMed] [Google Scholar]
- Okazaki, Y., Furuno, M., Kasukawa, T., Adachi, J., Bono, H., Kondo, S., Nikaido, I., Osato, N., Saito, R., Suzuki, H., et al. 2002. Analysis of the mouse transcriptome based on functional annotation of 60,770 full-length cDNAs. Nature 420: 563-573. [DOI] [PubMed] [Google Scholar]
- Ravasi, T., Wells, C., Forest, A., Underhill, D.M., Wainwright, B.J., Aderem, A., Grimmond, S. and Hume, D.A. 2002. Generation of diversity in the innate immune system: Macrophage heterogeneity arises from gene-autonomous transcriptional probability of individual inducible genes. J. Immunol. 168: 44-50. [DOI] [PubMed] [Google Scholar]
- Staudt, L. and Brown, P. 2000. Genomic views of the immune system. Annu. Rev. Immunol. 18: 829-859. [DOI] [PubMed] [Google Scholar]
- Venter, J., Adams, M., Myers, E., Li, P., Mural, R., Sutton, G., Smith, H., Yandell, M., Evans, C., Holt, R., et al. 2001. The sequence of the human genome. Science 291: 1304-1351. [DOI] [PubMed] [Google Scholar]
- Waterston, R.H., Lindblad-Toh, K., Birney, E., Rogers, J., Abril, J.F., Agarwal, P., Agarwala, R., Ainscough, R., Alexandersson, M., An, P., et al. 2002. Initial sequencing and comparative analysis of the mouse genome. Nature 420: 520-562. [DOI] [PubMed] [Google Scholar]
WEB SITE REFERENCES
- http://www.imb.uq.edu.au/groups/hume/; access to indirect labeling protocol.
- http://genome-www5.stanford.edu/cgi-bin/SMD/source//sourceBatchSearch; Stanford SOURCE batch server.
- http://www.tigr.org/tdb/tgi/software/; TGI clustering tools.
- http://www.tigr.org/tdb/tgi/mgi; TIGR Mouse Gene Index


