

Abstract
Background
Studies using vital records-based maternal weight data have become more common, but the validity of these data is uncertain.
Methods
We evaluated the accuracy of prepregnancy body mass index (BMI) and gestational weight gain (GWG) reported on birth certificates using medical record data in 1204 births at a teaching hospital in Pennsylvania from 2003 to 2010. Deliveries at this hospital were representative of births statewide with respect to BMI, GWG, race/ethnicity, and preterm birth. Forty-eight strata were created by simultaneous stratification on prepregnancy BMI (underweight, normal weight/overweight, obese class 1, obese classes 2 and 3), GWG (<20th, 20–80th, >80th percentile), race/ethnicity (non-Hispanic white, non-Hispanic black), and gestational age (term, preterm).
Results
The agreement of birth certificate-derived prepregnancy BMI category with medical record BMI category was highest in the normal weight/overweight and obese class 2 and 3 groups. Agreement varied from 52% to 100% across racial/ethnic and gestational age strata. GWG category from the birth registry agreed with medical records for 41% to 83% of deliveries and agreement tended to be the poorest for very low and very high GWG. The misclassification of GWG was driven by errors in reported prepregnancy weight rather than maternal weight at delivery, and its magnitude depended on prepregnancy BMI category and gestational age at delivery.
Conclusions
Maternal weight data, particularly at the extremes, are poorly reported on birth certificates. Investigators should devote resources to well-designed validation studies, the results of which can be used to adjust for measurement errors by bias analysis.
Gaining too little or too much weight during pregnancy poses health risks to mothers and their infants. 1 Our understanding of this problem, however, is incomplete due to insufficient research relating gestational weight gain (GWG) to rare but serious perinatal outcomes and to limited national monitoring and surveillance of GWG. The use of birth certificate data provides an opportunity to fill these gaps in large and representative populations. The U.S. birth certificate, revised in 2003, now includes data fields that allow evaluation of the appropriateness of GWG according to prepregnancy body mass index (BMI)-specific recommendations 1. Consequently, studies using vital records-based maternal weight data have become more common. 2–5
In 2009 the National Academies of Sciences/Institute of Medicine (IOM) called for expanded use of the revised U.S. birth certificate for monitoring of GWG, but expressed concerns about the validity of its self-reported weight data. 1 GWG is defined as weight at delivery minus the prepregnancy weight, and both weights are susceptible to measurement error. The birth certificate data on prepregnancy weight are almost always ascertained by maternal recall at delivery, 6 the accuracy of which declines as time since conception increases. 7, 8 Weight at delivery is intended to be gathered from prenatal records or the labor and delivery admission history and physical, 6 but these data are not always available. Individual obstetricians’ offices may not transmit prenatal records that document measured maternal weights to the labor and delivery unit, particularly when the mother delivers preterm. Additionally, the admission history and physical may contain only a maternal estimate of weight at delivery because weighing women before delivery is not uniformly performed. The validity of self-reported weight upon admission to the labor and delivery unit is not known. The question remains whether vital records BMI and GWG data are accurate enough to be used without major concern about misclassification bias, or whether measurement error requires that conventional results be adjusted for the bias using methods such as probabilistic bias analysis or Bayesian approaches. 9–12
We undertook a study to evaluate the accuracy of maternal prepregnancy BMI and GWG data derived from the Pennsylvania state birth certificates against information collected from the medical record. We also investigated whether accuracy differs by gestational age at delivery (a primary outcome of interest) and maternal race/ethnicity (a factor that might influence accuracy of weight reporting). 3, 13
Methods
Study populations
Penn MOMS is a cohort study designed to examine the interplay of maternal BMI, GWG, and race/ethnicity on poor pregnancy outcomes. Data came from linked birth-infant death records in Pennsylvania from 2003 to 2010 (n=1,128,034 singleton births). We excluded births with missing data on gestational age (1.5%; n=16,754), height (1.9%, n=20,897), prepregnancy weight (3.3%; n=37,417) or maternal weight at delivery (6.0%, n=67,975) or with a maternal self-reported race/ethnicity other than non-Hispanic white or non-Hispanic black (11.6%; n=131,432). The final birth registry sample included 853,559 singletons.
To validate prepregnancy BMI and GWG data collected on the Pennsylvania birth certificate, we sampled from all singleton births from 2003 to 2010 at Magee-Womens Hospital of UPMC from the eligible Penn MOMS cohort (n=47,233). Magee-Womens Hospital is a teaching hospital and tertiary care center with the highest delivery volume in Pennsylvania (10,000 annual deliveries). Births at Magee-Womens Hospital are similar to state-wide births with respect to race/ethnicity, prepregnancy BMI, GWG, marital status, parity, smoking status and rate of preterm birth (data available upon request). However, they are more likely to be college-educated (46% vs. 31%) and 30 years of age or older (47% vs. 41%).
We used a balanced design, which allocates equal numbers of validation subjects to each of the potentially mismeasured birth-certificate variable categories. This approach ensures equally precise measurements of predictive values of interest within the strata of the covariates incorporated into the design 14. Forty-eight strata were created by simultaneous stratification on 4 birth certificate variables: prepregnancy BMI (underweight [<18.5 kg/m2], normal weight/overweight [18.5–29.9 kg/m2], obese class 1 [30–34.9 kg/m2], obese classes 2 and 3 [≥35 kg/m2]15), GWG (<20th percentile, 20–80th percentile, >80th percentile of statewide BMI-strata-specific GWG z-score distributions 16), race/ethnicity (non-Hispanic white, non-Hispanic black), and gestational age (term, preterm). We collapsed normal weight and overweight because we expected the accuracy of their self-report to be similar. 17 We did not include records with birth-certificate GWG >40 kg or <−20 kg because we deemed these values to be implausible. In 31 strata, we achieved our goal of complete data on 30 records; the remaining 17 strata had 2 to 27 records. The final analytical sample size was 1204 singletons. Additional details on the methods of data collection, interrater reliability study, and record completeness appear in the Appendix.
Self-reported prepregnancy weight and height data on the birth certificate are ascertained via interview before mothers are discharged from the hospital. 6 Medical records of deliveries at Magee-Womens Hospital do not contain measured weight and height before conception. Therefore, we validated the birth certificate-based data using alloyed gold standards: medical-record documented prepregnancy weight and height—both of which mothers reported at the first prenatal visit (median 9.3 [interquartile range 7.4 to 12.3] weeks gestation). Additionally, we performed a sensitivity analysis using the medical record-documented first measured prenatal weight as the alloyed gold standard in women with a measured weight at ≤8 weeks. Prepregnancy BMI (prepregnancy weight (kg)/height (m)2) was categorized as above.
Hospital staff members document maternal weight at delivery on the birth certificate’s “Facility Worksheet” using available prenatal records or the labor and delivery admission history and physical. 6 At Magee-Womens Hospital, the admission history and physical contains a self-reported maternal weight at delivery. To validate weight at delivery, we abstracted from the prenatal record the last measured maternal weight no more than 4 weeks before delivery and the date of this measure, which was converted to a gestational age. We calculated GWG as the difference between the last prenatal weight and prepregnancy weight. For both the birth-certificate and medical record GWG, we calculated GWG z-scores. 16 The GWG-for-gestational-age percentile charts for normal-weight women were applied to underweight women, and the provisional charts for overweight and obese mothers were used for these groups.
Best obstetric estimate of gestational age at delivery is also recorded on the birth certificate’s “Facility Worksheet”. 6 We validated these data using the customary derivation of best obstetric estimate from medical record data on last menstrual period and ultrasound dating. 18 Preterm birth was defined as delivery of a live-born infant at <37 weeks gestation. Self-reported maternal race/ethnicity, education, smoking and other sociodemographic variables were based on the birth certificate 6. If any covariates were missing, we abstracted them during the medical record review.
Statistical analysis
We defined percent agreement as the proportion of births in a birth certificate BMI or GWG category to be correctly classified based on medical-record review. We compared BMI category and GWG category agreement proportions before and after collapsing the validation sample across race/ethnicity and gestational age strata. When there were meaningful differences, results were shown stratified. We then applied the self-reported error information derived from the validation study to the distribution of prepregnancy BMI and GWG in the statewide Penn MOMS dataset. We generated an empirical distribution of self-reported errors for each participant in the validation dataset in each of the 48 strata. We assumed that the errors within each stratum were from a common distribution. We then sampled these empirical distributions with replacement to obtain stratum specific sample errors for the entire Penn MOMS cohort. The population strata (with sampled self-reported errors) were then combined and error-corrected estimates were created. The population level distributions adjusted for self-reported errors were characterized using kernel density estimation.
Results
A majority of mothers delivering singleton infants in the Penn MOMS birth certificate cohort were non-Hispanic white, normal weight or overweight, aged 20 to 29 years, primiparous, married, college graduates and nonsmokers (Table 1). Overall, 7.9% delivered preterm. In contrast, the singleton validation study subcohort by design had nearly equal proportions of subjects in categories of maternal race/ethnicity, prepregnancy BMI, GWG, and preterm birth For instance, the respective proportions of births to non-Hispanic white and black mothers were 84.7% and 15.3% in the Penn MOMS cohort and 53.6% and 46.4% of the validation cohort. The agreement of gestational age on the birth certificate as compared with the medical record was high (Spearman’s rank correlation: 0.95; preterm birth classification: 95% agreement, kappa = 0.90).
Table 1.
Characteristics of mothers delivering singletons in the Pennsylvania birth certificate cohort (2003–2010) and the subcohort of mothers in the validation study.
| Birth certificate data | Validation substudy data | |||
|---|---|---|---|---|
|
|
||||
| N | % | N | % | |
| Gestational age at delivery | ||||
| Term (≥37 weeks) | 786,028 | 92.1 | 705 | 58.6 |
| Preterm (<37 weeks) | 67,531 | 7.9 | 499 | 41.5 |
| Maternal race-ethnicity | ||||
| Non-Hispanic white | 723,033 | 84.7 | 645 | 53.6 |
| Non-Hispanic black | 130,526 | 15.3 | 559 | 46.4 |
| Prepregnancy BMI a | ||||
| Underweight | 35,289 | 4.1 | 258 | 21.4 |
| Normal weight or overweight | 637,122 | 74.6 | 360 | 29.9 |
| Obese class 1 | 100,061 | 11.7 | 291 | 24.2 |
| Obese classes 2 & 3 | 81,087 | 9.5 | 295 | 24.5 |
| Gestational weight gain c | ||||
| <20th percentile | 163,063 | 19.1 | 358 | 29.7 |
| 20–80th percentile | 511,453 | 60.0 | 449 | 37.3 |
| >80th percentile | 178,495 | 20.9 | 397 | 33.0 |
| Gestational weight gain | ||||
| Q1 [5.9 kg] b | 175,891 | 20.6 | 378 | 31.4 |
| Q2 [11.4 kg] | 180,085 | 21.1 | 234 | 19.4 |
| Q3 [14.5 kg] | 161,389 | 18.9 | 113 | 9.4 |
| Q4 [18.2 kg] | 167,781 | 19.7 | 179 | 14.9 |
| Q5 [23.6 kg] | 168,413 | 19.7 | 300 | 24.9 |
| Maternal age | ||||
| <20 | 72,222 | 8.5 | 171 | 14.2 |
| 20–29 | 730,304 | 50.5 | 640 | 53.2 |
| ≥30 | 350,442 | 41.1 | 393 | 32.6 |
| Parity | ||||
| 1 | 415,057 | 48.8 | 632 | 52.7 |
| 2 | 359,740 | 42.3 | 449 | 37.4 |
| 3 or more | 76,453 | 8.9 | 119 | 9.9 |
| Marital status | ||||
| Unmarried | 311,151 | 36.5 | 691 | 57.4 |
| Married | 541,028 | 63.5 | 512 | 42.6 |
| Maternal education | ||||
| Less than high school | 113,945 | 13.4 | 188 | 15.6 |
| High school | 231,129 | 27.2 | 396 | 33.0 |
| Some college | 235,061 | 27.6 | 309 | 25.7 |
| College graduate | 270,623 | 31.8 | 308 | 25.7 |
| Smoking during pregnancy | ||||
| No | 683,869 | 81.3 | 921 | 76.7 |
| Yes | 157,501 | 18.7 | 280 | 23.3 |
Prepregnancy body mass index categories were underweight, <18.5 kg/m2; normal weight or 18.5–29.9 kg/m2; obese class 1, 30–34.9 kg/m2; obese classes 2 and 3, ≥35 kg/m2.
Based on quintiles of the distribution. Values presented in brackets are the median for that category.
Gestational weight gain was measured using weight-gain-for-gestational-age z-scores 16.
The agreement of birth certificate-derived prepregnancy BMI category with the corresponding medical record BMI category varied from 51.7% to 100% depending on the BMI, race/ethnicity, and gestational age (Table 2). Non-Hispanic black mothers who were categorized as underweight or obese class 1 were misclassified to a greater degree than non-Hispanic white women in the same BMI groups. Additionally, there was more variability in the agreement of BMI categories among preterm births compared with term births. Despite the high agreement in the categorization of severely obese mothers, there was substantial variability in the absolute difference between birth-certificate and medical-record BMI among the heaviest women (Figure 1). And although the median difference was close to 0 in all strata, over- and underestimation was prevalent. This error in BMI was driven by errors in reported prepregnancy weight rather than height. Birth certificate-based height was within 1 inch (2.5 cm) of medical record height in 95% of births.
Table 2.
Percent agreement of birth certificate-derived prepregnancy body mass index categories with medical record derived categories in the validation study subcohort by race/ethnicity and gestational age at delivery. a,b
| Birth certificate classification | Birth certificates n (%) | Validation study n | Medical record classification | |||
|---|---|---|---|---|---|---|
| Underweight | Normal weight and overweight | Obese class 1 | Obese classes 2 & 3 | |||
| Non-Hispanic white women delivering at term | ||||||
| Underweight | 27,474 (3.2) | 90 | 74.4% | 25.6% | 0% | 0% |
| Normal weight or overweight | 511,213 (64.6) | 90 | 0% | 98.9% | 1.1% | 0% |
| Obese class 1 | 74,008 (8.7) | 84 | 0% | 13.1% | 79.8% | 7.1% |
| Obese classes 2&3 | 58,227 (6.8) | 90 | 0% | 2.2% | 6.7% | 91.1% |
| Non-Hispanic black women delivering at term | ||||||
| Underweight | 3,928 (0.5) | 84 | 69.0% | 31.0% | 0% | 0% |
| Normal weight or overweight | 78,007 (9.1) | 90 | 2.2% | 93.3% | 2.2% | 2.2% |
| Obese class 1 | 17,631 (2.1) | 87 | 0% | 31.0% | 51.7% | 17.2% |
| Obese classes 2&3 | 15,540 (1.8) | 90 | 0% | 3.3% | 5.6% | 91.1% |
| Non-Hispanic white women delivering preterm | ||||||
| Underweight | 3,201 (0.4) | 65 | 69.2% | 30.8% | 0% | 0% |
| Normal weight or overweight | 37,541 (4.4) | 90 | 0% | 98.9% | 1.1% | 0% |
| Obese class 1 | 6,118 (0.7) | 69 | 0% | 10.1% | 72.5% | 17.4% |
| Obese classes 2&3 | 5,251 (0.6) | 67 | 0% | 1.4% | 9.0% | 89.6% |
| Non-Hispanic black women delivering preterm | ||||||
| Underweight | 686 (0.8) | 19 | 57.9% | 42.1% | 0% | 0% |
| Normal weight or overweight | 10,361 (1.2) | 63 | 0% | 93.3% | 6.7% | 0% |
| Obese class 1 | 2,304 (0.3) | 51 | 0% | 13.7% | 68.6% | 17.7% |
| Obese classes 2&3 | 2,069 (0.2) | 48 | 0% | 0% | 0% | 100% |
Agreement proportion is calculated as the probability that women in each birth certificate-derived prepregnancy BMI category were truly underweight, truly normal weight, truly overweight, truly obese class 1, and truly obese classes 2 and 3 by the medical record.
Preterm birth is defined as <37 weeks gestation based on birth certificate-derived gestational age; prepregnancy body mass index categories were underweight, <18.5 kg/m2; normal or overweight, 18.5–29.9 kg/m2; obese class 1, 30–34.9 kg/m2; obese classes 2 and 3, ≥35 kg/m2.
Figure 1.

Box plots of the difference between birth certificate-derived prepregnancy body mass index (BMI) and medical record-derived BMI according to birth certificate categories of maternal race/ethnicity, gestational age at delivery, and prepregnancy BMI.
Underweight BMI <18.5 kg/m2, white box; normal weight/overweight BMI 18.5 to 29.9 kg/m2, light gray box; obese class 1 BMI 30 to 34.9 kg/m2, dark gray box; obese classes 2 and 3 BMI ≥35 kg/m2, black box. Positive values on the y-axis indicate that the birth certificate overestimated prepregnancy BMI, and negative values indicate that the birth certificate underestimated prepregnancy BMI.
The validity of birth certificate-derived GWG categories varied by prepregnancy BMI and gestational age at birth (Figure 1; Web table 2). The birth certificate placed 40.9% to 83.3% of births in the same GWG category as on medical record review, with the extremes of GWG tending to have the greatest degree of misclassification. The agreement proportion for very low GWG was better in preterm compared with term births. There were no meaningful differences by maternal race/ethnicity. The accuracy of GWG was more influenced by errors in prepregnancy weight than weight at delivery. Agreement within 5 lb (2.3 kg) was observed more often for maternal weight at delivery than prepregnancy weight (underweight, 88.8% vs. 66.7% agreement; normal weight/overweight, 81.1% vs. 62.7% agreement; obese class 1, 77.3% vs. 43.6% agreement; obese classes 2 and 3, 70.2% vs. 40.7% agreement). Furthermore, the accuracy of the BMI data predicted error in GWG (Figure 2). GWG tended to be accurate when the birth certificate and medical record pre-pregnancy BMI were equal, to be overestimated when BMI was underestimated, and to be underestimated when BMI was overestimated. Conclusions were similar when we used measured prenatal weight at ≤8 weeks in place of self-reported prepregnancy weight (n=383).
Figure 2.
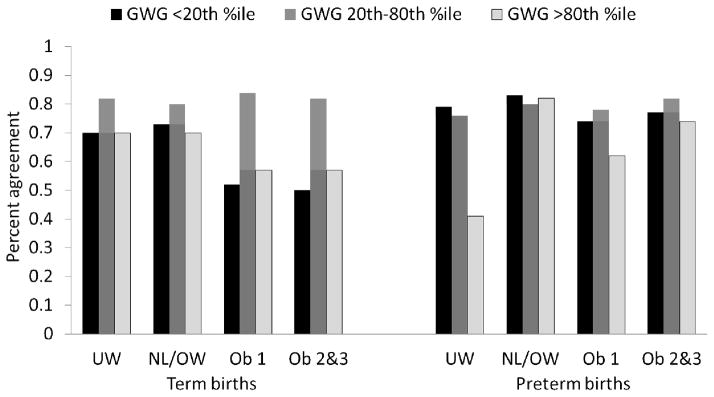
Percent agreement of birth-certificate derived gestational weight gain (GWG) categories with medical record derived categories by prepregnancy BMI (according to the birth certificate) and gestational age at delivery.
UW, underweight BMI <18.5; NL/OW, normal weight or overweight BMI 18.5 to 29.9; Ob 1, obese class 1 BMI 30 to 34.9; Ob 2&3, obese classes 2 and 3 BMI ≥35 kg/m2.
The consequence of these errors on the distribution of maternal BMI and GWG in the statewide Penn MOMS cohort is shown in Figure 3. The error-adjusted distribution of BMI was slightly flatter and right-shifted compared with the unadjusted distribution (Panel A). The difference in these densities is shown in Panel B, and illustrates that the adjustment led to a smaller density of normal-weight individuals and larger densities of all other BMI groups. The distribution of GWG was flatter after error adjustment, with longer tails (Panel C). As with BMI, the error adjustment led to more individuals with GWG <9 kg or >25 kg, with the exception of there being fewer individuals at 0 kg (Panel D).
Figure 3.

Birth certificate-derived maternal gestational weight gain (GWG) by the difference between birth certificate-derived GWG and medical record-derived GWG according to whether the birth certificate prepregnancy BMI was correct to two decimal places (Panel A, n=22), not correct but in the same BMI category (Panel B, n=743), the BMI category was underestimated (Panel C, n=157), or the BMI category was overestimated (Panel D, n=83).
Positive values on the y-axis indicate that the birth certificate overestimated maternal gestational weight gain, and negative values indicate that the birth certificate underestimated maternal gestational weight gain.
Comments
Our validation study results suggest that poor reporting of maternal weight on birth certificates leads to substantial misclassification of prepregnancy BMI and GWG categories. The error in BMI and GWG categories depended on the birth certificate BMI or GWG category, as well as gestational age and maternal race/ethnicity (for BMI categories). After error-adjustment of BMI in the statewide birth certificate cohort, there was only a small change to the distribution. This small change is due to the high accuracy of BMI reporting among normal-weight and overweight non-Hispanic white mothers delivering at term, who make up 65% of our birth certificate cohort. Other strata had poorer accuracy, but because they were less common in the entire cohort, they had less impact on the population distribution. Error adjustment had a more noticeable effect on the GWG distribution, given GWG categories are impacted by error in both weight at delivery and prepregnancy BMI.
Little work has been done to validate maternal weight data on U.S. birth certificates, 19–22 including only two published studies using the 2003 revised form of the birth certificate. Our results agree with a GWG validation study of 1224 births from the University of Pennsylvania, an urban teaching hospital (66% black; 58% Medicaid). These authors found that only 48% of births had a GWG on the 2003 U.S. birth certificate that was within 10 lb. of the GWG documented in the electronic medical record. 23 When stratified by 2 categories of BMI and 3 categories of GWG, women with medical record BMI<25 and adequate GWG were more likely to report GWG accurately on the birth certificate than any other stratum. Another study compared birth certificate-derived prepregnancy BMI with BMI based on measured first-trimester weight among 23,314 WIC participants. 24 Like us, these authors found over- and underestimation of BMI category and poor accuracy for underweight, normal weight, overweight and obese mothers (48% to 93% positive predictive values).
Errors in both prepregnancy weight and weight at delivery impact the misclassification of birth registry-derived GWG categories. The former, however, appeared to be a stronger influence. This is not surprising given that birth certificate weight at delivery at Magee-Womens Hospital is ascertained from either a prenatal measured weight in the medical record or maternal recall usually within a few weeks of the last measured weight, while prepregnancy weight is recalled approximately 40 weeks after conception. Poor recall of maternal weight data from retrospective sources has been reported in other studies. 7, 13, 25 Nevertheless, we lacked gold-standard preconception weight and height measurements in the medical record, so we compared the birth certificate prepregnancy weight and height with ‘alloyed’ gold standards: self-reports at a median of 9.3 weeks in the primary analysis and measured prenatal weight at ≤8 weeks in a subsample. Although strong agreement has been noted between self-reported prepregnancy weight and height at the first visit compared with preconceptional measures, 8, 26, 27 it is unknown whether these results apply to our sample.
The balanced design of our validation study in which we sampled within 48 strata was unique because it allowed us to precisely estimate the accuracy of pregravid BMI and GWG categories among important subgroups with a low prevalence, such as pregnancies with extreme values of BMI and GWG. Mothers with very high or very low prepregnancy BMI or GWG are those who may benefit the most from directed lifestyle interventions to optimize weight and weight gain; thus, unbiasedly estimating their risk of adverse outcomes is a critical public health priority 28 and a major goal of the Penn MOMS Study. Nevertheless, our validation results may be less robust for underweight or severely obese black mothers delivering preterm because these women were rare in our eligible cohort (<1%).
The inclusion of gestational age at delivery as a design variable allowed us to evaluate the potential for differential misclassification bias. We hypothesized that GWG would be less accurate among women delivering preterm because recall may be poorer after an adverse outcome, and prenatal records with a last measured weight before delivery may not have been transmitted to the labor and delivery facility. Instead, we found that accuracy of GWG varied by the amount of weight gain, with more accurate classification with very low GWG in preterm than in term births. These results suggest that accounting for this differential bias may strengthen associations between low GWG and preterm birth in our cohort.
It would have been optimal to select a random sample of births from across the state for our validation subcohort, but this is approach would have required enormous resources. The budget for this validation study accounted for approximately half of the Penn MOMS Study’s total budget. We decided to invest these resources in the most cost-efficient manner by validating data from a single site. We chose Magee-Womens Hospital because it serves a population with a wide range of BMI, GWG, and gestational ages at birth and has the highest delivery volume of any facility in the state, thereby allowing us to selectively sample in each stratum and achieve good balance. The distributions of prepregnancy BMI, GWG, and gestational age at delivery were similar in our hospital compared with all of Pennsylvania, but given some differences by years of education and age in our population, our results do not perfectly generalize to statewide births. Additionally, our hospital has a larger percent of records with missing weight data compared with statewide (28.7% vs 11.4%), though missingness appears to be at random.29, 30 It is possible that procedures for recording data in birth certificates and medical records vary at different hospitals, which could affect the generalizability of our results. Finally, our results may not extrapolate to populations outside of our region because predictive values depend on the prevalence of the validated variable in the population. 31 We could not calculate sensitivity and specificity because we could not sample based on true classification of our design variables. 31
Our project was limited to non-Hispanic black and non-Hispanic white mothers because of small samples of other racial/ethnic groups at the validation hospital. Other characteristics also may be important to consider as validation study design variables, including maternal education, age, or gestational age at entry into care. 3, 13, 23, 24 Births selected into the validation study but lacking medical record BMI or GWG data were excluded from the analysis. These pregnancies were more likely to have birth certificates indicating low BMI, low GWG, and preterm delivery. For this to cause selection bias, the magnitude and direction of the misreporting of maternal weight data would have to differ in this group from those included. It is less likely that the ineligibility of pregnancies with missing birth certificate data on BMI and GWG was an important source of bias as characteristics of these women did not differ from those with complete maternal weights (data not shown).
The error that we noted in birth certificate-derived prepregnancy BMI and GWG categories warrants attention from CDC and other public health professionals who use these data for etiologic studies or monitoring and surveillance. The CDC may wish to reconsider the recommendation that maternal recall at delivery be the preferred source of prepregnancy weight data on the birth certificate 6, and incorporating maternal prepregnancy weight and weight at delivery into the CDC’s multi-state validation study of the revised birth certificate 32 is critical. Researchers should rigorously quantify the error in these variables by undertaking validation studies within their own population when possible. To use resources most efficiently, substantial effort should be placed on designing the validation study to precisely study accuracy in subgroups of interest. Using these validation data in the many analytic strategies that incorporate measurement error, including probabilistic bias analysis and Bayesian adjustment, 9–12 allows the researcher to estimate the direction and magnitude of any resulting bias, and provides the best defense against reasonable criticisms that results are uncertain due to this error. In the absence of internal validation data, external validation data and expert judgment may provide reasonable alternatives. 9 Biases may not always be large, but in the absence of a quantitative estimate, analysts knowingly or unknowingly substitute their intuitive judgment about the size of the bias—a strategy that is subject to substantial inferential error. 33
Supplementary Material
Figure 4.

The density of preregnancy body mass index (BMI; Panel A) and gestational weight gain (Panel C) in the Penn MOMS singletons cohort before error correction (solid line) and after error correction in one bootstrapped sample (dashed line) as well as the difference in the densities pre- and post-error-adjustment (Panels B and D), n=855,469. The dashed lines in Panel B mark BMI values of 18.5 and 25 kg/m2, and the dashed lines in Panel D marks 9 and 25 kg.
Acknowledgments
This project was supported by NIH grant R21 HD065807 and the Thrasher Research Fund (#9181).
We thank Sarah Pugh, Jennifer Taylor, and Sean Rinella for abstracting data for this study.
References
- 1.Institute of Medicine. Weight Gain During Pregnancy: Reexamining the Guidelines. Washington, DC: National Academies Press; 2009. [PubMed] [Google Scholar]
- 2.Salihu HM, Alio AP, Wilson RE, Sharma PP, Kirby RS, Alexander GR. Obesity and extreme obesity: new insights into the black-white disparity in neonatal mortality. Obstetrics & Gynecology. 2008;111:1410–1416. doi: 10.1097/AOG.0b013e318173ecd4. [DOI] [PubMed] [Google Scholar]
- 3.Hinkle SN, Sharma AJ, Schieve LA, Ramakrishnan U, Swan DW, Stein AD. Reliability of gestational weight gain reported postpartum: a comparison to the birth certificate. Maternal Child Health Journal. 2013;17:756–765. doi: 10.1007/s10995-012-1057-0. [DOI] [PubMed] [Google Scholar]
- 4.Aliyu MH, Luke S, Wilson RE, Saidu R, Alio AP, Salihu HM, et al. Obesity in older mothers, gestational weight gain, and risk estimates for preterm phenotypes. Maturitas. 2010;66:88–93. doi: 10.1016/j.maturitas.2010.02.016. [DOI] [PubMed] [Google Scholar]
- 5.Mann JR, McDermott SW, Hardin J, Pan C, Zhang Z. Pre-pregnancy body mass index, weight change during pregnancy, and risk of intellectual disability in children. BJOG: an international journal of obstetrics and gynaecology. 2013;120:309–319. doi: 10.1111/1471-0528.12052. [DOI] [PubMed] [Google Scholar]
- 6.Centers for Disease Control and Prevention National Center for Health Statistics. Birth Edit Specifications for the 2003 Proposed Revision of the US Standard Certificate of Birth. 2003 http://www.cdc.gov/nchs/data/dvs/birth_edit_specifications.pdf.
- 7.Tomeo CA, Rich-Edwards JW, Michels KB, Berkey CS, Hunter DJ, Frazier AL, et al. Reproducibility and validity of maternal recall of pregnancy-related events. Epidemiology. 1999;10:774–777. [PubMed] [Google Scholar]
- 8.Lederman SA, Paxton A. Maternal reporting of prepregnancy weight and birth outcome: consistency and completeness compared with the clinical record. Maternal Child Health Journal. 1998;2:123–126. doi: 10.1023/a:1022996924094. [DOI] [PubMed] [Google Scholar]
- 9.Lash TL, Fox MP, Fink AK. Applying Quantitative Bias Analysis to Epidemiologic Data. New York: Springer; 2009. [Google Scholar]
- 10.MacLehose RF, Gustafson P. Is probabilistic bias analysis approximately Bayesian? Epidemiology. 2012;23:151–158. doi: 10.1097/EDE.0b013e31823b539c. [DOI] [PMC free article] [PubMed] [Google Scholar]
- 11.Fox MP, Lash TL, Greenland S. A method to automate probabilistic sensitivity analyses of misclassified binary variables. Int J Epidemiol. 2005;34:1370–1376. doi: 10.1093/ije/dyi184. [DOI] [PubMed] [Google Scholar]
- 12.Lash TL, Abrams B, Bodnar LM. Comparisons of several bias analysis strategies applied to a large registry-based dataset. Epidemiology. doi: 10.1097/EDE.0000000000000102. in press. [DOI] [PMC free article] [PubMed] [Google Scholar]
- 13.Schieve LA, Perry GS, Cogswell ME, Scanion KS, Rosenberg D, Carmichael S, et al. Validity of self-reported pregnancy delivery weight: an analysis of the 1988 National Maternal and Infant Health Survey. NMIHS Collaborative Working Group. American Journal of Epidemiology. 1999;150:947–956. doi: 10.1093/oxfordjournals.aje.a010103. [DOI] [PubMed] [Google Scholar]
- 14.Holcroft CA, Spiegelman D. Design of validation studies for estimating the odds ratio of exposure-disease relationships when exposure is misclassified. Biometrics. 1999;55:1193–1201. doi: 10.1111/j.0006-341x.1999.01193.x. [DOI] [PubMed] [Google Scholar]
- 15.WHO Consultation on Obesity. Obesity: Preventing and Managing the Global Epidemic. Geneva, Switzerland: World Health Organization; 2000. Report No.: WHO Technical Report Series 894. [PubMed] [Google Scholar]
- 16.Hutcheon JA, Platt RW, Abrams B, Himes KP, Simhan HN, Bodnar LM. A weight-gain-for-gestational-age z score chart for the assessment of maternal weight gain in pregnancy. American Journal of Clinical Nutrition. 2013;97:1062–1067. doi: 10.3945/ajcn.112.051706. [DOI] [PMC free article] [PubMed] [Google Scholar]
- 17.Bodnar LM, Siega-Riz AM, Simhan HN, Diesel JC, Abrams B. The impact of exposure misclassification on associations between prepregnancy BMI and adverse pregnancy outcomes. Obesity. 2010;18:2184–2190. doi: 10.1038/oby.2010.25. [DOI] [PMC free article] [PubMed] [Google Scholar]
- 18.ACOG Practice Bulletin No. 107: Induction of Labor. Obstetrics & Gynecology. 2009;114:386–397. doi: 10.1097/AOG.0b013e3181b48ef5. [DOI] [PubMed] [Google Scholar]
- 19.Reichman NE, Hade EM. Validation of birth certificate data. A study of women in New Jersey’s HealthStart program. Annals of Epidemiology. 2001;11:186–193. doi: 10.1016/s1047-2797(00)00209-x. [DOI] [PubMed] [Google Scholar]
- 20.Vinikoor LC, Messer LC, Laraia BA, Kaufman JS. Reliability of variables on the North Carolina birth certificate: a comparison with directly queried values from a cohort study. Paediatric and Perinatal Epidemiology. 2010;24:102–112. doi: 10.1111/j.1365-3016.2009.01087.x. [DOI] [PMC free article] [PubMed] [Google Scholar]
- 21.Zollinger TW, Przybylski MJ, Gamache RE. Reliability of Indiana birth certificate data compared to medical records. Annals of Epidemiology. 2006;16:1–10. doi: 10.1016/j.annepidem.2005.03.005. [DOI] [PubMed] [Google Scholar]
- 22.Buescher PA, Taylor KP, Davis MH, Bowling JM. The quality of the new birth certificate data: a validation study in North Carolina. American Journal of Public Health. 1993;83:1163–1165. doi: 10.2105/ajph.83.8.1163. [DOI] [PMC free article] [PubMed] [Google Scholar]
- 23.Wright CS, Weiner M, Localio R, Song L, Chen P, Rubin D. Misreport of gestational weight gain (GWG) in birth certificate data. Maternal & Child Health Journal. 2012;16:197–202. doi: 10.1007/s10995-010-0724-2. [DOI] [PubMed] [Google Scholar]
- 24.Park S, Sappenfield WM, Bish C, Bensyl DM, Goodman D, Menges J. Reliability and validity of birth certificate prepregnancy weight and height among women enrolled in prenatal WIC program: Florida, 2005. Maternal Child Health Journal. 2011;15:851–859. doi: 10.1007/s10995-009-0544-4. [DOI] [PubMed] [Google Scholar]
- 25.McClure CK, Bodnar LM, Ness R, Catov JM. Accuracy of maternal recall of gestational weight gain 4 to 12 years after delivery. Obesity. 2011;19:1047–1053. doi: 10.1038/oby.2010.300. [DOI] [PMC free article] [PubMed] [Google Scholar]
- 26.Mandujano A, Huston-Presley L, Waters TP, Catalano PM. Women’s reported weight: is there a discrepancy? J Maternal-Fetal & Neonatal Medicine. 2012;25:1395–1398. doi: 10.3109/14767058.2011.636099. [DOI] [PubMed] [Google Scholar]
- 27.Phelan S, Phipps MG, Abrams B, Darroch F, Schaffner A, Wing RR. Randomized trial of a behavioral intervention to prevent excessive gestational weight gain: the Fit for Delivery Study. American Journal of Clinical Nutrition. 2011;93:772–779. doi: 10.3945/ajcn.110.005306. [DOI] [PMC free article] [PubMed] [Google Scholar]
- 28.Rasmussen KM, Abrams B, Bodnar LM, Butte NF, Catalano PM, Maria Siega-Riz A. Recommendations for weight gain during pregnancy in the context of the obesity epidemic. Obstetrics & Gynecology. 2010;116:1191–1195. doi: 10.1097/AOG.0b013e3181f60da7. [DOI] [PMC free article] [PubMed] [Google Scholar]
- 29.Bodnar LM, Hutcheon JA, Platt RW, Himes KP, Simhan HN, Abrams B. Should gestational weight gain recommendations be tailored by maternal characteristics? American Journal of Epidemiology. 2011;174:136–146. doi: 10.1093/aje/kwr064. [DOI] [PMC free article] [PubMed] [Google Scholar]
- 30.Bodnar LM, Siega-Riz AM, Simhan HN, Himes KP, Abrams B. Severe obesity, gestational weight gain, and adverse birth outcomes. Am J Clin Nutr. 2010;91:1642–1648. doi: 10.3945/ajcn.2009.29008. [DOI] [PMC free article] [PubMed] [Google Scholar]
- 31.Marshall RJ. Validation study methods for estimating exposure proportions and odds ratios with misclassified data. Journal of clinical epidemiology. 1990;43:941–947. doi: 10.1016/0895-4356(90)90077-3. [DOI] [PubMed] [Google Scholar]
- 32.Martin JA, Wilson EC, Osterman MJK, Saadi EW, Sutton SR, Hamilton BE. National vital statistics reports. Hyattsville, MD: National Center for Health Statistics; 2013. Assessing the quality of medical and health data from the 2003 birth certificate revision: Results from two states. [PubMed] [Google Scholar]
- 33.Lash TL. Heuristic thinking and inference from observational epidemiology. Epidemiology. 2007;18:67–72. doi: 10.1097/01.ede.0000249522.75868.16. [DOI] [PubMed] [Google Scholar]
Associated Data
This section collects any data citations, data availability statements, or supplementary materials included in this article.