Abstract
The chromosomal gene expression profiles established by the Human Transcriptome Map (HTM) revealed a clustering of highly expressed genes in about 30 domains, called ridges. To physically characterize ridges, we constructed a new HTM based on the draft human genome sequence (HTMseq). Expression of 25,003 genes can be analyzed online in a multitude of tissues (http://bioinfo.amc.uva.nl/HTMseq). Ridges are found to be very gene-dense domains with a high GC content, a high SINE repeat density, and a low LINE repeat density. Genes in ridges have significantly shorter introns than genes outside of ridges. The HTMseq also identifies a significant clustering of weakly expressed genes in domains with fully opposite characteristics (antiridges). Both types of domains are open to tissue-specific expression regulation, but the maximal expression levels in ridges are considerably higher than in antiridges. Ridges are therefore an integral part of a higher order structure in the genome related to transcriptional regulation.
About 120 Serial Analysis of Gene Expression (SAGE) libraries with 6 million transcript tags are available publicly and provide a quantitative mRNA expression profile for a range of tissues and cell lines (Velculescu et al. 1995; Lal et al. 1999). Integration of these data with the radiation hybrid map of the genome has visualizedthe expression profiles of 19,000 genes in the context of their chromosomal map position (Caron et al. 2001). Highly expressed genes were foundto cluster in about 30 ridges. Some of these showed a high gene density per centiRay, but this analysis was limited by the inherent errors and ambiguities of the human radiation hybrid map. Ridges have an overall high expression in all analyzed tissues, as confirmed in two recent studies (Fujii et al. 2002; Lercher et al. 2002). These data raised the question as to whether ridges represent domains with a higher order structure related to transcriptional regulation.
RESULTS
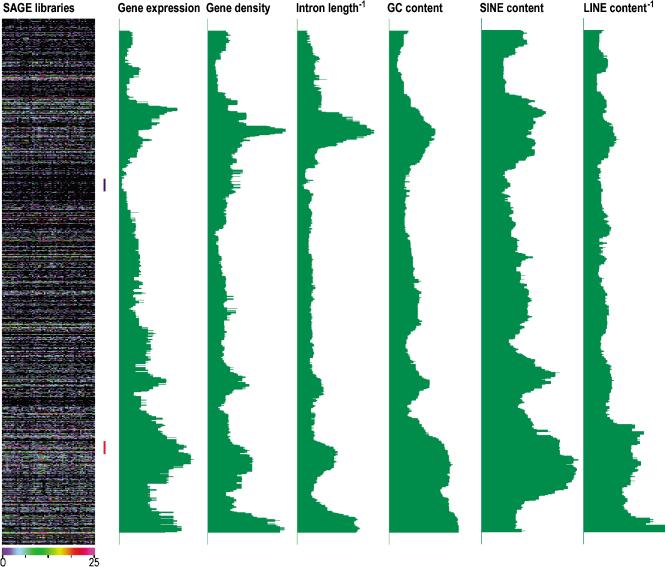
To analyze the genomic structure of ridges, we designed a Human Transcriptome Map based on the draft human genome sequence (HTMseq). Briefly, the databases of the public human genome project (Lander et al. 2001) as provided by the UCSC Genome Project (http://genome.ucsc.edu/) were integrated with mRNA expression levels as established by SAGE (see Supplemental Information, available at www.genome.org, for details). The UCSC database lists all identified transcripts with a genomic map position. We related these transcripts to UniGene clusters. The SAGE tags for 52,256 of these UniGene clusters were identified using AMCtagmap (Caron et al. 2001). Many UniGene clusters map to multiple genomic positions due to the occurrence of pseudogenes and the erroneous clustering of unrelated transcripts in UniGene clusters. We designed a procedure to split UniGene clusters according to chromosomal positions, resulting in a total of 70,751 map positions. Individual transcripts were subsequently assigned to those split clusters that have a matching genomic sequence. UniGene clusters were also frequently found to overlap. We considered overlapping clusters for which we confirmedan identical strandassignment to be fragments of one larger gene and merged them. Finally, UniGene clusters without intron–exon structure were rejected as potential pseudogenes. This procedure resulted in a chromosomal map with 25,003 transcriptional units (TUs), for which the expression levels are known from SAGE libraries. This sequence-based version of the Human Transcriptome Map (HTMseq) is available as a Web application (http://bioinfo.amc.uva.nl/HTMseq). Expression can be monitored for whole chromosomes (Fig. 1, left graph) or for any chromosomal subregion (Fig. 4A,B, below) and expression levels can be analyzed for 120 SAGE libraries from a range of tissues or for combinations of SAGE libraries of a specific tissue. The map serves as a powerful tool for analyzing expression profiles of chromosomal regions implicated in cancer or tissue-specific gene expression in a chromosomal context.
Figure 1.
Profiles of gene expression, gene density, inverse intron length, GC content, SINE density, and inverse LINE density of human chromosome 9. The left color chart shows expression data from 62 SAGE libraries of 50,000 or more transcript tags. Each horizontal line is a transcription unit (TU). Vertical rows are individual SAGE libraries. The levels of expression are given by a color code, ranging from zero to the here chosen maximum of 25 or more tags/100,000 transcript tags in a library; Green profiles: moving medians of the gene expression levels, gene density, inverse intron length, GC content, SINE density and inverse LINE density at window size 49. Expression levels are taken from all combined SAGE libraries, totaling to 5,959,046 tags (SAGE all tissues). See Figure 6 of the Supplemental Information for profiles of all human chromosomes.
Figure 4.
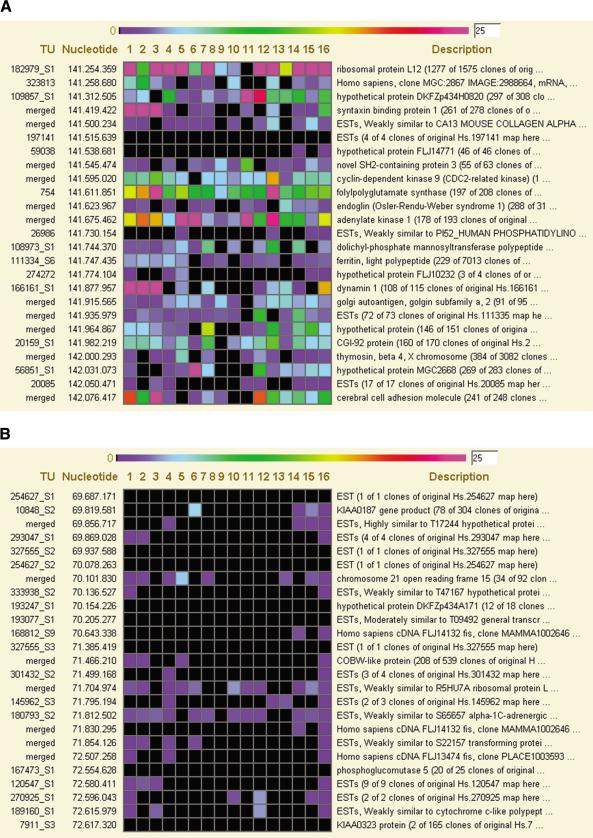
Genes in ridges and antiridges can have tissue-specific expression patterns. (A) Expression pattern of 25 genes in a ridge on chromosome 9. The region of the ridge is indicated in Figure 1 by a red bar. The figure is taken from the HTMseq Web site and represents the concise view level of the application. Each horizontal line gives the TU number, the start nucleotide position of the gene on chromosome 9, the level of expression of the gene in 16 tissue-type SAGE libraries, and the description line of the TU. The level of expression is given by a color code ranging from 0–25 tags/100,000 tags in the SAGE library (see color scale at top). The SAGE libraries shown are (1) brain normal; (2) brain normal cerebellum; (3) brain normal white matter; (4) breast normal; (5) colon normal; (6) heart normal; (7) kidney normal; (8) leucocyte normal; (9) liver normal; (10) lung normal; (11) ovary normal; (12) pancreas normal; (13) peritoneum normal; (14) prostate normal; (15) vascular endothelium normal; (16) all normal tissues; (B) The same analysis for an antiridge on chromosome 9 (indicated by blue bar in Fig. 1). The SAGE libraries are as indicated above.
Ridges Are Characterized by High Gene Density, High GC Content, and Short Introns
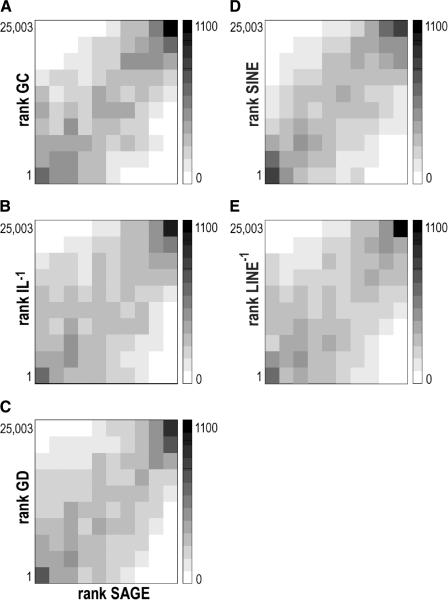
The chromosomal expression profiles of SAGE libraries established by the HTMseq confirmed the previously observed clustering of highly expressed genes. Figure 1 (left) shows the expression profile of chromosome 9 in 62 SAGE libraries of at least 50,000 transcript tags each, generated from many different tissues. To visualize ridges, we computed median expression levels in moving windows of consecutive genes along the chromosomes (Caron et al. 2001). We initially analyzed the patterns for window size 49 (w = 49). Regions of high gene expression are clearly visible, as shown for chromosome 9 in Figure 1 (for other chromosomes, see Fig. 6 in the Suppl. Information). The clustering is highly significant (P < 10–20, see below), confirming the organization of the genome in ridges. The initial analysis of the human genome sequence (Lander et al. 2001) revealed a statistical relationship between gene density and GC content, whereas GC-rich genomic sequences were also found to correlate with short intron length. We therefore calculated the gene density, average intron length per gene, and GC content in blocks of 20,000 bp encompassing each gene. The moving medians of the gene density and GC content (w = 49) show a striking similarity to the patterns of gene expression (Fig. 1; Suppl. Information). The expression patterns are also similar to the inverse of the intron length, implying that genes in ridges have very short introns compared with genes outside of ridges (Fig. 1). We found a significant positive correlation between gene expression and gene density (P < 10–45), GC content (P < 10–211), and (inverse) intron length (P < 3.10–12; Spearman rank correlation test; Press et al. 1997). This correlation was established for individual genes (w = 1) and was even more significant for higher window sizes. Two-dimensional histograms of SAGE rank versus gene density rank (w = 49) suggest that the correlation is not uniform over the range of both quantities, but that the main contributions come from the high andlow extremes (Fig. 2A). The same holds for inverse intron length and GC content (Fig. 2B,C). Accordingly, ridges show a significant enrichment for genes with short introns, high gene density, or high GC content (all P values < 10–25 in a Kolmogorow-Smirnov test, see Fig. 8 of the Suppl. Information).
Figure 2.
Analysis of the rank correlation between median gene expression and median GC content (A), median inverse intron length (B), median gene density (C), median SINE density (D), and median inverse LINE density (E). The shade of each square corresponds to the number of genes. The values obtained for window size 49 are shown.
Visualizing Position and Length Scale Simultaneously in Ridgeograms
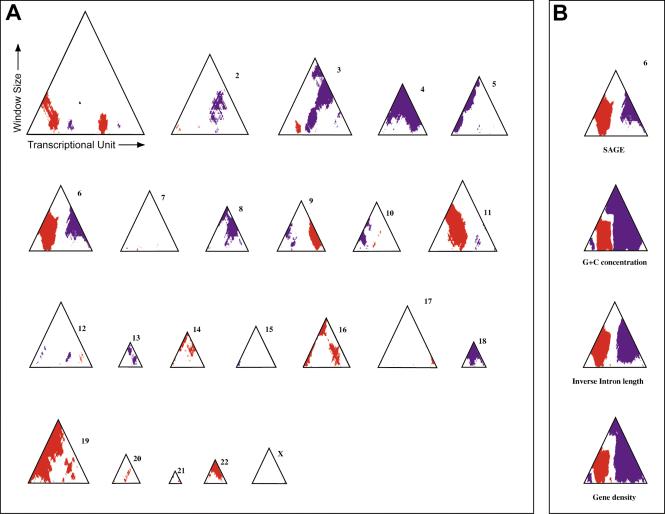
Significant clustering of highly expressed genes can result either from clustering of a large number of genes with a moderately high expression, or from clustering of a more limited set of genes with an extremely high expression. We developed a method for identifying ridges that takes this variability into account by considering all window sizes simultaneously (for details see Suppl. Information). We computed median expression levels of all window sizes up to the largest possible size (viz. the number of TUs on a given chromosome). For each window size, we determined a threshold value above which the moving median is significantly higher than expected for a random distribution of genes along the genome. We imposed a false discovery rate (Benjamini and Hochberg 1995) of 5% on the basis of sampling over a large series of genomes with randomly permuted gene orders. Figure 3A shows ridgeograms in which the red regions summarize the location of moving medians above the thresholds for each window size. They horizontally give the gene order on each chromosome and vertically show the window size increasing from 19 to the maximal window size. In the range of window sizes from 19–59 genes, we find 1359 distinct TUs with a median expression value above threshold, which is highly significant for a nonrandom distribution of highly expressed genes along the genome (P < 10–20, see Methods). Chromosome 3 contains an example of a ridge consisting of a limited number of genes with very high expression, whereas the ridges on chromosome 14 have more moderate expression levels, but consist of a very large number of genes. Chromosome 6 has a pronounced ridge characterized by both very high gene expression and a large number of genes.
Figure 3.
Identification of chromosomal regions of significant extremes in gene expression, gene density, intron length, and GC content. (A) Ridgeograms of the gene expression of all human chromosomes showing the ridges (red) and antiridges (blue) as function of window size. The horizontal axis of each triangle gives the position of the TUs along each chromosome (left, top of the p arm; right, distal end of the q arm). The vertical axis gives the window size, increasing from window size 19 until the maximum possible window size for each chromosome; (B) Ridgeogram of chromosome 6 together with significance plots of extremes in GC content, inverse intron length and gene density.
Weakly Expressed Genes Cluster in Antiridges
We used the same procedure to analyze whether genes with a very weak expression level also cluster in the genome. We found430 genes (w = 19–59) with a moving median of significantly decreased expression (antiridges, indicated in blue in Fig. 3A). Chromosomes 4, 8, 13, and 18 have a significantly decreased expression as a whole. The median expression of genes in ridges is 16 times as high as in antiridges (128 compared with 8 transcripts/gene/100,000 mRNAs).
We applied the same procedure to assess clustering of genes with short introns, high GC content or regions of high gene density. For all three entities, we find a significant clustering in the genome, as shown for chromosome 6 in Figure 3B (red regions). Also, all three opposite characteristics, that is, long introns, low GC content, and low gene density, significantly cluster in the genome (blue spots in Fig. 3A). Analysis of all chromosomes (see Fig. 7 of the Suppl. Information) identified 4199 genes in significantly gene denser domains than could be expected by chance (w = 19–59). These domains were 5.8 times gene denser than the genepoor domains. The significant clusters of genes with short introns include 2801 genes (w = 19–59). Their average intron length is 4.1 times shorter than in the clusters of genes with very long introns (11,915 bp. vs. 2879 bp.). There are 8534 genes that significantly cluster in GC-rich domains (w = 19–59), illustrating that these domains are larger than the other domains. Their average GC content is 50.0%, whereas the clusters of low GC density show an average GC content of 39.8%. The patterns of the significant clusters of extreme values for gene expression, gene density, intron length, and GC content are highly similar (Fig. 7 of the Suppl. Information).
Ridges Are Enriched in SINE Repeats and Antiridges in LINE Repeats
As a start, for a further analysis of sequence characteristics of ridges and antiridges, we analyzed the type of repeat sequences in the domains. SINE and LINE repeat densities were calculated in blocks of 20,000 bp. The repeat density was related to each gene in these blocks and moving medians (w = 49) along the chromosomes were calculated. Figure 1 shows the values of the SINE repeats and the inverse value for the LINE repeats for chromosome 9. Ridges are clearly enriched for SINE repeats, but depleted for LINE repeats. Similar profiles were found for the other chromosomes (see Fig. 6 of the Suppl. Information). A significant positive correlation was found between ranks of individual genes (w = 1) for gene expression and SINE repeat density (P < 10–100) as well as (inverse) LINE repeat density (P < 10–72; Spearman rank correlation test; Press et al. 1997). Two-dimensional histograms of SAGE rank versus SINE density rank and inverse LINE density ranks (w = 49) confirms the correlations (Fig. 2D,E).
Ridges and Antiridges Are Open to Tissue-Specific Regulation
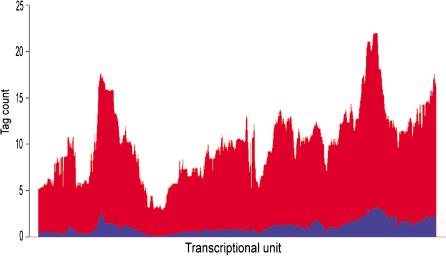
Consistent with our previous radiation-hybrid based analysis (Caron et al. 2001), the HTMseq shows that the median gene expression in ridges is high in all analyzed tissues. This is evident from the expression pattern of the 62 SAGE libraries of a range of tissues shown in the left panel of Figure 1. We further visualized this for chromosome 6 by analyzing the gene expression pattern (w = 49) for six different compound SAGE libraries of specific tissues (Fig. 8 of the Suppl. Information). All tissues show increased gene expression in the ridge domain, and peaks are found in corresponding chromosomal regions. The high median expression of genes in ridges in all SAGE libraries (Fig. 1) suggests that their products are required in bulk for basic cellular functioning. Clusters of highly expressed genes were proposed to represent domains of housekeeping genes (Lercher et al. 2002). The HTMseq application enables close inspection of every chromosomal region (Fig. 4). Detailed inspection of a ridge on chromosome 9 (marked by a red bar in Fig. 1) shows that individual gene expression in 15 normal tissues can vary strongly from gene to gene and from tissue to tissue (Fig. 4A). Antiridges show a similar pattern. Most genes in an antiridge on chromosome 9 (blue bar in Fig. 1) are weakly or not at all expressed in normal tissues, but some genes have a fair expression in one or more tissues (Fig. 4B). This suggests that ridges are not the exclusive domain of house-keeping genes, but encode tissue-specific genes as well. This is further supported by a genome-wide analysis of the variability in gene expression. In SAGE libraries of 50,000 or more mRNA tags (n = 57), we determined the maximum expression level of each gene observed in any library, as well as the average expression level in all libraries. The moving medians (w = 49) of these two values for chromosome 9 reveal two highly similar graphs, each following the pattern of ridges and antiridges (Fig. 5). Therefore, ridges appear to be open to normal regulation by tissue-specific transcription factors.
Figure 5.
Both maximal and average gene expressions in a series of SAGE libraries follow the pattern of ridges and antiridges. The profiles of average (blue) and maximal (red) gene expression as found in 57 SAGE libraries of minimally 50,000 SAGE tags are shown for chromosome 9 (w = 49).
DISCUSSION
The significant clustering and correlation of extremes in gene expression, gene density, intron length, GC content, and repeat density identified a series of physical characteristics of ridges and defines a domain-like structure in the genome. These analyses integrate some previously observed statistical correlations between these parameters. The initial analysis of the human genome sequence described correlations between GC content and intron length and between GC content and gene density (Lander et al. 2001). A study of EST frequencies in dbEST showed that highly expressed genes have on average shorter introns (Castillo-Davis et al. 2002). Our physical analysis of ridges integrates all of these parameters in one higher order structure of the genome, closely related to gene expression regulation. The evolutionary age of ridges is unknown, as they have only been analyzed in the human genome. A similar analysis relating SAGE expression profiles to the yeast genome did not identify a ridge-like organization (Velculescu et al. 1997). Higher order structures implicated in gene regulation were observed in Drosophila, but they regarded spatial clusters of 10 to 30 genes with a dynamic expression pattern that correlated in different developmental stages and conditions (Spellman and Rubin 2002). Smaller clusters of mainly two or three adjacent genes with a correlated expression in varying tissues were identified in yeast (Cohen et al. 2000) and Caenorhabditis elegans (Roy et al. 2002). Such clusters, therefore, can have a high overall expression in one tissue, and a weak overall expression in another tissue. One of the remarkable observations of the human transcriptome map is that the patterns of highly and weakly expressed chromosomal regions are similar in all analyzed tissues. This does not exclude that spatial clusters of co-regulated genes also exist in the human genome, but we have not addressed this question in this study.
A major question arising from the physical characterization of the human ridges is how the expression levels in the domains are established. Two extremes can be envisaged, which are not mutually exclusive. In the simplest scenario, genes in ridges are autonomous and exclusively controlled by their own cis-acting regulatory sequences. This possibility is in line with a classical view on the basis of early transgenic mice studies: Expression of a β-globin transgene under control of its own locus control region was equivalent to the endogenous gene, independent of the chromosomal integration site (Talbot et al. 1989). When extrapolated to genes in general, ridges should represent clusters of highly expressed genes that are individually controlled by their own regulatory sequences. This model predicts that their clustering during evolution functioned to streamline posttranscriptional events like splicing and mRNA transport. Space constraints in the densely populated ridges could have limited intron lengths. However, the view that gene expression is solely regulated by cis-acting elements and independent of nuclear position is based on studies of a few genes only and β-globin may not be representative for the majority of genes, as it is, when active, one of the most highly expressed genes in the genome (cf. SAGE library GSM709 at http://www.ncbi.nlm.nih.gov/SAGE/, in which β-globin represents 4% of all transcript tags).
The alternative view brought forward by the finding that transcriptional domains are related to major physical parameters of the genome, is that ridges globally govern the expression levels of their embedded genes. At the same time, we observe that the expression level of genes within ridges is variable and can be regulated in a tissue-specific way. This would imply a dual regulation of expression levels. Expression levels would be determined by specific transcription factors controlling individual genes, as well as by factors that exert their control at the level of ridges. Such factors could govern chromatin conformation, position in the nucleus, or local concentrations of general transcription factors.
The chromosomal profiles show a striking enrichment of ridges for SINE repeats, whereas they are depleted for LINE repeats. A correlation between SINE repeat density, GC content, and gene density was observed previously, as well as a correlation between LINE density and AT-rich regions (for review, see Lander et al. 2001). The depletion of LINE repeats in the GC-rich ridges and the increased density in AT-rich regions can mechanistically be explained by the preferred cleavage site of LINE endonuclease (TTTTA) and functionally by describing LINE repeats as endo-symbionts that avoid deleterious integrations in gene-dense ridge domains. However, the concordance of SINE-rich domains and ridges is less easy to interpret. Although the evolutionary age of ridges is unknown, the co-occurrence of a series of elementary chromosomal parameters in ridges suggests them to be a fundamental structure in the genome, which we expect to be evolutionarily older than the relatively young SINE elements of the genome. Alu repeats represent the majority of SINE elements and most of them integrated <75 Mya (Lander et al. 2001). If ridges are more ancient structures, why are they targeted by SINE repeats? Interestingly, the HIV virus was found recently to have a strong preference for integration in vivo in gene-dense regions and the map of the integration sites suggests a pattern corresponding to ridges (Schroder et al. 2002). HIV integration in vitro follows a random pattern, indicating that the preferred integration in vivo in gene-dense domains is not sequence dependent, but a result of in vivo properties of the genome, like chromatin conformation or transcriptional activity (Schroder et al. 2002). A similar mechanism may explain frequent SINE integrations in ridges. A further analysis of repeat-subtypes in ridges and antiridges, as well as an analysis of the evolutionary age of ridges, is necessary to understand these patterns. The HTMseq enables the analysis of transcriptional domains at the sequence level, which might identify sequence elements with a regulatory role in maintaining these higher order structures and in the organization of long-range transcriptional domains. In addition, the HTMseq provides a powerful tool to analyze cancer-specific gene expression in a chromosomal context.
METHODS
(See Supplemental Information)
Acknowledgments
This research was supportedby grants from the Netherlands Organization for Scientific Research (NWO BMI 050.50.201), the A. Meelmeijer fund ,and the Stichting Kindergeneeskundig Kankeronderzoek (SKK). H.J.B. was partly supported by NIH grant LM007276.
The publication costs of this article were defrayed in part by payment of page charges. This article must therefore be hereby marked “advertisement” in accordance with 18 USC section 1734 solely to indicate this fact.
Article and publication are at http://www.genome.org/cgi/doi/10.1101/gr.1649303. Article published online before print in August 2003.
[Supplemental material is available online at www.genome.org. The HTMseq application is available online at http://bioinfo.amc.uva.nl/HTMseq].
References
- Benjamini, Y.I. and Hochberg, Y. 1995. Controlling the false discovery rate: A practical and powerful approach to multiple testing. J. R. Stat. Soc. Ser. B Meth. 57: 289–300. [Google Scholar]
- Caron, H., van Schaik, B., van der Mee, M., Baas, F., Riggins, G., van Sluis, P., Hermus, M.C., van Asperen, R., Boon, K., Voute, P.A., et al. 2001. The human transcriptome map: Clustering of highly expressed genes in chromosomal domains. Science 291: 1289–1292. [DOI] [PubMed] [Google Scholar]
- Castillo-Davis, C.I., Mekhedov, S.L., Hartl, D.L., Koonin, E.V., and Kondrashov, F.A. 2002. Selection for short introns in highly expressed genes. Nat. Genet. 31: 415–418. [DOI] [PubMed] [Google Scholar]
- Cohen, B.A., Mitra, R.D., Hughes, J.D., and Church, G.M. 2000. A computational analysis of whole-genome expression data reveals chromosomal domains of gene expression. Nat. Genet. 26: 183–186. [DOI] [PubMed] [Google Scholar]
- Fujii, T., Dracheva, T., Player, A., Chacko, S., Clifford, R., Strausberg, R.L., Buetow, K., Azumi, N., Travis, W.D., and Jen, J. 2002. A preliminary transcriptome map of non-small cell lung cancer. Cancer Res. 62: 3340–3346. [PubMed] [Google Scholar]
- Lal, A., Lash, A.E., Altschul, S.F., Velculescu, V., Zhang, L., McLendon, R.E., Marra, M.A., Prange, C., Morin, P.J., Polyak, K., et al. 1999. A public database for gene expression in human cancers. Cancer Res. 59: 5403–5407. [PubMed] [Google Scholar]
- Lander, E.S., Linton, L.M., Birren, B., Nusbaum, C., Zody, M.C., Baldwin, J., Devon, K., Dewar, K., Doyle, M., FitzHugh, W., et al. 2001. Initial sequencing and analysis of the human genome. Nature 409: 860–921. [DOI] [PubMed] [Google Scholar]
- Lercher, M.J., Urritia, A.O., and Hurst, L.D. 2002. Clustering of housekeeping genes provides a unified model of gene order in the human genome. Nat. Genet. 6: 180–183. [DOI] [PubMed] [Google Scholar]
- Press, W.H., Teukolsky, S.A., Vetterling, W.T., and Flannery, B.P. 1997. Numerical recipes in C. 2nd ed., Cambridge University Press, Cambridge, UK.
- Roy, P.J., Stuart, J.M., and Kim, S.K. 2002. Chromosomal clustering of muscle-expressed genes in Caenorhabditis elegans. Nature 418: 975–979. [DOI] [PubMed] [Google Scholar]
- Schroder, A.R.W., Shinn, P., Chen, H., Berry, C., Ecker, J.R., and Bushman, F. 2002. HIV-1 integration in the genome favors active genes and local hotspots. Cell 110: 521–529. [DOI] [PubMed] [Google Scholar]
- Spellman, P.T. and Rubin, G.M. 2002. Evidence for large domains of similarly expressed genes in the Drosophila genome. J. Biol. 1: 5 (http://jbiol.com/content/1/1/5). [DOI] [PMC free article] [PubMed]
- Talbot, D., Collis, P., Antoniou, M., Grosveld, F., and Greaves, D.R. 1989. A dominant control region from the human β-globin locus conferring integration site-independent gene expression. Nature 338: 352–355. [DOI] [PubMed] [Google Scholar]
- Velculescu, V.E., Zhang, L., Vogelstein, B., and Kinzler, K.W. 1995. Serial analysis of gene expression. Science 270: 484–487. [DOI] [PubMed] [Google Scholar]
- Velculescu, V.E., Zhang, L., Zhou, W., Vogelstein, J., Basrai, M.A., Bassett Jr., D.E., Hieter, P., Vogelstein, B., and Kinzler, K.W. 1997. Characterization of the yeast transcriptome. Cell 88: 243–251. [DOI] [PubMed] [Google Scholar]
WEB SITE REFERENCES
- http://genome.ucsc.edu/; UCSC Genome Bioinformatics.
- http://www.ncbi.nlm.nih.gov/SAGE; NCBI CGAP SAGE project
- http://bioinfo.amc.uva.nl/HTMseq; HTMseq Web site.


