Abstract
A major problem in studying biological traits is understanding how genes work together to provide organismal structures and functions. Conventional reductionist paradigms attribute functions to particular proteins, motifs, and amino acids. An equally important but harder problem involves the synthesis of data at fundamental levels of biological systems to understand functionality at higher levels. We used subtle, naturally occurring, multigenic variation of cardiovascular (CV) properties in a panel of genetically randomized strains that are derived from the A/J and C57BL/6J strains of mice to perturb CV functions in nonpathologic ways. In this proof-of-concept study, computational analysis correctly identified the known relations among CV properties and revealed functionality at higher levels of the CV system. The network was then used to account for pleiotropies and homeostatic responses in single gene mutant mice and in mice treated with a pharmacologic agent (anesthesia). The CV network accounted for functional dependencies in complementary ways to the insights obtained from genetic networks and biochemical pathways. These networks are therefore an important approach for defining and characterizing functional relations in complex biological systems in health and disease.
A central problem in biological research is understanding how the products of individual genes act together to produce complex biological structures, functions, and systems (Ideker et al. 2001a; Kitano 2001, 2002; Gilman and Arkin 2002). Conventional approaches are often reductionist with methods such as hierarchical analysis (Eisen et al. 1998), cluster analysis (Duda and Hart 1973; Ramoni et al. 2002), factor analysis (Cureton and D'Agostino 1983; Stevens 1986), gene expression networks (Hughes et al. 2000; Ideker et al. 2001b; Davidson et al. 2002; Ernest et al. 2002), relevance networks (Butte et al. 2000), path analysis (Wright 1921, 1978; Li 1975; Rao 2000), genetical genomics (Jansen and Nap 2001; Stoll et al. 2001; Brem et al. 2002; Steinmetz et al. 2002), and correlation metrics (Thompson 1957; Arkin et al. 1997; Huang et al. 2002; Segre et al. 2002; Toh and Horimoto 2002) focusing ultimately on attributing functions to individual genes and molecules. These methods identify subsets of functionally related traits and characterize networks of molecular interactions. It is unclear, however, whether an understanding of complex systems at higher levels of biological functionalities, including homeostatic and pleiotropic responses to genetic, pharmacologic, and environmental perturbations will necessarily emerge simply from a detailed characterization of component traits (von Bartalanffy 1969).
Because of the inherent difficulty of understanding complex systems when studying them in a single state, investigators generally use genetic, pharmacological and environmental manipulations to perturb biological systems and thereby infer relations by comparing attributes at different states. Two classes of perturbations are being used. The first class is based on a series of single perturbations such as genetic mutations, chemical or pharmacological treatments, and environmental manipulations (Wagner 2001; cf. Hughes et al. 2000; Ideker et al. 2001b; Davidson et al. 2002; Ernest et al. 2002; Segre et al. 2002). An advantage of this paradigm is that causality is established; each perturbation is a cause and the various perturbation outcomes are consequences. A limitation is that many of these perturbations have strong biological effects, making it difficult to distinguish functional relations that exist under normal conditions from those that emerge when the normal functionality of a system is compromised. To address this concern, heterozygous rather than homozygous mutants have been used because their phenotypic effects are generally more subtle (Ernest et al. 2002). This approach retains the ability to establish causal relations and defines networks that have a greater proportion of normal functionality.
The second class involves the use of multiple rather than single perturbations. For genetic perturbations, this can be accomplished by using populations that are segregating for naturally occurring, multigenic variation with relatively subtle and nonpathologic phenotypic effects (Jansen and Nap 2001; Stoll et al. 2001; Brem et al. 2002; Klose et al. 2002; Steinmetz et al. 2002). This approach has properties of factorial studies where “any conclusion...has a wider inductive basis when inferred from an experiment in which the quantities of other ingredients have been varied...” (Fisher 1935). Approaches based on subtle, naturally occurring, nonpathological variation define reference networks that describe the structure and function of a system under normal conditions. These reference networks can then be used to evaluate the pleiotropic and homeostatic consequences of single gene mutations, modifier genes, and pharmacological and environmental perturbations that have more dramatic effects. This paradigm has the dual benefits of revealing the homeostatic functionality of complex biological systems as well as providing a conceptual and evidentiary framework for characterizing the diverse biological and clinical correlates of related diseases.
Genetically Randomized Populations
Several kinds of genetically randomized populations can be used for network analysis, including intercross and backcross segregating populations (Jansen and Napp 2001; Stoll et al. 2001; Brem et al. 2002; Klose et al. 2002; Steinmetz et al. 2002), recombinant inbred (RI) strains (Bailey 1981), and recombinant congenic strains (Demant and Hart 1986). Although the limitations of RI strains in complex trait analysis are widely recognized (Darvasi 1998), their unique genetic constitution can be used in a powerful way for network analysis, because the primary goal is to measure the tendency of different traits to cosegregate rather than to map genes. The probability that a pair of independent Mendelian traits will cosegregate by chance in two RI strains is 50%; multigenic traits may show a lower tendency for coincidental cosegregation depending on the number of genes that are involved. For a panel of 21 strains, the probability of coincidental cosegregation for a pair of Mendelian traits is <10–6 (=[0.5]20), where in general [0.5]g(n–1) where g is the number of independently segregating trait-controlling genes and n is the number of strains. Thus, because of their unique patterns of genetic randomization, RI strains provide remarkable statistical power to measure tendencies of traits to cosegregate. Indeed, assessing cosegregation of phenotypes was one of the original motivations for developing recombinant inbred strains (Bailey 1956, 1981). Another important feature of RI strains is that, because they are inbred and genetically defined populations, repeated assays can be made so that phenotypes of each strain can be systematically characterized with a rigor that is often not possible in segregating populations. Moreover, because data are cumulative across assays, studies and research groups, detailed data can be analyzed and trait relationships discovered that might not have been expected otherwise.
Cardiovascular System as a Model for Network Analysis
We selected the cardiovascular (CV) system as a proof-of-concept test for the computational methods because relationships among the various aspects of CV function have been extensively characterized (Guyton et al. 1972; Lilly 1993; Noble 2002). In this test, segregation of genes that control nonpathological variation in a genetically randomized population, here a panel of recombinant inbred (RI) strains, was used to perturb CV traits. In particular, we asked whether assays correctly predicted the known relationships among pairs of CV traits as well as how these traits interact to provide normal, higher order CV functionality.
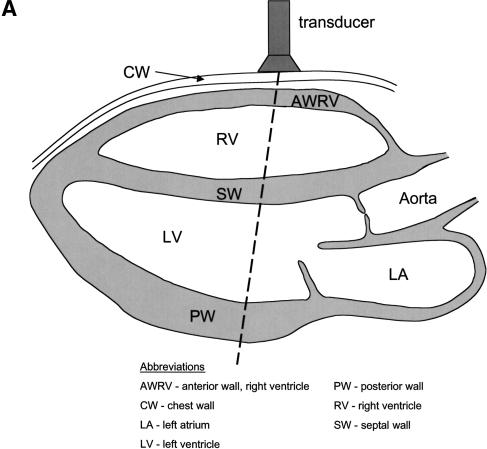
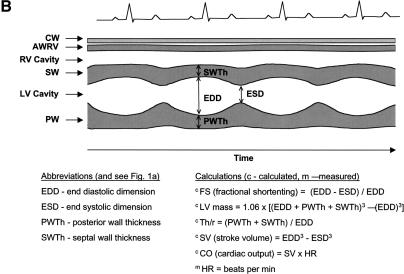
Important attributes of proof-of-concept systems for network analysis include assays for intermediate phenotypes that measure traits that act between the primary action of the gene and the end-phenotype. The CV system satisfies these requirements. The CV system pumps blood to deliver oxygen to cells and eliminate carbon dioxide (Guyton et al. 1972; Lilly 1993; Noble 2002). CV performance is coordinately controlled with the related respiratory, neural, and hematological systems. Key variables of the cardiac pump can be understood in the context of its fundamental properties. The heart has the ability to shorten (change ventricular dimensions) and generate both pressure and flow. These in turn are related to percent fractional shortening (FS), left ventricular (LV) mass, the geometric factor “relative wall thickness” (Th/r, the ratio of ventricular wall thickness to the radius of the ventricular cavity), and cardiac output (CO) (Fig. 1A,Fig. 1B,Fig. 1C). FS is derived from the end-diastolic and end-systolic dimensions (EDD, ESD), LV mass from septal and posterior wall thicknesses (SWTh, PWTh), and CO from stroke volume (SV) and heart rate (HR). Established echocardiographic methods measure these traits in a high-throughput, reliable, reproducible, and cost-effective manner (Hoit and Nadeau 2001; Hoit et al. 2002).
Figure 1.
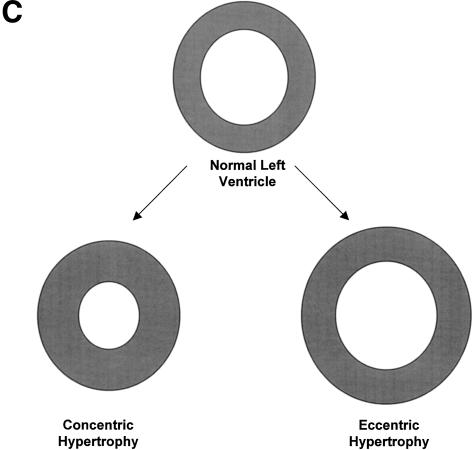
Anatomy of the left ventricle showing the various measurements and how they were used to calculate other measures of CV functions. (A) A schematic illustration of the heart showing the position of the transducer in transthoracic echocardiography. (B) A schematic illustration of an echocardiogram obtained with the transducer in the position shown in A. The wall thicknesses and left ventricular dimensions are labeled. (C) Concentric vs. eccentric hypertrophy. In concentric hypertrophy, wall thickness increases at the expense of cavity dimensions, so relative wall thickness increases, whereas in eccentric hypertrophy, wall thickness and cavity dimensions change proportionally, so relative wall thickness remains unchanged.
RESULTS
Building the Network of CV Traits
The CV network was built in four steps: (1) a comprehensive panel of CV traits as well as exercise endurance and body weight were typed on a panel of AXB/BXA RI strains; (2) cosegregation was measured for all pairs of traits with correlation analysis, retaining the direction and magnitude of the tendency to cosegregate; (3) a statistical threshold, with permutation tests that incorporate adjustments for multiple testing, was used to restrict the analysis to the strongest patterns of cosegregation; and (4) networks were extracted from the matrix of cosegregation measures by identifying traits that had at least one significant relation with other traits.
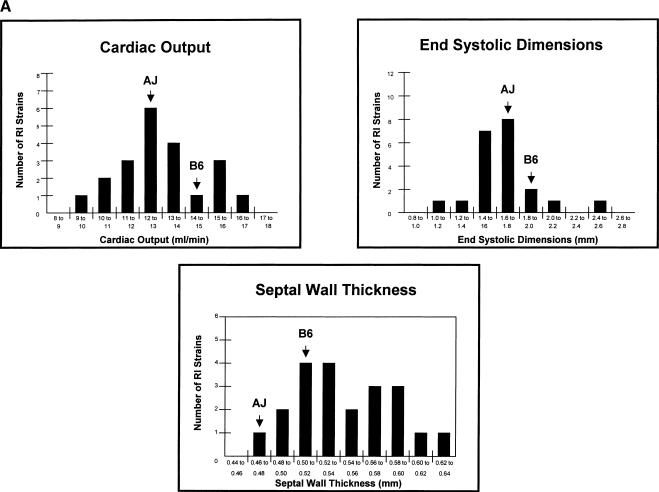
The first step in the network analysis was to use a series of high throughput, reliable and sensitive echocardiographic and treadmill assays for CV traits, exercise time, and body weight (Hoit and Nadeau 2001; Hoit et al. 2002) to type the A/J and C57BL/6J progenitor strains and 21 AXB/BXA RI strains. Many of these traits differed between the parental strains and segregated among the RI strains (Table 1). None of these trait values represented adverse pathology, but instead constituted genetically controlled differences within the normal range of variation. Several traits did not differ significantly between the A/J and C57BL/6J progenitor strains, but segregated in the RI strains (Table 1), a circumstance that occurs when strains are phenotypically similar for different genetic reasons. None of the differences in CV properties segregated as Mendelian traits in the RI strains, but instead showed multiple modes or continuous variation that was consistent with multigenic control (e.g., Fig. 2A).
Table 1.
CV Trait Mean, Standard Deviation and Sample Size in A/J, C57BL/6J and AXB/BXA RI Strains
| Strain | N | Stat | PWTh | SWTh | EDD | ESD | FS | LV Mass | BW | LV/BW | TH/R | SV | HR | EST | CO |
|---|---|---|---|---|---|---|---|---|---|---|---|---|---|---|---|
| A/J | mean | 0.46 | 0.47 | 2.91 | 1.61 | 50.66 | 43.00 | 22.70 | 1.88 | 0.31 | 28.16 | 462.00 | 6.61 | 12.85 | |
| SD | 0.08 | 0.07 | 0.36 | 0.56 | 11.18 | 11.54 | 3.13 | 0.36 | 0.03 | 7.60 | 75.10 | 2.74 | 3.25 | ||
| n | 44 | 44 | 44 | 44 | 44 | 44 | 39 | 39 | 44 | 44 | 10 | 44 | 10 | ||
| C57BL/6J | mean | 0.51 | 0.50 | 3.36 | 1.98 | 43.49 | 53.24 | 23.50 | 2.27 | 0.30 | 34.24 | 420.00 | 13.56 | 14.27 | |
| SD | 0.05 | 0.06 | 0.40 | 0.46 | 10.84 | 9.80 | 3.92 | 0.26 | 0.05 | 6.29 | 40.00 | 3.72 | 2.42 | ||
| n | 44 | 44 | 44 | 44 | 44 | 44 | 44 | 44 | 44 | 44 | 10 | 44 | 10 | ||
| AXB1 | 23 | mean | 0.59 | 0.59 | 3.34 | 1.85 | 44.63 | 58.75 | 25.78 | 2.29 | 0.35 | 31.52 | 422.61 | 9.23 | 13.24 |
| SD | 0.08 | 0.09 | 0.33 | 0.32 | 7.26 | 15.48 | 4.73 | 0.54 | 0.06 | 9.39 | 51.89 | 4.85 | 3.82 | ||
| AXB2 | 18 | mean | 0.54 | 0.52 | 3.23 | 1.57 | 51.54 | 49.08 | 21.00 | 2.31 | 0.33 | 30.32 | 528.33 | 13.40 | 15.9 |
| SD | 0.04 | 0.04 | 0.30 | 0.29 | 5.55 | 10.27 | 3.74 | 0.36 | 0.03 | 8.60 | 67.58 | 5.81 | 4.26 | ||
| AXB4 | 14 | mean | 0.53 | 0.47 | 2.67 | 1.11 | 58.44 | 32.54 | 16.86 | 1.92 | 0.37 | 18.02 | 537.86 | 3.14 | 9.77 |
| SD | 0.08 | 0.06 | 0.23 | 0.20 | 6.54 | 8.63 | 2.96 | 0.34 | 0.05 | 4.50 | 67.05 | 1.13 | 2.86′ | ||
| AXB5 | 27 | mean | 0.56 | 0.56 | 3.02 | 1.47 | 51.58 | 46.88 | 21.30 | 2.22 | 0.37 | 24.85 | 475.56 | 11.69 | 11.74 |
| SD | 0.06 | 0.08 | 0.32 | 0.29 | 6.59 | 14.47 | 3.02 | 0.64 | 0.04 | 7.67 | 88.72 | 4.82 | 4.05 | ||
| AXB10 | 18 | mean | 0.55 | 0.55 | 3.14 | 1.71 | 46.23 | 49.18 | 21.17 | 2.33 | 0.35 | 26.50 | 523.33 | 12.74 | 13.72 |
| SD | 0.06 | 0.07 | 0.38 | 0.43 | 8.65 | 15.07 | 2.41 | 0.70 | 0.03 | 7.83 | 67.65 | 2.76 | 4.21 | ||
| AXB11 | 9 | mean | 0.58 | 0.56 | 3.19 | 1.60 | 50.61 | 52.38 | 31.67 | 1.64 | 0.37 | 29.89 | 446.67 | 9.16 | 12.62 |
| SD | 0.07 | 0.06 | 0.55 | 0.52 | 10.60 | 16.64 | 6.65 | 0.31 | 0.09 | 13.93 | 94.21 | 4.51 | 5.07 | ||
| AXB12 | 19 | mean | 0.50 | 0.50 | 3.20 | 1.76 | 44.12 | 45.74 | 23.24 | 1.94 | 0.30 | 28.87 | 417.09 | 5.07 | 12.2 |
| SD | 0.07 | 0.07 | 0.43 | 0.35 | 7.44 | 9.57 | 4.61 | 0.34 | 0.05 | 6.42 | 98.32 | 2.41 | 4.17 | ||
| AXB15 | 22 | mean | 0.62 | 0.63 | 3.15 | 1.51 | 52.05 | 57.30 | 29.50 | 2.00 | 0.40 | 28.10 | 455.45 | 9.34 | 12.79 |
| SD | 0.08 | 0.10 | 0.26 | 0.26 | 7.63 | 12.30 | 5.97 | 0.51 | 0.08 | 7.06 | 72.69 | 2.95 | 3.8 | ||
| AXB18 | 24 | mean | 0.58 | 0.57 | 3.38 | 1.84 | 46.68 | 57.96 | 24.09 | 2.41 | 0.35 | 32.97 | 470.63 | 9.23 | 15.31 |
| SD | 0.05 | 0.04 | 0.49 | 0.57 | 10.01 | 13.80 | 4.10 | 0.40 | 0.07 | 11.22 | 72.39 | 2.64 | 5.31 | ||
| AXB24 | 13 | mean | 0.53 | 0.54 | 2.93 | 1.46 | 50.46 | 42.11 | 28.46 | 1.47 | 0.37 | 22.94 | 461.54 | 10.61 | 10.42 |
| SD | 0.06 | 0.07 | 0.38 | 0.30 | 5.06 | 13.99 | 6.16 | 0.33 | 0.05 | 8.53 | 49.81 | 3.32 | 3.41 | ||
| BXA1 | 6 | mean | 0.58 | 0.58 | 3.30 | 2.06 | 37.50 | 54.87 | 28.00 | 1.98 | 0.35 | 27.15 | 405.00 | 8.82 | 11.26 |
| SD | 0.04 | 0.05 | 0.22 | 0.24 | 4.44 | 5.70 | 3.74 | 0.28 | 0.04 | 5.47 | 79.94 | 2.06 | 4.63 | ||
| BXA2 | 12 | mean | 0.48 | 0.51 | 3.25 | 1.57 | 51.87 | 44.66 | 26.42 | 1.71 | 0.31 | 31.55 | 490.00 | 9.43 | 15.61 |
| SD | 0.06 | 0.06 | 0.37 | 0.24 | 3.87 | 12.32 | 3.70 | 0.47 | 0.04 | 10.52 | 34.64 | 2.54 | 5.75 | ||
| BXA4 | 8 | mean | 0.48 | 0.49 | 3.05 | 1.50 | 48.60 | 44.13 | 24.06 | 1.71 | 0.30 | 29.33 | 488.42 | 5.43 | 14.58 |
| SD | 0.10 | 0.10 | 0.67 | 0.35 | 9.20 | 14.21 | 4.38 | 0.49 | 0.07 | 11.15 | 78.97 | 3.06 | 6.21 | ||
| BXA7 | 10 | mean | 0.51 | 0.51 | 3.08 | 1.69 | 45.17 | 42.38 | 25.70 | 1.67 | 0.33 | 24.44 | 540.00 | 5.68 | 13.19 |
| SD | 0.06 | 0.04 | 0.25 | 0.32 | 8.11 | 8.83 | 4.08 | 0.31 | 0.03 | 5.59 | 63.25 | 1.85 | 3.4 | ||
| BXA8 | 11 | mean | 0.59 | 0.58 | 2.95 | 1.36 | 54.31 | 46.77 | 26.45 | 1.79 | 0.40 | 23.72 | 540.00 | 6.13 | 12.75 |
| SD | 0.03 | 0.04 | 0.30 | 0.28 | 5.60 | 7.80 | 5.22 | 0.27 | 0.05 | 6.82 | 37.95 | 1.36 | 3.43 | ||
| BXA12 | 10 | mean | 0.50 | 0.51 | 3.01 | 1.60 | 48.40 | 39.97 | 23.05 | 1.75 | 0.35 | 23.60 | 499.50 | 5.87 | 11.43 |
| SD | 0.05 | 0.05 | 0.45 | 0.56 | 11.44 | 9.21 | 4.18 | 0.35 | 0.07 | 7.80 | 74.85 | 1.96 | 2.99 | ||
| BXA14 | 15 | mean | 0.61 | 0.61 | 3.36 | 1.72 | 49.10 | 62.01 | 26.93 | 2.31 | 0.36 | 33.60 | 504.00 | 4.76 | 16.7 |
| SD | 0.04 | 0.04 | 0.36 | 0.36 | 6.97 | 15.50 | 4.27 | 0.43 | 0.03 | 9.90 | 98.33 | 1.57 | 5.24 | ||
| BXA16 | 9 | mean | 0.48 | 0.48 | 3.19 | 1.69 | 47.08 | 41.52 | 23.00 | 1.83 | 0.30 | 27.59 | 440.00 | 5.98 | 12.2 |
| SD | 0.05 | 0.04 | 0.19 | 0.23 | 5.59 | 7.50 | 4.18 | 0.29 | 0.03 | 4.97 | 67.08 | 2.06 | 3.1 | ||
| BXA24 | 19 | mean | 0.55 | 0.52 | 3.76 | 2.40 | 36.09 | 63.06 | 26.32 | 2.41 | 0.29 | 39.43 | 348.95 | 5.37 | 13.62 |
| SD | 0.07 | 0.06 | 0.28 | 0.30 | 5.46 | 9.68 | 3.56 | 0.34 | 0.04 | 8.37 | 62.62 | 2.98 | 3.23 | ||
| BXA25 | 19 | mean | 0.53 | 0.53 | 2.94 | 1.45 | 50.94 | 40.89 | 27.26 | 1.51 | 0.36 | 22.84 | 473.68 | 4.99 | 10.77 |
| SD | 0.06 | 0.05 | 0.29 | 0.24 | 4.89 | 8.23 | 4.81 | 0.23 | 0.05 | 6.32 | 68.98 | 1.56 | 3.26 | ||
| BXA26 | 29 | mean | 0.53 | 0.52 | 3.16 | 1.74 | 45.58 | 46.87 | 23.80 | 1.93 | 0.34 | 27.46 | 458.28 | 6.43 | 12.65 |
| SD | 0.06 | 0.06 | 0.52 | 0.50 | 8.68 | 18.22 | 4.07 | 0.49 | 0.05 | 13.21 | 77.28 | 2.65 | 6.24 |
Figure 2.
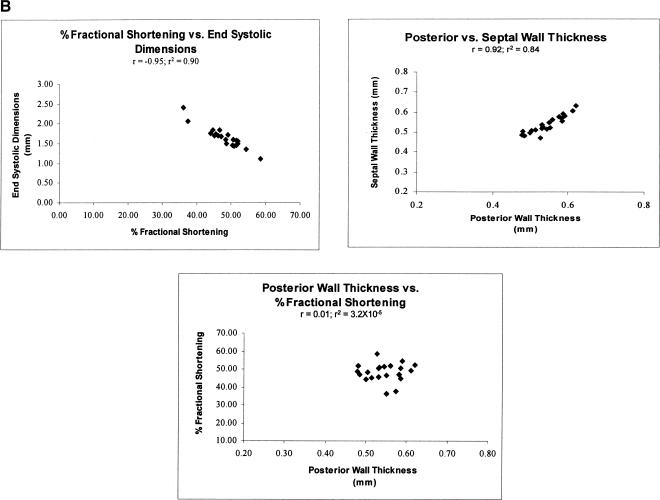
Frequency distributions and cosegregation patterns for selected CV traits. (A) Frequency distribution of mean values for selected CV traits among the AXB/BXA RI strains. The mean values for the parental strains are marked. (B) Cosegregation of selected CV traits among the 21 AXB/BXA RI strains.
The third step was to identify statistically significant measures of cosegregation. To deal with trait data that were not normally distributed and to address the issue of multiple testing, permutation tests were used to estimate significance thresholds. The threshold values were r = 0.66 for P < 0.05 and r = 0.72 for P < 0.01, after taking into account the penalties for multiple testing.
An important complication in the present study is the mixture of directly measured properties and those that were calculated from these direct measures. Measured and calculated properties are identified in Figure 1B. Calculated properties were sometimes correlated with measures that are themselves correlated with each other; for example, FS is a property that is calculated from EDD and ESD, both of which are direct measures, and FS, EDD, and ESD were all strongly correlated with each other (Figs. 3, 4). However, correlations among direct measures and calculated properties were not always observed. For example, Th/r is calculated as (PWTh + SWTh)/EDD), but PWTh and SWTh are correlated with each other but neither is correlated with EDD (Figs. 3, 4). The same applies to LV mass, which is calculated from EDD, PWTh, and SWTh (Figs. 3, 4). As a result, some but not all, correlations involving calculated properties result from correlations between the measures used in the calculations.
Figure 3.
Cosegregation of CV traits among the AXB/BXA RI strains. Gray cells indicate statistically significant correlations (P < 0.05, after correction for multiple testing).
Figure 4.
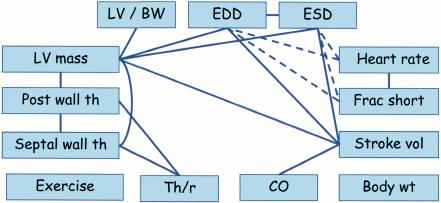
Network of CV traits. Solid lines indicate positive relationships and broken lines indicate inverse relationships. Abbreviations are described in the text.
A related complication involves statistical thresholds in studies that include both measured and calculated properties. This is an exceedingly complex issue, without easy or known solutions. We used permutations to obtain statistical thresholds for all properties and for direct measures and calculated properties separately. The thresholds for all properties were used to build the networks and the results were compared with networks based on thresholds estimated separately for direct measures and calculated properties, with largely concordant results.
The fourth step was to construct the network by identifying significant correlations from the cosegregation matrix and preserving the strength and direction of the cosegregation tendencies. Networks were then prepared that illustrate these relationships (Fig. 4).
The network for CV traits correctly revealed the known relationships among component traits and the manner in which they function together to provide normal CV functions. For example, the network showed the expected relationships among LV mass, EDD, PWTh, SWTh, and HR. LV mass should be positively correlated with EDD and with PWTh and SWTh because these properties are components of LV mass. In addition, HR should be inversely correlated with cardiac dimensions (EDD and ESD) because, with increased HR, diastole (EDD) is shortened resulting in less time for cardiac filling. The network correctly revealed each of these predicted relationships. Only EST and BW segregated independently of all other traits. Thus, in this proof-of-concept study the CV network correctly revealed the ways in which key traits work together to provide essential CV functions.
Pleiotropies, Homeostasis, and Networks
The CV network can be used to evaluate the complex phenotypes of mutant mice with engineered single gene mutations that adversely affect CV functions and mice treated with a pharmacologic agent, such as anesthesia, which affects CV functions.
In these comparisons, traits in the network were classified as significantly increased, decreased, or unchanged in mutant (or treated) versus wild-type (or untreated) mice. Trait relationships (correlations) may be maintained or lost depending on the way in which each component trait responds to the perturbation. With homeostatic responses, combinations of functionally related traits respond in correlated manners in an attempt to compensate for the effects of the perturbation. Alternatively, traits in mutant or treated individuals may change in manners opposite to those in the reference network because the nature of the perturbation compromises homeostasis. Finally, traits may not change significantly in the mutant or treated individual either because the trait is independent of the perturbation or because of complementary homeostatic responses of the system to the adverse functional effects of the perturbation.
For this analysis, a selection of reports describing mutant mice with cardiac pathologies was chosen from the literature. In each of these studies, echocardiography was performed on both mutant and wild-type control mice; these mice had significantly different phenotypes for many traits in the CV network. This analysis was limited by the restricted selection of traits measured in the various studies, the different anesthetic agents that were used, and the varied genetic backgrounds of the mutant mice. In addition, the depth and period of anesthesia relative to echocardiographic testing are uncertain suggesting a degree of caution in comparing results from different studies, given the known effects of anesthesia on heart rate (Vatner et al. 2002).
Many of these mutations affected the ratio between muscle mass (measured by thickness of the wall of the ventricle) and the ventricular volume (measured by the diameter of the ventricle). With eccentric hypertrophy, which is associated with volume overload, these two measures change proportionally, so the relative wall thickness remains unchanged. In contrast, in concentric hypertrophy, which results from pressure overload, wall thickness increases at the expense of the cavity dimensions, so relative wall thickness increases.
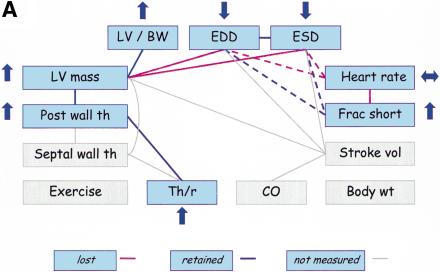
We evaluated FVB mice with concentric cardiac hypertrophy that results from cardiac-specific overexpression of calsequestrin (CSQ-OE) (Schmidt et al. 2000). Echocardiographic measurements in transgenic CSQ-OE mice as compared to wild-type controls revealed an increase in LV mass and a decrease in EDD and ESD (Fig. 5A). Therefore, the positive relationship between LV mass and ventricular dimensions is lost in these mice. Furthermore, HR in CSQ-OE mice is not significantly different from wild-type mice, so the relationships between HR and both ventricular dimensions and FS are also lost. Cardiac-specific overexpression of calsequestrin disturbs calcium homeostasis in cardiac myocytes, which in turn causes contractile dysfunction (Schmidt et al. 2000). CSQ-OE mice appear to compensate for the resulting increase in wall stress by increasing LV mass, PWTh, and Th/r, and by reducing ventricular dimensions. Therefore, the positive relationships among LVM, PWTh, and Th/r are maintained, whereas the positive relationships between LVM and ventricular dimensions are lost.
Figure 5.
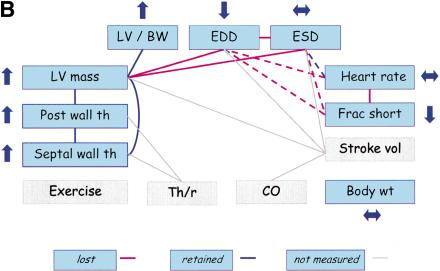
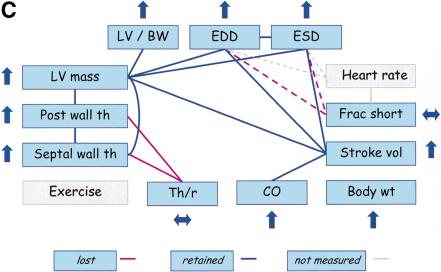
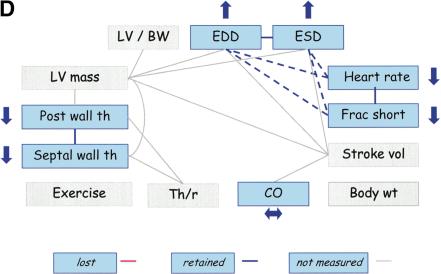
Trait relationships in mutant mice with CV pathology and mice treated with anesthesia. Traits not measured in the studies are highlighted in gray. Upward arrows indicate that the mutant (or treated) mice had significantly higher trait values than wild-type (or untreated) mice, and downward arrows indicate that the mutant (or treated) mice had significantly lower trait values than wild-type (or untreated mice). Double-headed (horizontal) arrows indicate an insignificant difference between mutant (or treated) and wild-type (or untreated) mice. The red lines indicate the PSN relationships that do not appear to be present in mutant (or treated) mice. (A) Trait relationships for mice with cardiac-specific overexpression of calsequestrin. Ten–12-wk-old mice were anesthetized with 2.5% Avertin (Schmidt et al. 2000). (B) Trait relationships in transgenic mice with overexpression of protein kinase C β2 isoform in myocardium. Eleven-wk-old mice were anesthetized with 2.5% Avertin (Wakasaki et al. 1999) (C) Trait relationships in transgenic mice with reduced brown fat. Twelve-wk-old mice were anesthetized with ketamine and xylazine (Cittadini et al. 1999). (D) Trait relationships in conscious and anesthetized mice. Twelve-wk-old mice were analyzed without anesthesia or with 2.5% tribromoethanol (Kiatchoosakun et al. 2001).
The next example involves transgenic mice with targeted overexpression of protein kinase C β2 (PKCβ) isoform in myocardium (FVB/N background), which exhibit left ventricular hypertrophy, fibrosis, and myocyte necrosis (Wakasaki et al. 1999). Echocardiographic measurements in mutant mice versus their wild-type controls show that LV mass, SWth, PWth, and LV/BW are increased as compared with wild-type mice, maintaining the relationships among these traits (Fig. 5B). In contrast, EDD decreases whereas ESD does not change significantly. Thus, the relationships between EDD and ESD, and between LV mass and ventricular dimensions, are lost. Similarly, the relationships among HR, FS, and ventricular dimensions are lost. PKCβ2 contributes to the regulation of myocyte growth because mice that overexpress PKCβ2 develop cardiac myocyte hypertrophy and increased extracellular matrix with no apparent changes in blood pressure (afterload) (Wakasaki et al. 1999). The resulting ventricular dysfunction was characterized by increased LV mass and wall thicknesses but decreased ventricular dimensions and FS.
Therefore, the relationships among ventricular dimensions, FS, and LVM were lost in these mice (Fig. 5B).
The third example involves transgenic mice with genetically ablated brown fat (UCP-DTA) that exhibit systemic hypertension and eccentric left ventricular hypertrophy (Cittadini et al. 1999). Echocardiographic measurements in UCP-DTA mice versus their wild-type controls indicate that the positive correlations between both PWTh and SWTh and Th/r are lost in UCP-DTA mice because both PWTh and SWTh increase whereas Th/r decreases (Fig. 5C). Likewise, because LV dimensions increase although FS remains unchanged, the negative correlations between these traits are lost. Other trait relationships appear to be maintained, however. Ablation of brown fat appears to induce volume overload with compensatory eccentric hypertrophy, which is demonstrated by increases in wall thicknesses and LV mass and an unchanged Th/r. Furthermore, loss of the relationship between FS and ventricular dimensions from the CV PSN may be due to the dual affects of increased afterload (hypertension) and increased preload in the overweight UCP-DTA mice (Cittadini et al. 1999).
The same approach can be used to evaluate the pleiotropic effects of pharmacologic treatments such as anesthesia on the CV functions. We compared the echocardiographic measurements in mice given 2.5% tribromoethanol anesthesia with measurements in conscious mice (Kiatchoosakun et al. 2001). As expected, short-term anesthesia did not compromise homeostatic relations in the CV network, which instead showed correlated changes in the expected directions for the measured traits (Fig. 5D). More thorough analyses of the effects of pharmacologic treatments on the trait relationships from the network are needed to confirm that the network is minimally compromised (if at all) after short-term pharmacologic treatments, such as anesthesia.
DISCUSSION
This proof-of-concept study demonstrates the utility of correlation metrics for defining higher order functionalities among naturally occurring variants in genetically randomized populations, such as recombinant inbred strains. This logistically and computationally simple method defined reference networks of normal functions. These reference networks were then used evaluate the homeostatic and dysfunctional pleiotropies that result from single gene and pharmacologic perturbations. By validating the computational methods on well-documented functional relations in the CV system (Guyton et al. 1972; Lilly 1993; Noble 2002), this approach can be used with confidence either to annotate the CV network with additional features, such as gene expression patterns, proteomics, blood chemistries, and other physiological attributes, or to characterize networks in the absence of prior information about the structure or function of complex systems. This approach can also be combined with linkage and molecular studies to link functional networks with genetic effects and molecular interactions in health and disease.
Single Versus Multiple Perturbations
Typically, a series of single perturbations with strong effects are used to infer causal relationships in studies of biological systems (Wagner 2001; cf. Hughes et al. 2000; Ideker 2001b; Davidson et al. 2002; Ernest et al. 2002). Despite its compelling conceptual and experimental power, each genetic, pharmacological, and environmental perturbation requires a separate test. As a result, scaling this paradigm to test the effects of numerous perturbations is logistically challenging, especially in vertebrates. Moreover, because these strong perturbations usually have several homeostatic and dysfunctional phenotypic effects, normal and abnormal relationships are difficult to distinguish. This problem is especially serious when prior evidence about the structure of the functional network under normal conditions is not already known or is not obtained directly in the particular study.
An emerging alternative is based on the simultaneous use of multiple perturbations such as can be achieved in genetically randomized populations where numerous functional variants segregate simultaneously (Jansen and Napp 2001; Stoll et al. 2001; Brem et al. 2002; Klose et al. 2002; Steinmetz et al. 2002). This approach has many important attributes of factorial design (Fisher 1935) where a series of phenotypic assays in a modest number of individuals or strains reveal the structure of complex functional networks. Moreover, by focusing on naturally occurring, nonpathological variation, the resulting network reveals functional relations among normal biological variants. These reference networks can then be used to interpret the stronger consequences of single perturbations. These comparisons reveal aspects of systems that are functionally compromised, aspects that are unaffected by the perturbation, and aspects that respond in a homeostatic manner as part of the system's response to dysfunctional relationships.
Genetically Randomized Populations
Various kinds of genetically randomized populations have been used for studying complex biological systems. To date, most studies have used segregating populations (Stoll et al. 2001; Brem et al. 2002; Klose et al. 2002; Steinmetz et al. 2002). The present study is the first to use genetically randomized but inbred strains. Panels of RI strains are available for a variety of species including mice (Taylor 1996), rats (Kren et al. 1999), and several plants species (Alonso-Blanco et al. 1998). In mice, RI strains, in particular those derived from the A/J and C57BL/6J progenitor strains, have many useful attributes for studying complex biological systems. Many genetic resources have been developed from these progenitor strains, including these AXB/BXA RI strains (Sampson et al. 1998; Prows and Horner 2002), recombinant congenic strains (Fortin et al. 2001), and chromosome substitution strains (Nadeau et al. 2000; J. Singer, A. Hill, L. Burrage, K. Olszens, J. Song, W. O'Brien, D. Conti, J. Witle, E. Lander, and J. Nadeau, in prep.). In addition, an extraordinary variety of traits differ between these strains ranging from birth defects, such as cleft lip and palate, and adult diseases, such as atherosclerosis to aging (Nadeau et al. 1995; Festing 1996; Paigen and Epping 2000). Many spontaneous and engineered mutations have been made congenic on the C57BL/6J background and can be used to perturb biological systems in more dramatic ways (Ernest et al. 2002) to test pleiotropy and homeostasis. These mouse resources and genetic strategies together with the various experimental and computational methods provide a powerful platform for defining the structure and function of complex systems in a medically relevant mammalian model organism.
Accelerating Discovery of Functional Networks
This proof-of-concept study suggests that multifactorial perturbations of normal phenotypic variation can be used to accelerate discovery of functional networks in the absence of prior knowledge of the structure or function of complex systems. Functional relations in the CV system have been studied for decades (Guyton et al. 1972; Lilly 1993; Noble 2002) and this knowledge base served as a powerful foundation for this proof-of-concept study. Considerable computational research is underway to characterize the dynamics of other known pathways, networks, and systems (Ideker et al. 2001a; Kitano 2001, 2002; Gilman and Arkin 2002). However, many functional relations and networks remain to be discovered. As we show in this study, simply by surveying CV traits in genetically randomized populations, correlation metrics successfully replicated the known relations in the CV system. These results suggest that the structure of functional networks can be discovered in a hypothesis-free manner and that known relations among fundamental properties of CV and other functions can be defined simply by assaying normal, nonpathological variability in a modest number of genetically randomized strains.
METHODS
Mice
A/J, C57BL/6J, and the AXB/BXA recombinant inbred (RI) strains were obtained from the Jackson Laboratory. Only one member of the closely related strains that probably arose from mouse breeding problems was included in the study (Sampson et al. 1998). RI strains are derived from two progenitor inbred strains. Hybrids between these strains are intercrossed and their progeny crossed until the line is inbred. Because segregation, assortment, and recombination are random in each line and independent of events in other lines, each line has a unique and independent mix of the progenitor genomes. Each strain is composed of a 50:50 mix of the progenitor genomes and at each locus there is an equal chance to homozygose an allele from one of the two progenitor strains. Thus Mendel's rules ensure that each strain is an independent genetic randomization of the progenitor strain genomes.
Husbandry
Mice were maintained in ventilated cages under 12 h/12 h light–dark cycles. They were fed Harlan-Teklad 7013 diet ad libitum.
Echocardiography
Cardiac ultrasound studies were performed on eight-wk-old mice with an Acuson Sequoia ultrasonograph using a 15MHz transducer. Mice were lightly anesthetized with tribromoethanol (2.5% stock), 0.10 mg/10 gm i.p., and allowed to breathe spontaneously. The transducer was placed on a thin layer of warmed acoustic coupling gel applied to the left hemithorax with care taken to maintain adequate contact while avoiding excessive pressure on the chest. A warming pad (Deltaphase Isothermal Pad, Braintree Scientific) was used to maintain normothermia. Mice were imaged in the shallow left lateral decubitus using a depth setting of 2 cm in high-resolution mode. The transmit zone was adjusted to maximize the frame rates (166 Hz), resulting in a temporal resolution of ∼6 ms. 2D-targeted M-mode studies were taken from the short axis view at the level of the largest LV diameter. M-mode echocardiographic measurements included the LV minor axis dimension at end diastole (EDD) and end systole (ESD) and wall thickness at end diastole of the anterior (SWTh) and posterior walls (PWTh). EDD was measured at the widest LV diameter in diastole, and ESD was measured at the peak of posterior wall motion. Measurements were made using leading edge–leading edge methodology (American Society of Echocardiography); these were made online using the calculation package included on the ultrasonograph at a sweep speed of 200 mm/s. Three to five beats were averaged for each measurement.
Calculated M-mode echo variables included stroke volume (SV = EDD3–ESD3), left ventricular fractional shortening (FS = (EDD-ESD)/EDD), cardiac output (CO = SV × HR) and left ventricular mass (LV mass = 1.06 ×[(EDD + PWTh + SWTh)3 – (EDD)3]). LV mass was normalized for body weight (LV/BW).
Exercise
Animals were exercised on an open treadmill (Exer-3/6, Columbus Instruments) that incorporates an electrified grid at the rear of the belt to provide motivation. Mice were subjected to supervised, graded treadmill exercise by staged, 3-min increases in belt speed (2.5 m/min) until exhaustion. Exhaustion was defined as the mouse spending >50% of the time or >10 consecutive seconds on the shock grid (Desai et al. 1999). Up to six animals were exercised simultaneously. Additional information can be found in Hoit and Nadeau (2001) and Hoit et al. (2002).
Permutation Tests
Permutation tests were used to establish threshold for statistical significance (Churchill and Doerge 1994) and simultaneously to correct for penalties associated with multiple testing. The data were arranged in 13 columns (one for each trait) of length 21 (one for each of the RI strains). If two traits are uncorrelated, the row in which the individual data points are located is irrelevant. A column shuffle is then made and a different random perturbation applied to each column. The correlation matrix is then calculated for each pair of traits. The maximum correlation coefficient (absolute value) was recorded. This process was repeated 10,000 times, with the maximum correlation recorded for each permutation. This procedure of using the maximum correlation across each permutation of the entire matrix is called a “one step adjustment” for multiple testing. A copy of the analytical program used for this study is available at http://www.jax.org/staff/churchill/labsite under the data sets link.
Acknowledgments
We thank Michael Faulx for helping with the echocardiograms and Annie Hill and Keith Olszens for maintaining the mouse colonies. This work was supported by a grant from the Ohio Board of Reagents and a gift from the Charles B. Wang Foundation to the Center for Computational Genomics.
The publication costs of this article were defrayed in part by payment of page charges. This article must therefore be hereby marked “advertisement” in accordance with 18 USC section 1734 solely to indicate this fact.
Article and publication are at http://www.genome.org/cgi/doi/10.1101/gr.1186603.
References
- Alonso-Blanco, C., Koornneef, M., and Stam, P. 1998. The use of recombinant inbred lines (RILs) for genetic mapping. Methods Mol. Biol. 82: 137–146. [DOI] [PubMed] [Google Scholar]
- Arkin, A., Shen, P., and Ross, J. 1997. A test case for correlation metric construction of a reaction pathway from measurements. Science 277: 1275–1279. [Google Scholar]
- Bailey, D.W. 1956. A comparison of genetic and environmental influences on the shape of the axis in mice. Genetics 41: 207–222. [DOI] [PMC free article] [PubMed] [Google Scholar]
- ____. 1981. Recombinant inbred strains and bilineal congenic strains. In The mouse in biomedical research, Vol. 1. History, genetics and wild mice (eds. H.L. Foster et al.), pp. 223–239. Academic Press, New York.
- Brem, R.B., Yvert, G., Clinton, R., and Kruglyak, L. 2002. Genetic dissection of transcriptional regulation in budding yeast. Science 296: 752–755. [DOI] [PubMed] [Google Scholar]
- Butte, A.J., Tamayo, P., Slomin, D., Golub, T.R., and Kohane, I.S. 2000. Discovering functional relationships between RNA expression and chemotherapeutic susceptibility using relevance networks. Proc. Natl. Acad. Sci. 97: 12182–12186. [DOI] [PMC free article] [PubMed] [Google Scholar]
- Churchill, G.A. and Doerge, R.W. 1994. Empirical threshold values for quantitative trait mapping. Genetics 138: 963–967. [DOI] [PMC free article] [PubMed] [Google Scholar]
- Cittadini, A., Mantzoros, C.S., Hampton, T.G., Travers, K.E., Katz, S.E., Morgan, J.P., Flier, J.S., and Douglas, P.S. 1999. Cardiovascular abnormalities in transgenic mice with reduced brown fat: An animal model of human obesity. Circulation 100: 2177–2183. [DOI] [PubMed] [Google Scholar]
- Cureton, E.F. and D'Agostino, R.B. 1983. Factor analysis: An applied approach. Lawrence Erlbaum Associates, Hillsdale, NJ.
- Darvasi, A. 1998. Experimental strategies for the genetic dissection of complex traits in animal models. Nat. Genet. 18: 19–24. [DOI] [PubMed] [Google Scholar]
- Davidson, E.H., Rast, J.P., Oliveri, P., Ransick, A., Calestani, C., Yuh, C.-H., Minokawa, T., Amore, G., Hinman, V., Arenas-Mena, C., et al. 2002. A genomic regulatory network for development. Science 295: 1669–1678. [DOI] [PubMed] [Google Scholar]
- Demant, P. and Hart, A.A. 1986. Recombinant congenic strains—A new tool for analyzing genetic traits determined by more than one gene. Immunogenetics 24: 416–422. [DOI] [PubMed] [Google Scholar]
- Desai, K.H., Schauble, W., Luo, W., Kranias, E.G., and Bernstein, D. 1999. Phospholamban deficiency does not compromise exercise capacity. Am. J. Physiol. 276: H1172–H1177. [DOI] [PubMed] [Google Scholar]
- Duda, R.O. and Hart, P.E. 1973. Pattern Classification and Scene Analysis. John Wiley, New York.
- Eisen, M.B., Spellman, P.T., Brown, P.O., and Botstein, D. 1998. Cluster analysis and display of genome-wide expression data. Proc. Natl. Acad. Sci. 95: 14863–14868. [DOI] [PMC free article] [PubMed] [Google Scholar]
- Ernest, S.R., Christiansen, B., Gilfix, B.M., Mamer, O.A., Dunn, P.J., Hosack, A., Rodier, M., Colmenares, C., McGrath, J., Bale, A., et al. 2002. Genetic, molecular and physiological control of folate and homocysteine metabolism in mutant mice. Mamm. Genome 13: 259–268. [DOI] [PubMed] [Google Scholar]
- Festing, M.F.W. 1996. Origins and characteristics of inbred strains of mice. In Genetic variants and strains of the laboratory mouse, 3rd ed. (eds. M.F. Lyon et al.), pp. 1537, 1544–1545. Oxford University Press, Oxford, UK.
- Fisher, R.A. 1935. The design of experiments. Oliver and Boyd, Edinburgh, U.K.
- Fortin, A., Diez, E., Rochefort, D., Laroche, L., Malo, D., Rouleau, G.A., Gros, P., and Skamene, E. 2001. Recombinant congenic strains derived from A/J and C57BL/6J: A tool for genetic dissection of complex traits. Genomics 74: 21–35. [DOI] [PubMed] [Google Scholar]
- Gilman, A. and Arkin, A.P. 2002. Genetic `code': Representation and dynamical models of genetic components and networks. Annu. Rev. Genomics Hum. Genet. 3: 341–369. [DOI] [PubMed] [Google Scholar]
- Guyton, A.C., Coleman, T.G., and Granger, H.J. 1972. Circulation: Overall regulation. Annu. Rev. Physiol. 34: 13–46. [DOI] [PubMed] [Google Scholar]
- Hoit, B.D. and Nadeau, J.H. 2001. Phenotype-driven genetic approaches in mice: High-throughput phenotyping for discovering new models of cardiovascular disease. Trends Cardiovasc. Med. 11: 82–89. [DOI] [PubMed] [Google Scholar]
- Hoit, B.D., Kiatchoosakun, S., Restivo, J., Kirkpatrick, D., Olszens, K., Shao, H., Pao, Y.-H., and Nadeau, J.H. 2002. Naturally occurring variation in cardiovascular traits among inbred mouse strains. Genomics 79: 679–685. [DOI] [PubMed] [Google Scholar]
- Huang, W., Sher, Y.P., Peck, K., and Fung, Y.C. 2002. Matching gene activity with physiological functions. Proc. Natl. Acad. Sci. 99: 2603–2608. [DOI] [PMC free article] [PubMed] [Google Scholar]
- Hughes, T.R., Marton, M.J., Jones, A.R., Roberts, C.J., Stoughton, R., Armour, C.D., Bennett, H.A., Coffey, E., Dai, H., He, Y.D., et al. 2000. Functional discovery via a compendium of expression profiles. Cell 102: 109–126. [DOI] [PubMed] [Google Scholar]
- Ideker, T., Galitski, T., and Hood, L. 2001a. A new approach to decoding life: Systems biology. Annu. Rev. Genomics Hum. Genet. 2: 343–372. [DOI] [PubMed] [Google Scholar]
- Ideker, T., Thorsson, V., Ranish, J.A., Christmas, R., Buhler, J., Eng, J.K., Bumgarner, R., Goodlett, D.R., Aebersold, R., and Hood, L. 2001b. Integrated genomic and proteomic analyses of a systematically perturbed metabolic network. Science 292: 929–934. [DOI] [PubMed] [Google Scholar]
- Jansen, R.C. and Nap, J.P.H. 2001. Genetical genomics: The benefit from segregation. Trends Genet. 17: 388–391. [DOI] [PubMed] [Google Scholar]
- Kiatchoosakun, S., Kirkpatrick, D., and Hoit, B.D. 2001. Effects of tribromoethanol anesthesia on echocardiographic assessment of left ventricular function in mice. Comp. Med. 51: 26–29. [PubMed] [Google Scholar]
- Kitano, H. 2001. Systems biology: Towards system-level understanding of biological systems. In Foundations of systems biology (ed. H. Kitano), pp. 1–36. MIT Press, Cambridge, MA.
- ____. 2002. Systems biology: A brief overview. Science 295: 1662–1664. [DOI] [PubMed] [Google Scholar]
- Klose, J., Nock, C., Herrmann, M., Stuhler, K., Marcus, K., Bluggel, M., Krause, E., Schalkwyk, L.C., Rastan, S., Brown, S.D.M., et al. 2002. Genetic analysis of the mouse proteome. Nat. Genet. 30: 385–393. [DOI] [PubMed] [Google Scholar]
- Kren, V., Pravenec, M., Bila, V., Krenova, D., Zidek, V., Simakova, M., and Printz, M. 1999. Rat congenic and recombinant inbred strains: A genetic model for the study of quantitative trait loci. Transplant. Proc. 31: 1592–1593. [DOI] [PubMed] [Google Scholar]
- Li, C.C. 1975. Path analysis: A primer. Boxwood Press, Pacific Grove, CA.
- Lilly, L.S. 1993. Pathophysiology of heart disease. Lippincott, Williams and Wilkins, New York.
- Nadeau, J.H., Arbuckle, L.D, and Skamene, E. 1995. Genetic dissection of inflammatory responses. J. Inflammation 45: 27–48. [PubMed] [Google Scholar]
- Nadeau, J.H., Singer, J.B., Martin, A., and Nadeau, J.H. 2000. Analyzing complex genetic traits with chromosome substitution strains. Nat. Genet. 24: 221–225. [DOI] [PubMed] [Google Scholar]
- Noble, D. 2002. Modeling the heart—From genes to cells to the whole organism. Science 295: 1678–1682. [DOI] [PubMed] [Google Scholar]
- Paigen, K. and Eppig, J.T. 2000. A mouse phenome project. Mamm. Genome. 11: 715–717. [DOI] [PubMed] [Google Scholar]
- Prows, D.R. and Horner, M.L. 2002. Parental genetic contributions in the AXB/BXA recombinant inbred mouse strains. Mamm. Genome 13: 123–133. [DOI] [PubMed] [Google Scholar]
- Ramoni, M.F., Sebastiani, P., and Kohane, I.S. 2002. Cluster analysis of gene expression dynamics. Proc. Natl. Acad. Sci. 99: 9121–9126. [DOI] [PMC free article] [PubMed] [Google Scholar]
- Rao, D.C. 2000. The future of path analysis, segregation analysis, and combined models for genetic dissection of complex traits. Hum. Hered. 50: 34–42. [DOI] [PubMed] [Google Scholar]
- Sampson, S.B., Higgins, D.C., Elliot, R.W., Taylor, B.A., Lueders, K.K., Koza, R.A., and Paigen, B. 1998. An edited linkage map of the AXB and BXA recombinant inbred mouse strains. Mamm. Genome 9: 688–694. [DOI] [PubMed] [Google Scholar]
- Schmidt, A.G., Kadambi, V.J., Ball, N., Sato, Y., Walsh, R.A., Kranias, E.G., and Hoit, B.D. 2000. Cardiac-specific overexpression of calsequestrin results in left ventricular hypertrophy, depressed force-frequency relation and pulsus alternans in vivo. J. Mol. Cell. Cardiol. 32: 1735–1744. [DOI] [PubMed] [Google Scholar]
- Segre, D., Vitkup, D., and Church, G.M. 2002. Analysis of optimality in natural and perturbed metabolic networks. Proc. Natl. Acad. Sci. 99: 15112–15117. [DOI] [PMC free article] [PubMed] [Google Scholar]
- Steinmetz, L.M., Sinha, H., Richards, D.R., Spiegelman, J.I., Oefner, P.J., McCusker, J.H., and Davis, R.W. 2002. Dissecting the architecture of a quantitative trait locus in yeast. Nature 416: 326–330. [DOI] [PubMed] [Google Scholar]
- Stevens, J. 1986. Applied multivariate statistics for the social science. Lawrence Erlbaum Assoc., Hillsdale, NJ.
- Stoll, M., Cowley, A.W., Tonellato, P.J., Greene, A.S., Kaldunski, M.L., Roman, R.J., Dumas, P., Schork, N.J., Wang, Z., and Jacob, H.J. 2001. A genomic-systems biology map for cardiovascular function. Science 294: 1723–1726. [DOI] [PubMed] [Google Scholar]
- Taylor, B.A. 1996. Recombinant inbred strains. In Genetic variants and strains of the laboratory mouse (eds. M.F. Lyon et al.), pp. 1597–1659. Oxford University Press, Oxford, UK.
- Thompson, W.R. 1957. Traits, factors and genes. Eugenics Quart. 4: 8–16. [Google Scholar]
- Toh, H., and Horimoto, K. 2002. Inference of a genetic network by a combined approach of cluster analysis and graphical Gaussian modeling. Bioinformatics 18: 287–297. [DOI] [PubMed] [Google Scholar]
- Vatner S.F., Takagi, G., Asai, K., and Shannon R.P. 2002. Cardiovascular physiology in mice: Conscious measurements and effects of anesthesia. In Cardiovascular physiology in the genetically engineered mouse (eds. B.D. Hoit and R.A. Walsh), pp. 257–275. Kluwer Academic Publishing, Boston, MA.
- von Bertalanffy, L. 1969. General system theory, foundations, development, applications. George Braziller, New York.
- Wagner, A. 2001. How to construct a large genetic network from n gene perturbations in fewer than n2 easy steps. Bioinformatics 17: 1183–1197. [DOI] [PubMed] [Google Scholar]
- Wakasaki, H., Koya, D., Schoen, F.J., Jirousek, M.R., Ways, D.K., Hoit, B.D., Walsh, R.A., and King, G.L. 1999. Targeted overexpression of protein kinase C β2 isoform in myocardium causes cardiomyopathy. Proc. Natl. Acad. Sci. 94: 9320–9325. [DOI] [PMC free article] [PubMed] [Google Scholar]
- Wright, S. 1921. Correlation and causation. J. Agric. Res. 20: 557–585. [Google Scholar]
- ____. 1978. Evolution and the genetics of populations. Variability within and among natural populations. Vol. 4, pp. 382–388. University of Chicago Press, Chicago, IL. [Google Scholar]
WEB SITE REFERENCES
- http://www.jax.org/staff/churchill/labsite/dataset/index.html; Raw data in tab delineated format along with a script that can be executed in a Matlab (Mathworks Inc., Natick, MA) session to replicate the analyses described in this article.


