Abstract
Glyconanomaterials, an emerging class of bio-functional nanomaterials, have shown promise in detecting, imaging and targeting proteins, bacteria, and cells. In this article, we report that dynamic light scattering (DLS) can be used as an efficient tool to study glyconanoparticle (GNP)––lectin interactions. Silica and Au nanoparticles (NPs) conjugated with D-mannose (Man) and D-galactose (Gal) were treated with the lectins Concanavalin A (Con A) and Ricinus communis agglutinin (RCA120), and the hydrodynamic volumes of the resulting aggregates were measured by DLS. The results showed that the particle size grew with increasing lectin concentration. The limit of detection (LOD) was determined to be 2.9 nM for Con A with Man-conjugated and 6.6 nM for RCA120 with Gal-conjugated silica NPs (35 nm), respectively. The binding affinity was also determined by DLS and the results showed 3–4 orders of magnitude higher affinity of GNPs than the free ligands with lectins. The assay sensitivity and affinity were particle size dependent and decreased with increasing particle diameter. Because the method relies on the particle size growth, it is therefore general and can be applied to nanomaterials of different compositions.
Introduction
Carbohydrate–lectin interactions are involved in many important biological processes, mediating cell behaviors in numerous diseases including cancer, the comprehensive analysis and efficient control of which are thus of high significance.1–3 Nanotechnology offers new tools facilitating the study and understanding of carbohydrate-mediated interactions. NPs carrying surface-tethered carbohydrate ligands, the so-called GNPs, have demonstrated increasing potential in biomedical imaging, diagnostics and therapeutics.4,5
A number of analytical techniques have been used to monitor the interactions of GNPs with biological receptors, including UV-vis spectroscopy,6 transmission electron microscopy (TEM),7 surface plasmon resonance (SPR),8 quartz crystal microbalance (QCM),9 isothermal titration calorimetry (ITC),10 magnetic resonance imaging (MRI),11 and fluorescence spectroscopy.12,13 Each technique has its advantages and limitations, and some methods are restricted to the property of the nanomaterials. For instance, UV-vis spectroscopy only applies to metal nanoparticles that absorb light by free electron oscillations. SPR and QCM are generally performed on Au surfaces where the interactions of GNPs with target biomolecules immobilized on Au surfaces are monitored.
Light scattering is a powerful technique for characterizing particles in solutions. When a beam of light passes through a colloidal dispersion, the particles scatter the light in all directions. In DLS, the particles are illuminated with a monochromatic laser. The intensity of the scattered light fluctuates and the rate is dependent on the size of the particles. Analysis of the time dependence of the intensity fluctuations yields the diffusion coefficient of the particles, from which the hydrodynamic radius, or the diameter of the particles, can be calculated.14 DLS has become a routine analytical tool for particle size measurement. The technique has also been used to study the interactions of nanoparticles with other species such as polymers,15 DNA,16–18 and biomarkers.19 The advantages of DLS include excellent sensitivity, easy sample preparation, and fast measurement where data can be obtained in a few minutes. In this article, we report that DLS is a highly efficient technique to study GNP–lectin interactions. GNPs of different particle sizes and composition were synthesized and their interactions with lectins were analyzed by DLS. The apparent dissociation constant (KD) values were determined, and the impact of the particle size on the affinity of the GNPs was also investigated. To the best of our knowledge, this is the first report on the quantitative analysis of GNP–lectin interactions by DLS.
Experimental
Materials
D-(+)-Mannose (Man) and D-(+)-galactose (Gal) were obtained from TCI America. Tetraethyl orthosilicate (TEOS), Con A (lectin from Canavalia ensiformis (Jack bean), Type IV), and bovine serum albumin (BSA) were purchased from Sigma-Aldrich. RCA120 (from Ricinus communis (Castor bean) seeds) was obtained from Vector Labs Inc. (Burlingame, CA). Absolute ethanol (200 proof) was purchased from Pharmaco-AAPER (Brookfield, CT). All chemicals were used as received without purification. Water used was from a Milli-Q ultrapure water purification system. Dialysis tubes (G-Biosciences Tube-O-dialyzer, 15K, medium) were purchased from VWR International. All studies were carried out in HEPES buffer (10 mM, pH 7.6) containing NaCl (90 mM), CaCl2 (1 mM) and MnCl2 (1 mM).
Instrumentation
TEM images were obtained on a JEOL 100CX transmission electron microscope operating at an accelerating bias voltage of 100 kV. The specimens were prepared by dropping nanoparticle suspensions (10 μL) onto a 200-mesh copper grid (coated with carbon supporting film, Electron Microscopy Sciences). DLS experiments were carried out on a Horiba LB-550 Dynamic Light Scattering Nano-Analyzer, and the data were analyzed using the Horiba software (version 3.57).
Sample preparation
Preparation of silica particles
Silica NPs were synthesized following a modified Stöber protocol,20 similar to what was previously described.21 TEOS (2 mL) was added to 200-proof absolute ethanol (34 mL) followed by NH4OH (35%, 1 mL). The reaction was allowed to proceed at room temperature overnight with vigorous stirring to yield a white colloidal solution; the particle size was 35 nm measured by DLS. Particles of 110 nm size were synthesized following the same procedure except for the amount of reagents added: TEOS (2.8 mL) and NH4OH (2.8 mL). The 470 nm silica particles were prepared using the seed-growth method.22 Briefly, TEOS (1.4 mL) was added to 200-proof absolute ethanol (34 mL) followed by the addition of NH4OH (35%, 2.8 mL). The reaction was allowed to proceed at room temperature overnight with vigorous stirring, after which additional TEOS (1.4 mL) was added continuously in aliquots of 0.2 mL every 10 min.
Functionalization of silica particles with perfluorophenyl azide (PFPA)
PFPA–silane (80 mg, Fig. 1a), synthesized following a previously reported procedure,23 was added directly to the Stöber solution prepared above, and the mixture was stirred at room temperature overnight. The mixture was then brought to reflux under continuous stirring for 1 h at −78 °C to facilitate the silanization of the silica particles with PFPA–silane.21 The mixture was centrifuged at 12 000 rpm for 30 min, and the precipitate was redispersed in the fresh solvent by sonication. This centrifugation/redispersion procedure was repeated three times with ethanol and twice with acetone.
Fig. 1.
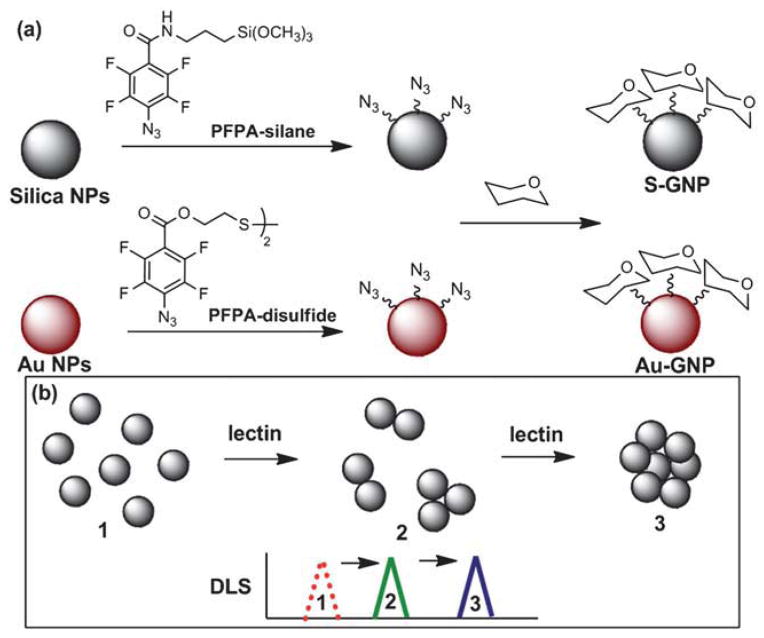
(a) Synthesis of silica and Au GNPs S-GNP and Au-GNP. (b) GNP aggregation upon addition of lectin.
Conjugation of carbohydrates to PFPA-functionalized silica particles
Our previously reported procedure of coupling carbohydrates to Au NPs was followed.24 Briefly, the dispersion of PFPA-functionalized silica particles in acetone and an aqueous solution of carbohydrate was placed in a flat-bottom dish, and the mixture was irradiated with a 450 W medium pressure Hg lamp with a 280 nm filter for 10 min. Excess carbohydrate was removed by membrane dialysis in water for 24 hours. The concentration of the resulting GNPs, ca. 18.4 mg mL−1, was determined gravimetrically after drying the solution under reduced pressure for 3 hours.
Synthesis of Au GNPs
The Turkevich method25 was followed to synthesize Au NPs. An aqueous solution of sodium citrate (1 wt %, 1.2 mL) was added to a boiling HAuCl4 solution (0.25 mM, 100 mL) under vigorous stirring for 15 min. PFPA–disulfide (Fig. 1a) was synthesized following a previously reported procedure.24 A solution of PFPA–disulfide (25 mg) in acetone (5 mL) was added to the Au NPs solution, and the solution was stirred for 12 hours. The resulting NPs were centrifuged at 12 000 rpm for 15 min and cleaned with acetone 3 times.24 Carbohydrate conjugation followed the previously developed procedure.24
Interaction of GNPs with lectins and DLS measurements
The following general procedure was followed for all GNPs. GNPs (0.1 mg) were incubated in a pH 7.2 HEPES buffer (10 mM, 0.5 mL) containing 3% BSA for 30 min. The sample was then centrifuged and the particles rinsed 3 times with the fresh HEPES buffer. The GNPs were subsequently treated with a solution of Con A or RCA120 in pH 7.2 HEPES buffer at different concentrations for 2 hours while shaking. For DLS measurements, the suspension was diluted to 3 mL using the HEPES buffer. Each DLS measurement was performed at 20 scans and was repeated 6 times.
Results and discussions
Monitoring of GNP–lectin interactions by DLS
GNPs were synthesized using the methods developed previously in our laboratory.4,24,26 Briefly, silica and Au particles of varying sizes, synthesized by the Stöber method20 and the Turkevich method,25 respectively, were functionalized with PFPA–silane or PFPA–disulfide (Fig. 1a). Man and Gal were then coupled with the particles by the photochemically initiated CH insertion reaction of PFPA.27 The resulting GNPs were treated with Con A, a well-studied lectin that exhibits high affinity for the terminal α-D-mannopyranosyl group.28,29 As demonstrated in our previous studies, Man-functionalized NPs formed aggregates upon binding with Con A,24,26 resulting in an overall size increase, as observed by TEM.13
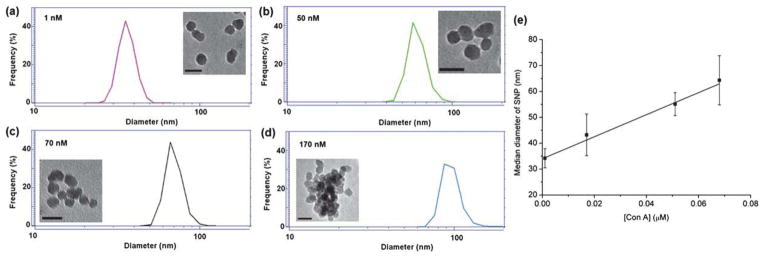
To investigate the feasibility of DLS in studying GNP–lectin interactions, Man coupled with silica NPs (35 ± 4.4 nm in diameter), S-M-GNP, was treated with varying concentrations of Con A (1–700 nM). The hydrodynamic radius of the resulting complex was measured by DLS. At 1 nM Con A concentration, there was no obvious change in the average particle size (Fig. 2a). When a higher concentration of Con A was added (50, 70, and 170 nM, respectively), the median diameter of the resulting particles increased to 55.1 ± 4.5, 64.3 ± 9.5 nm, and 94.8 ± 14.6 nm, respectively (Fig. 2b–d). Also increased is the error margin suggesting that particles become more polydisperse with the addition of Con A.
Fig. 2.

(a–d) DLS spectra and TEM images (inserts, scale bars: 50 nm) when 35 nm S-M-GNP was treated with varying concentrations of Con A. (e) The particle size vs. concentration of Con A.
The sensitivity of this method was next studied. LOD, defined as the lowest analyte concentration measurable against the background, can be computed from eqn (1),
| (1) |
where σ is the standard deviation of the spectroscopic signals of the blank sample (from 12 measurements) and b is the slope of the linear calibration curve (e.g., Fig. 2e).30,31 Using the data from Fig. 2e, the LOD of Con A by the 35 nm S-M-GNP was calculated to be 2.9 nM.
To investigate the generality of this method with respect to the nature of the particles, Au NPs (40 nm, see Fig. S1 and S2, ESI† for TEM and DLS characterization) were synthesized, and Man was then coupled onto the particles.13 The resulting Man-functionalized gold nanoparticles (Au-M-GNP) were treated with varying concentrations of Con A and the particle sizes were monitored by DLS, from which a calibration curve was established (Fig. S3, ESI†). The LOD was then calculated according to eqn (1), which yielded 15 nM. This result demonstrates that the DLS method might be more sensitive than the SPR-based optical detection where the LODs were in range of 80–100 nM for 13–16 nm Au NPs.6,32
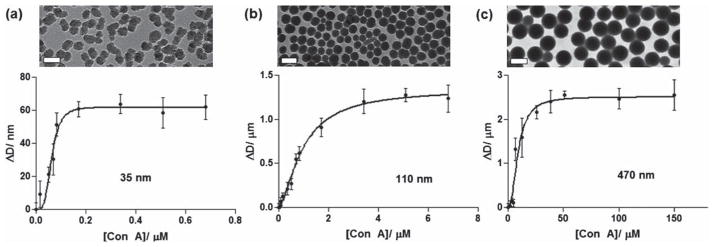
Titration experiments were next carried out to quantitatively analyze GNP–lectin interactions. A fixed amount of the 35 nm S-M-GNP was incubated with varying concentrations of Con A, and the resulting solution was measured by DLS. The increase in the particle diameter, ΔD, was computed and the results were plotted against the concentration of Con A (Fig. 3a). The curve was then fitted with an overall binding model, i.e., the Hill equation (eqn (2)),
Fig. 3.

The change in the particle diameter (ΔD) vs. lectin concentration: experimental data (circles) and the corresponding Hill fitting curves (lines) for (a) 35 nm, (b) 110 nm, and 470 nm silica particles, respectively. The scale bars in the TEM images are (a) 50 nm, (b) 200 nm, and (c) 500 nm, respectively.
| (2) |
where Bmax is the maximum specific binding, KD is the apparent dissociation constant, and h is the Hill coefficient. The KD value was subsequently derived to be 63 nM for S-M-GNP (Table 1). Following the same procedure, the KD value of Au-M-GNP was determined to be 86 nM (Table 1). These values represent more than 3 orders of magnitude increase in binding affinity than that of the free ligand Man with Con A (Kd ~470 μM).33 The results are consistent with our previous studies that NPs serve as an efficient multivalent scaffold significantly amplifying the affinity of the bound ligands with lectins.13 In all cases, the h values were larger than 1, indicating a positive cooperativity of the ligands on GNPs.
Table 1.
LOD and KD values of GNP–lectin interactionsa
| GNP | Diameter/nm | Number of ligand per NP | Lectin | LOD/nM | KD/μM | h |
|---|---|---|---|---|---|---|
| S-M-GNP | 35 | 830 | Con A | 2.9 | 0.063 | 3.9 |
| 110 | 2600 | 42 | 0.97 | 1.6 | ||
| 470 | 4900 | 6.2 × 10³ | 9.2 | 2.3 | ||
| Au-M-GNP | 40 | 950 | Con A | 15 | 0.086 | 2.2 |
| S-G-GNP | 35 | 830 | Con A | N/A | ||
| 35 | 840 | RCA120 | 6.6 | 0.22 | 1.9 |
N/A: not applicable.
Impact of particle size on binding affinity of GNPs
Size-dependency has been recognized as of high significance, affecting the physical and chemical properties of particles, including adsorption, bio-affinity and catalysis.34–36 To study the impact of the particle size on the binding affinity of GNPs, silica particles with an average diameter of 35, 110, and 470 nm, respectively, were synthesized. Particles of 35 nm and 110 nm in size were obtained by varying the reagent concentrations using the Stöber method.20 The 470 nm particles were prepared using the seed-growth method.37 These particles were uniform in shape and size (see the TEM images, Fig. 3c) and were more mono-disperse, having a narrower particle size distribution than the 35 nm and 110 nm Stöber particles (Fig. S4, ESI†). Man ligands were subsequently conjugated with these silica particles following the same protocol as described above, and the ligand densities were determined by the colorimetric method using anthrone/H2SO4.24 As the particle size increases, the number of coupled Man increases (Table 1), which is expected since the bigger particles have larger surface areas and can thus accommodate more ligands.
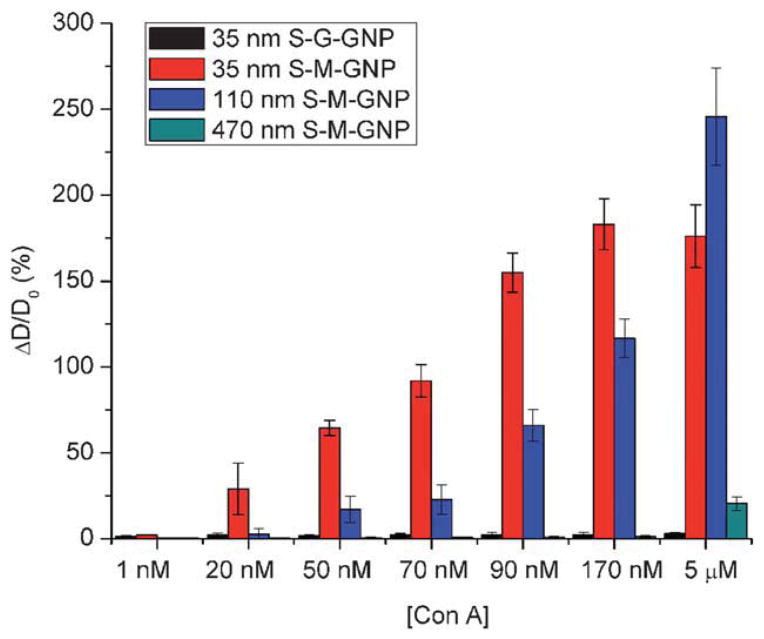
The GNPs were then treated with varying concentrations of Con A, and the percentage increase in the particle diameter was calculated from the DLS measurements, as shown in Fig. 4. A noticeable change in the particle diameter was observed for the 35 nm S-M-GNP when 20 nM Con A was added. The size did not change for the 110 nm and 470 nm S-M-GNPs until the Con A concentration reached 50 nM and 5 μM, respectively, indicating that smaller GNPs were more sensitive in detecting GNP–lectin interactions. This is consistent with the LOD results determined for these GNPs, which were 2.9 nM, 42 nM, and 6.2 μM for 35 nm, 110 nm, and 470 nm S-M-GNPs, respectively (Table 1). This size-dependent phenomenon was also observed by Huo and coworkers where Au NPs were used to detect DNA by DLS.16 Titration experiments were subsequently carried out on the 110 nm (Fig. 3b) and 470 nm S-M-GNPs (Fig. 3c) and the apparent KD values were determined from the saturation binding curves in the same manner as shown in Fig. 3a. The binding affinity decreased, i.e., the KD values increased with increasing particle size, even though there are more ligands on the larger particles (Table 1). This is in agreement with our previous studies on Au GNPs where the affinity of GNPs with lectins decreased with increasing particle size.13 A possible explanation for the lower LOD and binding affinity of the larger GNPs is the steric hindrance imposed by the larger particles. With the same spacer linker length, ligands on the larger NPs are less accessible to the lectin as compared to smaller NPs.
Fig. 4.
Percent increase in the particle size (= increase in particle diameter (ΔD)/original particle diameter (D0) × 100%) vs. concentration of Con A for various GNPs.
The DLS method is also highly specific. When Gal, a non-binding ligand for Con A, was conjugated with the 35 nm silica NPs and the resulting S-G-GNP was subsequently treated with Con A, no obvious change in the particle size was observed at all Con A concentrations up to 5 μM (Fig. 4). S-G-GNP was then treated with RCA120, an R-type lectin exhibiting broad specificity for the terminal Gal.38 RCA120 is a dimer having one active Gal-binding site on each subunit.39 The lectin can therefore act as a crosslinker forming a complex with Gal-coated NPs.40 Indeed, when S-G-GNP was treated with RCA120, aggregates formed and the size increase was monitored by DLS. Following the same procedure as described above, the LOD of RCA120 was measured to be 6.6 nM (Fig. S5, ESI†), which is on the same order of magnitude as that of the S-M-GNP/Con A system (2.9 nM, Table 1). Titration experiments were then carried out, and the particle size changes were plotted against the RCA120 concentration (Fig. S6, ESI†). The apparent KD was then calculated by fitting the saturation curve with the Hill equation (eqn 2). The value, 0.22 μM (Table 1), corresponds to an affinity enhancement of over 4 orders of magnitude in comparison to that of the free Gal with RCA120 (Kd = 455 μM).39
Conclusions
In summary, a new method, based on DLS, was developed to study the interactions of GNPs with lectins. The method relies on the particle size growth of GNPs, resulting from the multiple binding sites on lectins that act as crosslinkers bringing GNPs together to form larger aggregates. Two GNP–lectin systems, M-GNP/Con A and G-GNP/RCA120, were investigated and the particle size growth was observed only for the specific binding pairs. The technique is highly sensitive, and the LOD was on par with values obtained by other techniques. Quantitative analysis is also possible by carrying out the titration experiments, from which the apparent KD values were obtained. The results showed that the binding affinities of GNPs with lectins were 3–4 orders of magnitude higher than those of the free ligands, demonstrating that NPs are an efficient scaffold amplifying the glycan–lectin interactions. The effect of particle size was also studied, and results revealed that smaller GNPs gave higher detection sensitivity as well as binding affinity. The method is general regardless of the composition of the particles. The high sensitivity of the DLS method comes from the crosslinking ability of the lectins, which can be a limitation. However, many lectins contain more than 2 subunits and can act as crosslinkers inducing particle aggregation. The method developed here, coupled with the simple and fast measurement of the DLS technique, makes it a highly efficient tool in studying GNP–lectin interactions.
Supplementary Material
Acknowledgments
This work was supported by the National Institutes of General Medical Science (NIGMS) under NIH Award Numbers R01GM080295 and 2R15GM066279.
Footnotes
Electronic supplementary information (ESI) available: TEM and DLS of silica and gold nanoparticles, detection limit (LOD) and binding affinity determination. See DOI: 10.1039/c1an15469a
Contributor Information
Olof Ramström, Email: ramstrom@kth.se.
Mingdi Yan, Email: yanm@pdx.edu.
Notes and references
- 1.Lee YC, Lee RT. Acc Chem Res. 1995;28:321–327. [Google Scholar]
- 2.Cipolla L, Peri F, Airoldi C. Anti-Cancer Agents Med Chem. 2008;8:92–121. doi: 10.2174/187152008783330815. [DOI] [PubMed] [Google Scholar]
- 3.Niemeyer CM, Mirkin CA. Nanobiotechnology. Wiley-VCH; Weinheim: 2004. [Google Scholar]
- 4.Wang X, Liu LH, Ramström O, Yan M. Exp Biol Med. 2009;234:1128–1139. doi: 10.3181/0904-MR-134. [DOI] [PMC free article] [PubMed] [Google Scholar]
- 5.de la Fuente JM, Penadés S. Biochim Biophys Acta, Gen Subj. 2006;1760:636–651. doi: 10.1016/j.bbagen.2005.12.001. [DOI] [PubMed] [Google Scholar]
- 6.Hone DC, Haines AH, Russell DA. Langmuir. 2003;19:7141–7144. [Google Scholar]
- 7.Lin CC, Yeh YC, Yang CY, Chen CL, Chen GF, Chen CC, Wu YC. J Am Chem Soc. 2002;124:3508–3509. doi: 10.1021/ja0200903. [DOI] [PubMed] [Google Scholar]
- 8.Lin C-C, Yeh Y-C, Yang C-Y, Chen G-F, Chen Y-C, Wu Y-C, Chen C-C. Chem Commun. 2003:2920–2921. doi: 10.1039/b308995a. [DOI] [PubMed] [Google Scholar]
- 9.Mahon E, Aastrup T, Barboiu M. Chem Commun. 2010;46:5491–5493. doi: 10.1039/c002652b. [DOI] [PubMed] [Google Scholar]
- 10.de la Fuente JM, Eaton P, Barrientos AG, Menendez M, Penades S. J Am Chem Soc. 2005;127:6192–6197. doi: 10.1021/ja0431354. [DOI] [PubMed] [Google Scholar]
- 11.El-Boubbou K, Zhu DC, Vasileiou C, Borhan B, Prosperi D, Li W, Huang X. J Am Chem Soc. 2010;132:4490–4499. doi: 10.1021/ja100455c. [DOI] [PubMed] [Google Scholar]
- 12.Wang X, Ramström O, Yan M. Adv Mater. 2010;22:1946–1953. doi: 10.1002/adma.200903908. [DOI] [PMC free article] [PubMed] [Google Scholar]
- 13.Wang X, Ramström O, Yan M. Anal Chem. 2010;82:9082–9089. doi: 10.1021/ac102114z. [DOI] [PMC free article] [PubMed] [Google Scholar]
- 14.Schärtl W. Light Scattering from Polymer Solutions and Nanoparticle Dispersions. Springer-Verlag; Berlin, Germany: 2007. [Google Scholar]
- 15.Mishra A, Ram S, Ghosh G. J Phys Chem C. 2009;113:6976–6982. [Google Scholar]
- 16.Jans H, Liu X, Austin L, Maes G, Huo Q. Anal Chem. 2009;81:9425–9432. doi: 10.1021/ac901822w. [DOI] [PubMed] [Google Scholar]
- 17.Falabella JB, Cho TJ, Ripple DC, Hackley VA, Tarlov MJ. Langmuir. 2010;26:12740–12747. doi: 10.1021/la100761f. [DOI] [PubMed] [Google Scholar]
- 18.Dai Q, Liu X, Coutts J, Austin L, Huo Q. J Am Chem Soc. 2008;130:8138–8139. doi: 10.1021/ja801947e. [DOI] [PubMed] [Google Scholar]
- 19.Liu X, Dai Q, Austin L, Coutts J, Knowles G, Zou J, Chen H, Huo Q. J Am Chem Soc. 2008;130:2780–2782. doi: 10.1021/ja711298b. [DOI] [PubMed] [Google Scholar]
- 20.Stöber W, Fink A. J Colloid Interface Sci. 1968;26:62–69. [Google Scholar]
- 21.Gann JP, Yan M. Langmuir. 2008;24:5319–5323. doi: 10.1021/la7029592. [DOI] [PMC free article] [PubMed] [Google Scholar]
- 22.Chen SL, Dong P, Yang GH. J Colloid Interface Sci. 1997;189:268–272. [Google Scholar]
- 23.Yan M, Ren J. Chem Mater. 2004;16:1627–1632. [Google Scholar]
- 24.Wang X, Ramström O, Yan M. J Mater Chem. 2009;19:8944–8949. doi: 10.1039/B917900C. [DOI] [PMC free article] [PubMed] [Google Scholar]
- 25.Turkevich J, Stevenson PC, Hollier J. Discuss Faraday Soc. 1951;11:55–75. [Google Scholar]
- 26.Wang X, Ramström O, Yan M. Chem Commun. 2011;47:4261–4263. doi: 10.1039/c0cc05299j. [DOI] [PMC free article] [PubMed] [Google Scholar]
- 27.Liu LH, Yan M. Acc Chem Res. 2010;43:1434–1443. doi: 10.1021/ar100066t. [DOI] [PMC free article] [PubMed] [Google Scholar]
- 28.De la Fuente JM, Penadés S. Biochim Biophys Acta, Gen Subj. 2006;1760:636–651. doi: 10.1016/j.bbagen.2005.12.001. [DOI] [PubMed] [Google Scholar]
- 29.Lis H, Sharon N. Chem Rev. 1998;98:637–674. doi: 10.1021/cr940413g. [DOI] [PubMed] [Google Scholar]
- 30.MacDougall D, Crummett WB. Anal Chem. 1980;52:2242–2249. [Google Scholar]
- 31.Long GL, Winefordner JD. Anal Chem. 1983;55:712A–724A. [Google Scholar]
- 32.Sato Y, Murakami T, Yoshioka K, Niwa O. Anal Bioanal Chem. 2008;391:2527–2532. doi: 10.1007/s00216-008-2056-2. [DOI] [PubMed] [Google Scholar]
- 33.Sanders JN, Chenoweth SA, Schwarz FP. J Inorg Biochem. 1998;70:71–82. doi: 10.1016/s0162-0134(98)00016-6. [DOI] [PubMed] [Google Scholar]
- 34.Campbell CT, Parker SC, Starr DE. Science. 2002;298:811–814. doi: 10.1126/science.1075094. [DOI] [PubMed] [Google Scholar]
- 35.De M, Miranda OR, Rana S, Rotello VM. Chem Commun. 2009:2157–2159. doi: 10.1039/b900552h. [DOI] [PubMed] [Google Scholar]
- 36.Hill HD, Millstone JE, Banholzer MJ, Mirkin CA. ACS Nano. 2009;3:418–424. doi: 10.1021/nn800726e. [DOI] [PMC free article] [PubMed] [Google Scholar]
- 37.Nyffenegger R, Quellet C, Ricka J. J Colloid Interface Sci. 1993;159:150–157. [Google Scholar]
- 38.Wu AM, Wu JH, Singh T, Lai LJ, Yang Z, Herp A. Mol Immunol. 2006;43:1700–1715. doi: 10.1016/j.molimm.2005.09.008. [DOI] [PubMed] [Google Scholar]
- 39.Sharma S, Bharadwaj S, Surolia A, Podder SK. Biochem J. 1998;333:539–542. doi: 10.1042/bj3330539. [DOI] [PMC free article] [PubMed] [Google Scholar]
- 40.Schofield CL, Mukhopadhyay B, Hardy SM, McDonnell MB, Field RA, Russell DA. Analyst. 2008;133:626–634. doi: 10.1039/b715250g. [DOI] [PubMed] [Google Scholar]
Associated Data
This section collects any data citations, data availability statements, or supplementary materials included in this article.


