
Fig. 2.
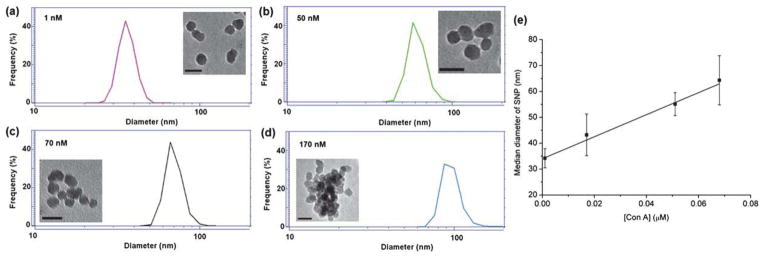
(a–d) DLS spectra and TEM images (inserts, scale bars: 50 nm) when 35 nm S-M-GNP was treated with varying concentrations of Con A. (e) The particle size vs. concentration of Con A.
Official websites use .gov
A
.gov website belongs to an official
government organization in the United States.
Secure .gov websites use HTTPS
A lock (
) or https:// means you've safely
connected to the .gov website. Share sensitive
information only on official, secure websites.
(a–d) DLS spectra and TEM images (inserts, scale bars: 50 nm) when 35 nm S-M-GNP was treated with varying concentrations of Con A. (e) The particle size vs. concentration of Con A.