Abstract
The authors investigated the utility of an intravascular magnetic resonance (MR) contrast agent, poly-L-lysine-gadolinium diethylenetriaminepentaacetic acid (DTPA), for differentiating acutely ischemic from normally perfused myocardium with first-pass MR imaging. Hypoperfused regions, identified with microspheres, on the first-pass images displayed significantly decreased signal intensities compared with normally perfused myocardium (P < .0007). Estimates of regional myocardial blood content, obtained by measuring the ratio of areas under the signal intensity-versus-time curves in tissue regions and the left ventricular chamber, averaged 0.12 mL/g ± 0.04 (n = 35), compared with a value of 0.11 mL/g ± 0.05 measured with radiolabeled albumin in the same tissue regions. To obtain MR estimates of regional myocardial blood flow, in situ calibration curves were used to transform first-pass intensity-time curves into content-time curves for analysis with a multiple-pathway, axially distributed model. Flow estimates, obtained by automated parameter optimization, averaged 1.2 mL/min/g ± 0.5 [n = 29), compared with 1.3 mL/min/g ± 0.3 obtained with tracer microspheres in the same tissue specimens at the same time. The results represent a combination of T1-weighted first-pass imaging, intravascular relaxation agents, and a spatially distributed perfusion model to obtain absolute regional myocardial blood flow and volume.
Index terms: Contrast agent, blood pool; Contrast enhancement; Coronary vessels, diseases, 54.76; Heart, flow dynamics; Heart, MR, 51.12143; Model, mathematical; Myocardium, blood supply, 511.12143; Myocardium, MR, 511.12143; Perfusion studies
A growing body of evidence supports the feasibility of evaluating myocardial perfusion with magnetic resonance (MR) imaging with contrast agents. A variety of intravascular and extracellular MR contrast agents have been studied for delineation of infarcted myocardium (1–3) and for identification of acutely ischemic and reperfused cardiac muscle (4,5). The first-pass MR imaging technique with the extracellular contrast agent gadolinium diethylenetriaminepentaacetic acid (DTPA) has been used to assess myocardial perfusion in patients at rest (6,7) and during pharmacologic stress (8,9). Although experimental (10) and patient studies have demonstrated the suitability of extracellular contrast agents for detecting hypoperfused myocardium, such agents are inherently disadvantageous for flow quantification because they are not confined to a single volume compartment within the tissue. Consequently, first-pass kinetics of an extracellular agent are determined not only by blood flow but by the intravascular and interstitial distribution volumes and by permeability across the capillary wall. This exchange between the vascular and interstitial compartments greatly complicates quantification of tissue blood flow unless it is either very fast or slow compared with flow rates (11).
The objective of the present study was to evaluate first-pass MR imaging with the intravascular contrast agent polylysine-L-Gd-DTPA for the detection of regional changes in myocardial perfusion during graded coronary stenosis and to assess the feasibility of quantifying blood flow with a multiple-pathway, axially distributed model to analyze the first-pass kinetics. The use of intravascular MR contrast agents is expected to be advantageous because the transport kinetics are governed mainly by flow and intravascular volumes, making these parameters simpler to quantify. Analytic strategies have been developed (12) and implemented (13) for model-independent estimation of regional tissue blood volume with first-pass kinetics of an intravascular agent. However, there are major obstacles to estimating regional blood flow with a model-independent approach (12,14). A model that explicitly incorporates relevant aspects of the vascular architecture, as in the present study, is expected to overcome the most important limitations of blood flow estimation.
MATERIALS AND METHODS
Animal Preparation and Model
The performance of polylysine-Gd-DTPA as an intravascular MR contrast agent was investigated with a contrast-enhanced first-pass MR technique in a closed-chest, instrumented canine model in which acute ischemia could be induced by applying a flow-limiting coronary stenosis (15). All animal experiments were performed within the guidelines established in “Position of the American Heart Association on Research Animal Use” and following the recommendations of the Panel of Euthanasia of the American Veterinary Association.
Adult mongrel dogs (n = 7) weighing 25–27 kg were anesthetized with intravenous sodium pentobarbital (30–35 mg/kg), intubated, and ventilated with supplemental oxygen via a servo ventilator (type 900 C; Siemens Elema, Solna, Sweden). The left femoral artery was isolated, and a heparin-filled polyvinyl chloride catheter (3.0-mm outside diameter) was inserted and advanced into the ascending aorta. A thoracotomy was performed at the fourth intercostal space on the left side. A heparin-filled catheter was inserted into the left ventricular cavity. A similar catheter was inserted into the left atrium through the atrial appendage. A 1.5–2.0-cm segment of the left anterior descending artery (LAD) proximal to the first major epicardial left ventricular branch was dissected free, and a hydraulic occluder constructed of polyvinyl chloride tubing (2.7-mm outside diameter) was wrapped around the artery. A silicone elastomer catheter (0.3-mm inside diameter) was placed within the LAD distal to the occluder (16). The instrumentation leads were externalized through the chest wall. The pericardium and chest were closed, and the animals were allowed to recover for 5 days. The tubing and all the instrumentation leads were extended and filled with saline solution before being connected to the remote electronic monitoring and recording equipment (pressure transducer, a variety of analog signal conditioning modules, and type R 14–28 recorder; Coulbourn Instruments, Lehigh Valley, Pa) and ventilator outside the magnet room.
Aortic, left ventricular, and mean LAD intracoronary pressures were monitored continuously during the study. The heart rate was maintained at 90–110 beats per minute by injecting morphine, xylazine, and Rompun (Miles Agriculture, Shawnee, Kan). Adenosine, when used, was administered intravenously (0.8 mg/kg) for a period of 2 minutes to produce increased coronary blood flow. A trigger signal for synchronization of MR data acquisition with the heartbeat was derived electronically from the left ventricular pressure trace during the onset of diastolic pressure in the left ventricle. The electronic left ventricular pressure signal was recorded and was also fed to a comparator set to a threshold level of 10% of the upslope of the left ventricular pressure curve. The signal from the comparator was sent to a pulse former and then fed to the electrocardiograph port of the MR system, where it was treated as an electrocardiographic input within the pulse sequences.
Radioisotopic Measurements of Myocardial Blood Flow and Volume
Microspheres labeled with tracer amounts of gamma ray–emitting radionuclides were injected into the left atrium for measurement of regional myocardial blood flow. More than one blood flow measurement was obtained in the same animal with different types of microspheres. We used microspheres of strontium-85, chromium-51, niobium-95, scandium-46, and iodine-125–albumin. Typically, not more than five different injections were performed in each animal. For each measurement, approximately 3 × 10⁶ microspheres were injected into the left atrium via the left atrial catheter, which was then flushed with 10 mL of normal saline solution. After completion of the study, the heart was removed and fixed in 1% buffered formalin.
For the estimation of blood volume, 0.13 mL of I-125–albumin was injected into the left atrium in three dogs, followed by 10 mL of saline flush. After a 10-minute wait for equilibration in the blood pool, 3 mL of blood was drawn from a femoral artery catheter. The chest was immediately opened and the heart fibrillated, rapidly excised, and frozen in hexane cooled in liquid nitrogen. Subsequently, the heart was sectioned into four rings in the double-oblique short-axis orientation, from base to apex, such that a 12-mm-thick myocardial ring contained the section previously used for the MR perfusion study. One of the autopsy rings was then matched with the short-axis MR plane on the basis of anatomic landmarks such as the location of the papillary muscles. The corresponding autopsy ring was cut into 10 sections (Fig 1), and each section was then divided into two transmural layers of equal thickness. Radioactivity in the myocardial and blood reference specimens was determined with a gamma spectrometer (model 5912; Packard Instruments, Downers Grove, III). Blood flow was expressed in milliliters per minute per gram (wet weight) of myocardium. Myocardial blood volume (MBV) was estimated by dividing the I-125-albumin activity in tissue samples (counts per minute per gram) by the activity in the femoral artery blood sample (counts per minute per milliliter).
Figure 1.
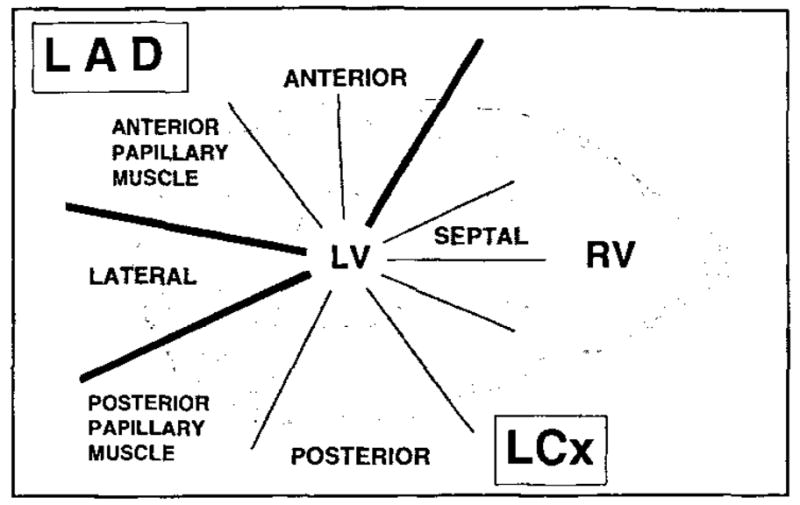
ROI analysis was performed in 10 myocardial segments over the left ventricular wall, covering the LAD and LCx perfusion beds. ANTERIOR = anterior wall of the left ventricle, SEPTAL = septal wall of the left ventricle, POSTERIOR = posterior lateral wall of the left ventricle, LATERAL = lateral wall of the left ventricle.
MR Imaging
Coronal and transverse scout images of the heart were acquired to select the appropriate double-oblique short-axis view at the level of the papillary muscles near the apex. Image acquisition was triggered from the left ventricular pressure trace that was obtained through the implanted left ventricular catheter. The dogs were placed on their left side within an 18-cm-diameter Helmholtz coil. An oil phantom was placed under the chest of each dog as a reference for signal intensity evaluation of MR images.
MR images were acquired with a Magnetom SP imager (Siemens, Erlangen, Germany) operating at 1.5 T. A TurboFLASH (fast low-angle shot) (17) sequence (TR msec/TE msec = 5.9/3, 13° flip angle, 60–90 × 128 matrix) was used. The nominal delay after the inversion pulse was 15 msec. First-pass imaging and the adjustment of the inversion time for the desired myocardial signal minimization were done in the steady state, which was reached after three to five images. Since the steady-state magnetization in this sequence is much less than the fully relaxed magnetization, the time needed to approximately null the myocardial signal was considerably reduced. The adjusted inversion time also resulted in a signal decrease in the blood pool. The effective time between inversion and acquisition of the central k-space lines that dominate image intensity and contrast was 15 msec + NTR/2, where N is the number of phase-encoding steps. The resulting effective inversion time was in the range of 192–280 msec. This inversion time provided optimal sensitivity to the polylysine-Gd-DTPA–induced T1 reduction and signal intensity increase. One image was acquired at every heartbeat, without trigger delay. N was adjusted according to the total time for one heart cycle and varied between 60 and 90, resulting in a total acquisition time of 354–531 msec. Cardiac motion appears frozen because the image is primarily determined by the central Fourier lines. The field of view was 250 × 250 mm, with an interpolated matrix of 256 × 256.
Contrast Agent
Polylysine-Gd-DTPA consists of poly-L-lysine covalently linked to moieties of Gd-DTPA and is used as a macromolecular blood pool marker (15). Because of its large size and high molecular weight, the compound is distributed almost exclusively in the intravascular space. The high molecular weight results in an increase in relaxivity (13.1 L·mmol−1·sec−1 ± 0.36 at 39°C and 20 MHz), which is about three times that of Gd-DTPA. The polylysine-Gd-DTPA used in this study had a mean molecular weight of about 52,300 d (30,000 [<15%]–75,000 [<15%] d). Only about 3% of the injected dose of polylysine-Gd-DTPA diffused into the interstitial space within the 1st minute after intravenous injection. For Gd-DTPA, this was found to be more than 50% (Mühler A, personal communication, 1994). At 1 hour after injection, the plasma level was three times higher than for Gd-DTPA. Determination of the concentration of polylysine-Gd-DTPA in the blood samples of the dogs was performed by measuring the gadolinium concentrations of the fractionated blood samples with inductively coupled plasma atomic emission spectrometry (Minitroch 3410; ARL, Lausanne, Switzerland) at 342.247 nm. The detection limit of this method was 0.1 ppm.
Statistical Analysis
Statistical differences in the peak signal of the signal intensity–versus-time curves (STCs), noise, and microsphere measurements in the corresponding perfusion studies were analyzed with one-way analysis of variance replications. A P value of less than .05 was required for statistical significance. When a significant result was found, individual comparisons were performed with the Scheffe method. The peak signal intensities of the blood pool and tissue on the STCs were determined by averaging the three values of maximal intensity. Given the time resolution, the maximal values were usually within a 3% range. Results were expressed as the mean plus or minus one standard deviation. The error bars in the microsphere myocardial blood flow (MBF) data represent the standard deviation from the mean for three myocardial samples taken from the epicardial region, midwall, and endocardial region within each ROI and counted for MBF determination. Correlation between the MBV obtained with first-pass MR imaging versus that obtained with microsphere measurements was examined with linear regression analysis. A signal-to-noise ratio (S/N) smaller than 5 served as a criterion for excluding a regional STC from the model analysis and MBV estimates. The accuracy of the MR modeling estimates for MBF was assessed from the coefficient of variation. The coefficient of variation between the MBF measurements with the first-pass MR technique and the microsphere estimates was calculated as the standard deviation of the differences between the individual estimates with the two techniques divided by the mean of the microsphere estimates.
Measurement Protocols
First-pass MR imaging studies
Each experiment was followed by at least three first-pass studies with different flow perturbations. The bolus injections for each study were separated by 20–30 minutes. In the baseline state, the intracoronary pressure (ICP) in the LAD ranged from 100 to 110 mm Hg. Subsequently, the occluder was inflated, guided by the continuously monitored ICP, to attain a severe stenosis (ICP = 45–55 mm Hg) before and after administration of adenosine. In two dogs, in addition to the severe stenosis, a milder stenosis (ICP = 50–75 mm Hg) was also attained. When employed, coronary stenosis was induced and maintained for a maximum of about 5 minutes, and the stenosis was subsequently released. The polylysine-Gd-DTPA injections were followed within 2 minutes by injection of the different types of radiolabeled microspheres for MBF measurements. For hemodynamic monitoring, data were obtained continuously throughout the experiments. Only the expected small changes occurred during stenosis and after slow adenosine infusion.
ROI and signal intensity measurements
After polylysine-Gd-DTPA injections, STCs were generated by measuring the signal intensity in circular ROIs defined in the left ventricular cavity and in 10 myocardial sections over the left ventricular wall, covering the LAD and LCx perfusion beds. The LAD perfusion bed was represented by the anterior wall and anterior papillary muscle. The LCx perfusion bed consisted of the septum, posterior wall, and posterior papillary muscle. The lateral wall was supplied by the LAD and LCx (Fig 1). After baseline and background subtraction, the signal intensities measured in the ROIs were plotted as STCs. For measurement of signal intensity (SI) changes on the images after contrast agent administration, the SI values of 50 representative ROIs were standardized to the SI of an external phantom filled with corn oil. After standardization, the percentage of increased signal enhancement was calculated by using the following equations:
| (1a) |
| (1b) |
where CA is contrast agent administration. The external standard was also used for normalizing the SI data used to generate content-versus-time curves for model analysis. The S/N of the baseline and background–subtracted STCs was expressed as the ratio of the mean peak signal intensity of the corresponding STC to the standard deviation of the baseline and background–subtracted precontrast images.
Data Analysis
For each study, the STCs were usually generated in those 10 ROIs corresponding to the autopsy ring for microsphere analysis in the territories of the LAD and the LCx (Fig 1). Images were acquired in the short-axis view of the left ventricle at an apical section position. Data were analyzed for 25 first-pass studies performed in seven dogs. In four dogs, three bolus injections were performed to monitor the passage of the polylysine-Gd-DTPA bolus. In two of the seven dogs, a total of four injections were administered, and in one dog a total of five injections were administered.
Microsphere measurements for the evaluation of MBF (milliliters per minute per gram) during the control and hyperemic states and during stenosis were available for all dogs. MBF was measured and statistically analyzed for the 10 ROIs at rest and during hyperemia and stenosis. Data from all dogs were pooled (n = 7).
Results from three bolus injections in two dogs, yielding a total of 29 STCs, were used for model analysis. For two of the bolus injections, all 10 ROIs were analyzed, and for one of the injections, only nine ROIs were analyzed, since the S/N of one curve was less than the cutoff value of 5. For each of the three bolus injections, tracer microsphere measurements of regional MBF and MBV were also obtained. The data from these 29 STCs were subsequently compared with the corresponding MBF value for statistical analysis.
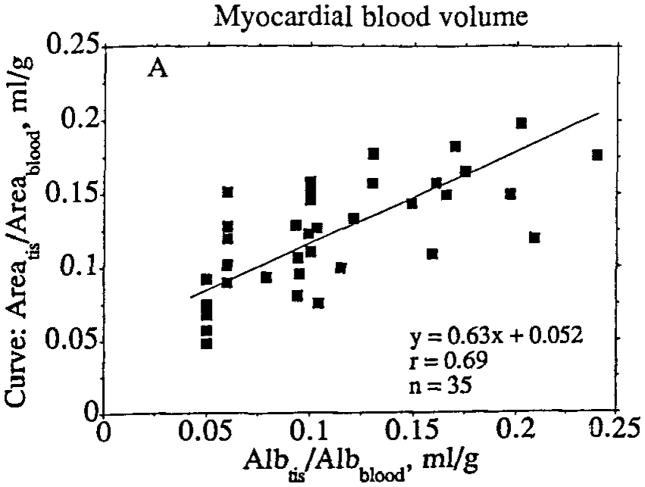
For the MBV estimates of albumin versus STC area (Fig 10) and steady state versus STC area, a total of 35 STCs from four separate bolus injections in three dogs were derived and analyzed. Comparison of the MR and microsphere data was performed in the dogs (n = 3) for which I-125–albumin data were available.
Figure 10.
Comparison of estimates of MBV obtained in myocardial tissue (tis) specimens by using tracer albumin (Alb) ratios and in corresponding MR image regions by using the ratio of the area under the first-pass content-versus-time curve for tissue to the area under the first-pass content-versus-time curve for the blood pool. The standard deviations for the slope and intercept of the regression line were 0.09 and 0.01, respectively. The regression line is based on the maximum likelihood approach, assuming equal variance in x and y.
For the analysis of signal intensity changes during the first pass of polylysine-Gd-DTPA, a total of 50 representative ROIs were chosen. Signal intensities were measured and statistically analyzed for the blood pool, septum, and posterior and anterior walls at rest and during hyperemia and stenosis. Data were pooled from dogs (n = 5) imaged with an oil phantom as a reference.
Signal Intensity Enhancement at Steady-State Levels of Contrast Agent
To determine the relation between contrast agent concentration and the resulting increase in signal intensity in the left ventricular chamber blood pool and the myocardium, simultaneous measurements of signal intensity and concentration in arterial blood under steady-state conditions were obtained in two dogs, after completion of the first-pass measurements described above. A quantity of polylysine-Gd-DTPA at least six time larger than that used in the first-pass studies was injected into the left atrium. After a delay of 10–15 minutes to allow equilibration in the blood pool, imaging in the short-axis plane was initiated with the same T1-weighted Turbo-FLASH sequence. Simultaneously, two 3-mL samples of arterial blood were withdrawn for chemical analysis of the polylysine-Gd-DTPA concentration. The measurements were repeated after additional injections to study concentrations and signal intensities at least as high as those obtained at the peak of the first-pass injections.
The steady-state measurements of blood pool signal intensity and polylysine-Gd-DTPA concentrations obtained simultaneously in two animals were fit with a least-squares optimizer by a second-order polynomial function constrained to pass through the origin. The polynomial was used as a blood pool calibration curve to transform the first-pass blood pool STCs to content-versus-time curves for model analysis. Calibration curves for individual tissue regions were obtained by scaling the blood pool polynomial by the tissue region blood volume estimated with the steady-state approach (Fig 2a). The tissue calibration curve was used to transform tissue region STCs into content-versus-time curves (Fig 2b). A total of 29 regional content-versus-time curves were generated from three bolus injections in two animals, in which microsphere measurements were performed at the same time.
Figure 2.
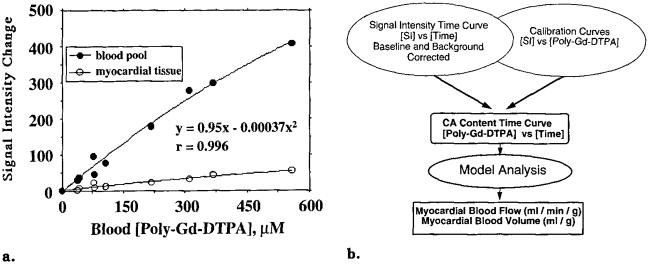
(a) Left ventricular blood pool and myocardial tissue calibration plots indicate simultaneous steady-state relative signal intensity changes versus polylysine (poly)–Gd-DTPA concentrations measured in the blood. Lines represent second-order polynomials used for transforming STCs to content-versus-time curves. Regression information pertains to the blood pool, (b) Flow chart demonstrates concept of measuring MBF and MBV by converting STCs to contrast agent (CA) content-versus-time curves for model analysis.
MR Blood Volume Estimates
Steady-state MBV estimates
In three animals, MR image regions were analyzed for regional MBV (in milliliters per gram) by dividing the steady-state polylysine-Gd-DTPA content in tissue regions (see below) by that in the left ventricular blood pool: MBV = tissue content/(blood content × ρ), assuming that ρ, the specific gravity of the tissue, was equal to 1 g/mL. For the steady-state MBV estimates, the three highest concentrations of each calibration curve were used because these gave the highest S/N and consequently the best accuracy for estimating MBV.
First-pass MBV estimates
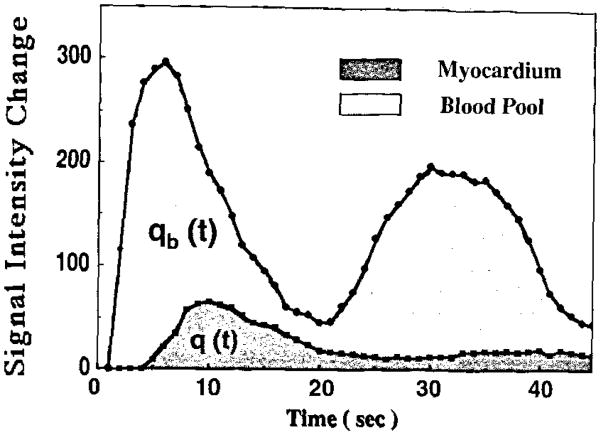
In the same three animals, separate estimates of regional MBV were obtained from first-pass measurements by dividing the area under the polylysine-Gd-DTPA content-versus-time curve in a tissue region by that in the blood pool (Fig 3): MBV = tissue area/(blood area × ρ). The entire curves were integrated to obtain the areas, without attempting to subtract the contribution due to recirculation.
Figure 3.
Estimation of MBV based on STCs after bolus injection of polylysine-Gd-DTPA. q(t) = area under the myocardial tissue STC, qb(t) = area under the blood pool STC.
MR Blood Flow Estimates
The polylysine-Gd-DTPA content-versus-time curves for blood pool and tissue regions were analyzed (Fig 2b) with a multiple-pathway, axially distributed mathematical model of blood tissue exchange (Fig 4) developed from a model described earlier (18), to estimate regional MBF and MBV. The model included multiple, parallel flow pathways, identical except for their flow, to describe the effects of regional flow heterogeneity (19). The distribution of flow in the multiple pathways of the model was based on a fractional extrapolation of the regional flow heterogeneity observed by using microspheres in the hearts of normal sheep and baboons (20). The observed input in the left ventricular blood pool, Cin(t), is dispersed and delayed during transit through large conduit vessels with transport function hLV, so that the input to the ROI is given by CLV(t) = Cin(t) * hLV, where the asterisk denotes convolution. The transport function for the individual ith microvascular flow pathway within the ROI is hMVi. With fi as the flow in an individual microvascular pathway relative to the mean flow F, and wi as the fraction of the region having relative flow fi, we have
Figure 4.
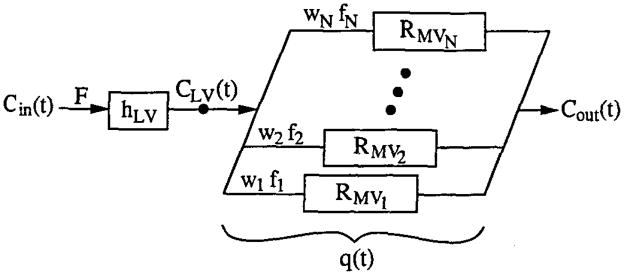
Model of myocardial intravascular transport. Cin(t) = indicator concentration time course in left ventricular blood pool, F = blood flow in myocardial tissue ROI, hLV = transport function of large vessels upstream from ROI, CLV(t) = concentration time course at microvascular inlet of ROI, f1…fN = flow in first through Nth capillary pathway, w1…wN = fraction of tissue having flow equal to f1…fN, RMV1…RMVN = residue function for the first through Nth pathway, q(t) = quantity of indicator within ROI (detected externally), and Cout(t) = concentration time course in venous outflow of ROI.
| (2a) |
| (2b) |
The quantity of indicator within the ROI, q(t), is the externally detected content-versus-time curve. Within the ith pathway, the content, qi(t), is
| (3) |
whore RMVi(t) is the residue function for the ith pathway, representing the fraction of the indicator retained in the system at time t for an impulse input to the pathway. Convolving the actual input CLV(t) with RMVi(t) and weighting by the relative flow fi and fractional mass wi gives the content qi(t). For the entire ROI, the content q(t) is obtained by summing over the paths:
| (4) |
The ROI is thereby defined as that excluding any signal originating outside the region due to imperfect spatial resolution.
The ROI may be considered to be composed of small non-exchanging arterioles and venules in series with capillaries. For an intravascular indicator, individual pathways may be modeled either with a reduced form of an axially distributed blood tissue exchange unit (21), in which permeabilities are set to zero, or alternatively with a simple low-order vascular operator (22). Both approaches give equivalent results if the vascular dispersion is set appropriately (ie, approximately 18%) (23). To fit model solutions to the MR tissue content-versus-time curves, a nonlinear least-squares optimizer routine, based on sensitivity functions (24), was used to simultaneously adjust the values of flow and volume for large vessels and microvessels.
RESULTS
MBF Determined with Microspheres
The MBF measurements obtained from the microsphere data did not display any significant regional differences in MBF between the LAD and LCx perfusion beds in the absence of coronary stenosis. The baseline MBFs were in the range of 0.9 mL/min/g ± 0.5. There was a significant increase in MBF (1.9 mL/min/g ± 0.9) in the hyperemic state (P < .0003). In the presence of stenosis, the differences between the non-occluded LCx bed and the occluded LAD bed increased with the severity of the stenosis. There was a significant MBF reduction in the control compared with the hypoperfused segments at rest (P < .005) and during hyperemia (P < .004). MBF was significantly decreased in the hyperemic control compared with the hypoperfused segments at rest (P < .0001) and during hyperemia (P < .0001). MBF in the severely hypoperfused segments was 0.03 mL/min/g ± 0.03 and was not significantly different under hyperemic conditions (0.02 mL/min/g ± 0.01).
Effect of Coronary Stenosis on First-Pass Images
After injection of 5 μmol/kg of polylysine-Gd-DTPA, the maximum percentage change in the signal intensity of the blood pool was 155% ± 7 relative to precontrast values, and the maximum change in S/N was 69 ± 41. Normal myocardium, as measured in normally perfused regions over the interventricular septum and posterior wall, was enhanced by 22% ± 7 (with an S/N of 7 ± 2) at peak signal intensity, 5–7 seconds after injection of polylysine-Gd-DTPA. Under hyperemic conditions, the signal intensity increased significantly in the left ventricular wall, by 60% ± 11 (P < .0001), with an S/N of 22 ± 9 (P < .0001), with respect to resting conditions. There was a significantly decreased signal intensity enhancement in hypoperfused segments of 7% ± 2 (P < .0007) compared with normally perfused myocardium after bolus injection of the contrast agent. S/N was significantly different in the hyperemic control segments compared with hypoperfused segments under resting conditions, by a value of 2 ± 1 (P < .0001).
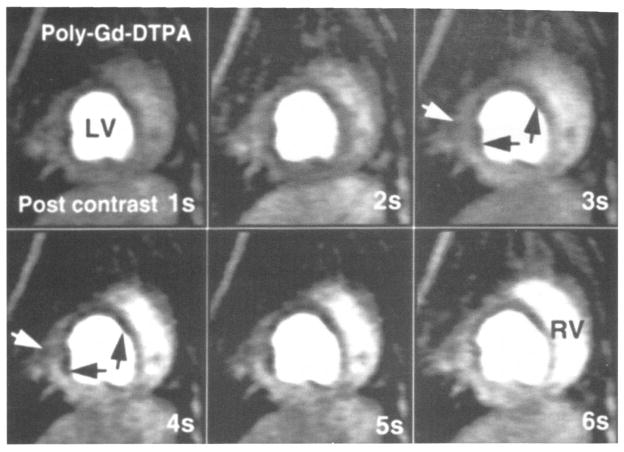
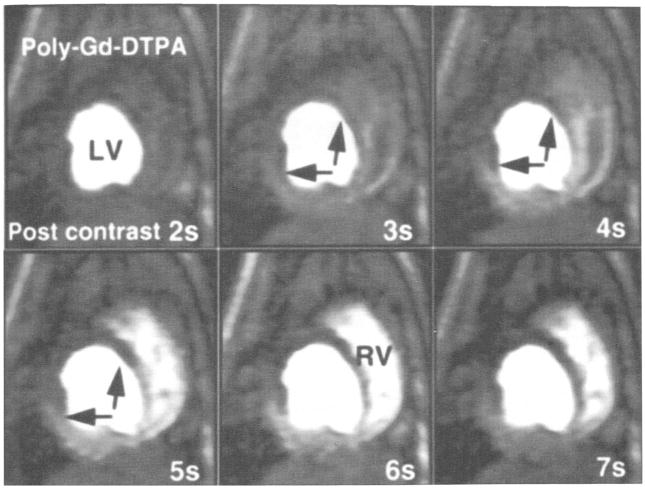
A representative example of first-pass transit of a polylysine-Gd-DTPA bolus in the presence of mild LAD stenosis (ICP = 50–75 mm Hg) under hyperemic conditions is shown in Figure 5. A clear lack of SI enhancement, especially in the endocardial layer, is documented in the anterior papillary muscle and the anterior wall, indicating the presence of hypoperfusion relative to the well-perfused septal, lateral, and posterior regions. Under conditions of mild stenosis, this effect was not evident without adenosine infusion. Under conditions of more severe stenosis (ICP = 45–55 mm Hg) (Fig 6), the hypoperfused segments are even more pronounced and display a transmural lack of signal enhancement. The perfusion differences between the hypoperfused anterior wall, intermediately perfused anterior papillary muscle, and well-perfused septal wall can be well differentiated and monitored by using the STCs, in agreement with the measured MBF, as shown in Figure 7.
Figure 5.
Representative consecutive myocardial perfusion images, after bolus injection of polylysine (poly)–Gd-DTPA. in the double-oblique short-axis view of one canine heart during mild LAD occlusion (ICP = 50 mm Hg) and hyperemia. The temporal resolution is one second per image. After injection, the heterogeneous distribution of the blood pool contrast agent across the anterior part of the septum, anterior wall, and anterior papillary muscle (black arrows) can be observed. This is especially pronounced around the endocardial layers at the anterior papillary muscle (white arrow) and anterior wall, with high signal intensity in the epicardium and low intensity in the endocardium, due to hypoperfusion. LV = left ventricle, RV = right ventricle.
Figure 6.
Consecutive myocardial perfusion images in the true short-axis view of one canine heart during severe LAD stenosis (ICP = 30–40 mm Hg) and hyperemia. The temporal resolution is one second per image. The transit of a polylysine (poly)–Gd-DTPA bolus during the first seconds after injection is shown. A transmural lack of signal intensity enhancement is seen in the anterior wall and the anterior papillary muscle (arrows), indicating the presence of hypoperfusion relative to the well-perfused septal, lateral, and posterior segments. LV = left ventricle, RV = right ventricle.
Figure 7.
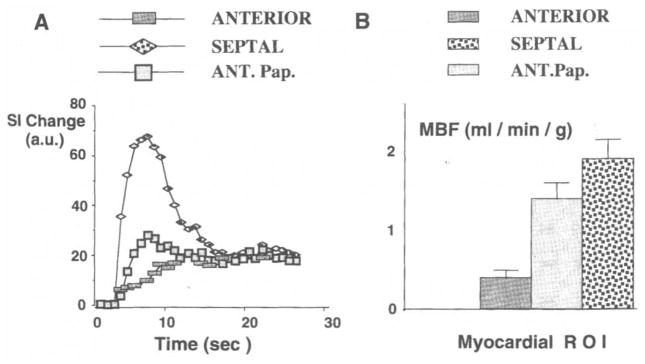
Baseline- and background-corrected STCs are shown for the heart imaged in Figure 6. The STCs due to transit of the polylysine-Gd-DTPA bolus (A) and the corresponding MBF values determined from microsphere measurements (B) are shown for three ROIs (ANTERIOR = anterior wall, SEPTAL = inferior septal wall, ANT.Pap. = anterior papillary muscle). The error bars in the MBF data represent the standard deviation from the mean for two myocardial samples taken from the epicardial and endocardial regions in each ROI.
In Situ Calibration Curves for Polylysine-Gd-DTPA
The relation between the simultaneous steady-state measurements of blood pool intensity and arterial polylysine-Gd-DTPA concentrations showed only a modest degree of nonlinearity and were well fit by a second-order polynomial constrained to pass through the origin (Fig 2a). Measurements of myocardial tissue signal intensity, obtained from the same images, were fit with the blood pool curve scaled by the tissue region blood volume. Data from a representative tissue region are included in Figure 2a. This procedure provided individual calibration curves for transforming the STCs measured during bolus injections into content-versus-time curves for model analysis. The blood pool calibration curves included intensity and concentration values that were at least as high as those at the curve peaks after bolus injections.
Content-versus-Time Curves
Background- and baseline-corrected first-pass STCs from the blood pool and a representative myocardial tissue region are shown in Figure 8a. Each of the sequential images (one image per heartbeat) provided simultaneous blood pool and tissue measurements, the first 10 of which were obtained before injection of the polylysine-Gd-DTPA bolus. The first appearance of the contrast agent in the blood pool was noted three to four heartbeats after the start of the left atrial injection. Recirculation of the agent was observed approximately 15 seconds after injection, after the blood pool curve returned nearly to baseline.
Figure 8.
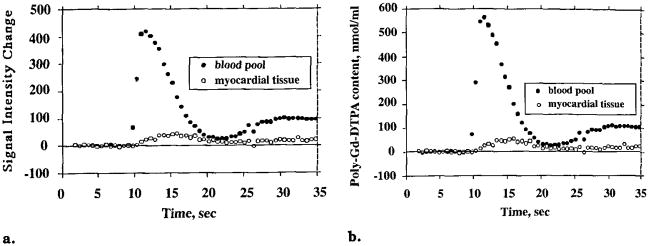
Baseline- and background-corrected STCs (a) and transformed content-versus-time curves (b) represent the same bolus injection in the identical blood pool (left ventricular cavity) and myocardial tissue regions. The tissue curve is representative of nine others measured simultaneously in the same imaging plane in different regions of the left ventricular wall.
The blood pool calibration curve in Figure 2a was used to transform the blood pool STC in Figure 8a into the content-versus-time curve shown in Figure 8b. The nonlinearity of the calibration curve caused the peak of the content-versus-time curve to be slightly stretched vertically compared with the STC.
Model Analysis of Regional MBF
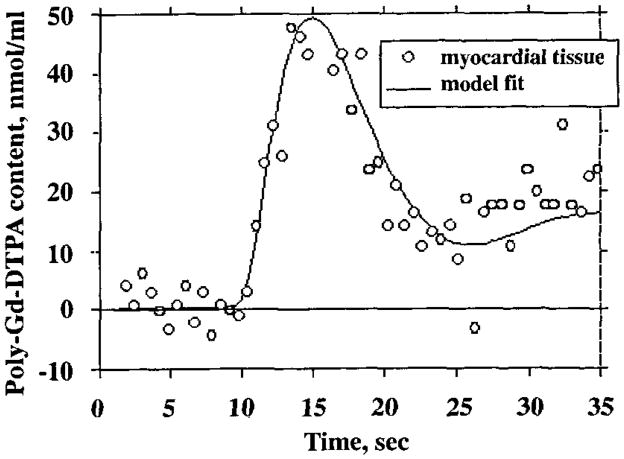
A multiple-pathway, axially distributed model of blood-tissue exchange was used to fit the tissue content-versus-time curves, with the blood pool curve as the model input function and optimizing model parameters for flow, vascular volume, and delay (see Materials and Methods). The tissue data in Figure 9 are the same as those in Figures 2 and 8, and the solid-line curve shows the optimized model fit. In this animal, the estimates of flow and volume obtained by modeling were 1.7 mL/min/g and 0.2 mL/g, respectively, and the estimates from the corresponding tissue specimen that were obtained by microsphere and tracer albumin measurements were 1.4 mL/min/g and 0.10 mL/g. Unique fits were obtained for nearly all the curves analyzed, independent of the starting values for the optimized parameters.
Figure 9.
Model fit to first-pass polylysine (poly)–Gd-DTPA content-versus-time curve. The fit was obtained with an automated optimizer routine that minimized the sum of squares of the residual errors by adjusting the flow and volumes of large vessels and microvessels. The blood pool content-versus-time curve in Figure 8b was used as the model input function.
Estimates of regional MBF obtained by modeling MR content-versus-time curves were within the normal range, averaging 1.2 mL/min/g ± 0.5 (n = 29). Flow estimates obtained at the same time with the microsphere technique averaged 1.3 mL/min/g ± 0.3 (n = 29). The accuracy of the MR modeling estimates may be assessed by determining the coefficient of variation between the MR estimates of blood flow in individual image regions and the microsphere estimates in corresponding tissue regions. The coefficient of variation, calculated by dividing the standard deviation of the differences between the individual estimates by the mean of the microsphere estimates, had a value of 0.41. Another estimate of accuracy is the ratio of MR imaging to microsphere flow estimates in the individual regions, which averaged 0.9 ± 0.4. Sources of random variability in the individual determinations included errors in the MR imaging and microsphere methods and uncertainty in the registration of MR image regions with tissue specimens analyzed for microsphere deposition.
Independent Determination of Regional MBV
Estimates of regional MBV were obtained independently of the model analysis by comparing the ratios of the areas under the contrast agent content-versus-time curves within the myocardial tissue regions versus those within the left ventricular chamber (blood pool); these estimates were in general agreement with estimates obtained from tracer albumin activity in the same tissue versus that in the blood pool. The estimates of regional MBV averaged 0.11 mL/g ± 0.05 (n = 35) with tracer albumin measurements and 0.12 mL/g ± 0.04 (n = 35) by using the ratio of the area under the first-pass curve for tissue to the area under the first-pass curve for the blood pool (Fig 10). The estimate of regional MBV was 0.11 mL/g ± 0.05 (n = 35) based on the ratio of steady-state tissue to blood-pool-indicator contents. The steady-state MR imaging estimates of MBV were obtained by taking the average value of the three steady-state estimates of the ratio of tissue signal intensity to left ventricular blood pool signal intensity by using the highest signal intensity values, since they had the highest S/N values. The standard deviation of the three individual volume estimates for each ROI was expressed as the coefficient of variation, which was equal to the standard deviation divided by the mean estimate for each ROI. The average coefficient of variation for the 19 tissue regions for which calibration curves were constructed was 0.16. Thus, the variability (standard deviation) of the three steady-state estimates of the ratio of tissue signal intensity to left ventricular blood pool signal intensity was on average 16% of the mean value. This is an acceptable degree of uncertainty, which still contributes to the overall error.
The standard deviations for the slopes and intercepts of the regression lines were 0.1 and 0.01 when comparing the steady-state MR imaging estimates with first-pass curve area estimates in identical image regions. The results indicate that neither of the MR estimates introduce significant systematic errors in the determination of MBV.
DISCUSSION
Previous studies have shown that MR imaging studies in conjunction with contrast agents such as Gd-DTPA are suitable for the detection of hypoperfused myocardium (25–27). The accumulation of Gd-DTPA in the myocardium depends not only on tissue blood volume and blood flow but also on the size of the extracellular fluid space and the permeability of the capillaries. The situation is further complicated by the fact that signal intensity and T1 are functions of the vascular, interstitial, and intracellular T1 values and relaxivities and the rate of exchange of protons between these compartments (11).
In the present study, we used an intravascular T1 contrast agent to avoid the complications presented by an extracellular contrast agent (eg, Gd-DTPA), which requires a detailed model incorporating inter-compartmental exchange kinetics and volume information for the individual compartments. During the first pass of a contrast agent bolus through a capillary network, about 50% of an extracellular agent leaks out of the vessel into the interstitial space. By comparison, this leakage is less than 3% in the case of the blood pool agent polylysine-Gd-DTPA (28).
Semiquantitative approaches (9,10) that used Gd-DTPA as an inert diffusible MR contrast agent and quantification of the tracer kinetics of Gd-DTPA in the dog heart with modified Kety equations have been reported (29–31). To apply tracer kinetic theories, the STCs have to be converted into contrast agent content-versus-time curves. Therefore, we measured the relationship between the signal intensity of the blood pool and contrast agent concentration in vivo to obtain a calibration curve. On the basis of these calibration curves, STCs were converted to content-versus-time curves, which subsequently were analyzed by application of a multiple-pathway structured perfusion model to obtain quantitative MBF data (12).
Quantifying regional tissue blood flow with model-independent analysis of first-pass tracer kinetics has limitations. The central-volume principle describes a simple relation between the volume distribution of a tracer, flow, and the outflow mean transit time (volume divided by flow). However, only the ratio of volume to flow can be estimated with this method. The present data and previous investigations (32) demonstrate a wide regional heterogeneity in MBV. Moreover, the central-volume principle cannot be applied to tissue content-versus-time curves (residue functions), since there is no direct relation between tissue mean residence times, which could be estimated from the present MR data, and outflow mean transit times (14). Also, tracer recirculation poses important problems for estimating mean transit times. The present analysis with a physically realistic model of vascular architecture and convection largely overcomes the above limitations. Because flow and vascular volume have different effects on tracer kinetics, it is possible to independently estimate both parameters from the residue function. Dispersion of the input function poses no fundamental problems, because the measured blood pool signal (after transformation to content [milliliters per gram]) is used as the model input function. Similarly, it is not a requirement that none of the tracer passing through a tissue region leave the field of view of the detector before all of it has entered. Nor is it a requirement that the curves be free of recirculation, because recirculation is simply a delayed component to the model input function.
Sources of Error
The estimates of regional MBV obtained by using tracer albumin are influenced by the redistribution of tracer-bearing blood during the moments between the interruption of normal blood flow and freezing of the tissue. During this interval, it is expected that arterial blood volume decreases and venous volume increases, as arterial and venous blood pressures tend to equalize. Blood volume estimates obtained by using the areas under the STCs are expected to contain errors due to inclusion of the initial phase of recirculation.
If polylysine-Gd-DTPA relaxivity were different between the left ventricular chamber blood pool and the capillary microvasculature, systematic errors in the MR estimates of both regional volume and flow would occur. Evidence that the relaxivities are similar is the finding of little systematic difference between the albumin and MR estimates of blood volume and the microsphere and MR modeling estimates of flow. In principle, all water protons inside the voxel can be relaxed by gadolinium agents, regardless of their original compartment. The water is exchanged about eight to 27 times per second between the intracellular and interstitial spaces, and about seven times per second between the interstitial and intravascular spaces. During a single capillary passage, the water is exchanged about 40 times between the blood and the interstitial space (33). As a result, water diffusion throughout the voxel is much more rapid than T1. Therefore, the relaxation effect of the contrast agent will extend beyond the actually occupied volume. Moreover, in the limit of fast water exchange relative to T1 between the different compartments, the effect of the intravascular agent depends solely on the concentration within the voxel and not on geometric details of compartmentalization, as is the case for T2* susceptibility agents. This hypothesis is supported by recent studies demonstrating that the relaxivity for a large range of polylysine-Gd-DTPA concentrations in tissue and the blood pool is constant over time (34). Therefore, the ratios of the signal intensities and corresponding contrast agent concentrations in tissue and the blood pool of the left ventricular chamber reflect the fractional distribution of polylysine-Gd-DTPA between tissue and the blood pool (35), which is the fractional blood volume for this intravascular contrast agent.
Uncertainty in the registration of myocardial tissue specimens and MR image regions would cause discrepancies between MR and albumin estimates of blood volume and between MR and microsphere estimates of regional flow. With use of the automated optimizer, model solutions converged toward unique fits of the content-versus-time curves in most cases, regardless of the starting values of the parameters. Although the effect of different starting values on the final parameter estimates was not investigated in a systematic manner, it was observed that for certain curves, several solutions yielded equally good fits.
An additional source of error is that the description of vascular architecture in the present model is incomplete. Detection of regions of hypoperfusion with the first-pass technique is sometimes hampered by image artifacts in the myocardium. One problem is the trigger-dependent image acquisition. Severe arrhythmia causes image artifacts in the inversion-recovery TurboFLASH sequence. The total acquisition time for a single image represents a large portion of one heart cycle. Another source of artifacts may be signal modulation due to the combination of a TurboFLASH sequence and the signal variation resulting from the passage of the bolus (36). As the bolus enters the blood pool in the left ventricle, one may see dark bands and rings parallel to the phase-encoding direction. The main disadvantage of intravascular agents is that tissue signal is low because of the low tissue blood content. Therefore, first-pass kinetics are more affected by a given level of noise than would be the case if a highly permeable agent that was able to freely exchange in the total tissue water space was used.
CONCLUSIONS
Despite the aforementioned sources of potential error, the present study demonstrates that the intravascular relaxation agent polylysine-Gd-DTPA can be used to identify and quantify regions of myocardial hypoperfusion with T1-weighted first-pass imaging techniques. A more complete analysis of first-pass kinetics of polylysine-Gd-DTPA provides estimates of regional tissue blood content. Furthermore, these results represent a novel combination of T1-weighted first-pass MR imaging with use of an intravascular relaxation agent and a spatially distributed perfusion model, to obtain measurements of regional myocardial blood flow and volume. Although there does not appear to be a systematic error in the flow and volume estimates, there is a random error. This random error must be reduced before the technique can be routinely applied for quantitative flow estimates. Refinement of MR techniques and contrast agents in the near future is expected to reduce this random error (37). Further confirmational studies in which a broader flow range is investigated than in the present study are needed.
Acknowledgments
The authors thank Deb Rollings for editorial assistance and Walt Gutzmer for preparing the photographs.
Supported in part by National institutes of Health grants HL33600, HL 50740, HL32627, and RR01243, Schering AG, Berlin, Germany, and Siemens Medical Engineering Group, Iselin, NJ.
Abbreviations
- DTPA
diethylenetriaminepentaacetic acid
- FLASH
fast low-angle shot
- ICP
intracoronary pressure
- LAD
left anterior descending artery
- LCx
left circumflex artery
- MBF
myocardial blood flow
- MBV
myocardial blood volume
- ROI
region of interest
- S/N
signal-to-noise ratio
- STC
signal intensity–versus-time curve
Footnotes
From the 1993 SMRI annual meeting.
References
- 1.Schmiedl U, Moseley ME, Sievers R, et al. Magnetic resonance Imaging of myocardial infarction using albumin-(Gd-DTPA), a macromolecular blood-volume contrast agent in a rat model. Invest Radiol. 1987;22:713–721. doi: 10.1097/00004424-198709000-00004. [DOI] [PubMed] [Google Scholar]
- 2.Saeed M, Wendland MF, Tomei E, et al. Demarcation of myocardial ischemia: magnetic susceptibility effect of contrast medium in MR imaging. Radiology. 1989;173:763–767. doi: 10.1148/radiology.173.3.2813783. [DOI] [PubMed] [Google Scholar]
- 3.Higgins CB, Saeed M, Wendland M, et al. Contrast media for cardiothoracic MR imaging. JMRI. 1993;3:265–276. doi: 10.1002/jmri.1880030138. [DOI] [PubMed] [Google Scholar]
- 4.Schmiedl U, Sievers RE, Brasch RC. Acute myocardial ischemia and reperfusion: MR imaging with albumin-Gd-DTPA. Radiology. 1989;170:351–356. doi: 10.1148/radiology.170.2.2911657. [DOI] [PubMed] [Google Scholar]
- 5.Saeed M, Wendland MF, Takehara Y, Masui T, Higgins CB. Reperfusion and irreversible myocardial injury: identification with a nonionic MR imaging contrast medium. Radiology. 1992;182:675–683. doi: 10.1148/radiology.182.3.1535880. [DOI] [PubMed] [Google Scholar]
- 6.Manning WJ, Atkinson DJ, Grossman W, Paulin S, Edelman RR. First-pass nuclear magnetic resonance imaging studies using gadolinium-DTPA in patients with coronary artery disease. J Am Coll Cardiol. 1991;18:959–965. doi: 10.1016/0735-1097(91)90754-w. [DOI] [PubMed] [Google Scholar]
- 7.Wilke N, Engels A, Weikl A, et al. Dynamic perfusion studies by ultrafast MR imaging: initial clinical results from cardiology. Electromedica. 1990;58:102–108. [Google Scholar]
- 8.Wilke N, Engels A, Machnig T, et al. Myocardial perfusion study using the “Turbo FLASH” sequence and Gd-DTPA (abstr) Radiology. 1990;177:101. [Google Scholar]
- 9.van Rossum AC, Keijer T, Hofman M, et al. First-pass MRI of myocardial perfusion at rest and after pharmacologically induced vasodilatation in patients with coronary artery disease (abstr). Proceedings of the Society of Magnetic Resonance in Medicine; 1993; Berkeley, Calif: Society of Magnetic Resonance in Medicine; 1993. p. 543. [Google Scholar]
- 10.Wilke N, Simm C, Zhang J, et al. Contrast-enhanced first pass myocardial perfusion imaging: correlation between myocardial blood flow in dogs at rest and during hyperemia. Magn Reson Med. 1993;29:485–497. doi: 10.1002/mrm.1910290410. [DOI] [PubMed] [Google Scholar]
- 11.Purstein D, Taratutra E, Manning W. Factors in myocardial “perfusion” imaging with ultrafast MRI and Gd-DTPA administration. Magn Reson Med. 1991;20:299–305. doi: 10.1002/mrm.1910200212. [DOI] [PubMed] [Google Scholar]
- 12.Bassingthwaighte JB, Raymond GR, Chan JIS. Principles of tracer kinetics. In: Zaret BL, Beller GA, editors. Nuclear cardiology: state of the art and future directions. St Louis, Mo: Mosby–Year Book; 1993. pp. 3–23. [Google Scholar]
- 13.Belliveau JW, Kennedy DN, McKinstry RC, et al. Book of abstracts: Society of Magnetic Resonance in Medicine 1991. Berkeley, Calif: Society of Magnetic Resonance in Medicine; 1991. Functional mapping of the human visual cortex by nuclear magnetic resonance imaging (abstr) p. 115. [Google Scholar]
- 14.Weisskoff RM, Chesler D, Boxerman JL, Rosen B. Pitfalls in MR measurement of tissue blood flow with intravascular tracers: which mean transit time? Magn Reson Med. 1993;29:553–558. doi: 10.1002/mrm.1910290420. [DOI] [PubMed] [Google Scholar]
- 15.Schuhmann-Giampieri G, Schmitt-Willich H, Frenzel T, Press WR, Weinmann H-J. In vivo and in vitro evaluation of Gd-DTPA-polylysine as a macromolecular contrast agent for magnetic resonance imaging. Invest Radiol. 1991;26:969–974. doi: 10.1097/00004424-199111000-00008. [DOI] [PubMed] [Google Scholar]
- 16.Gwirtz P. Construction and evaluation of a coronary catheter for chronic implantation in dogs. J Appl Physiol. 1986;60:720–726. doi: 10.1152/jappl.1986.60.2.720. [DOI] [PubMed] [Google Scholar]
- 17.Haase A. Snapshot FLASH MRI: application to T1, T2, and chemical shift imaging. Magn Reson Med. 1990;13:77–89. doi: 10.1002/mrm.1910130109. [DOI] [PubMed] [Google Scholar]
- 18.Kuikka J, Levin M, Bassingthwaighte JB. Multiple tracer dilution estimates of D- and 2-deoxy-D-glucose uptake by the heart. Am J Physiol. 1986;250 doi: 10.1152/ajpheart.1986.250.1.H29. [DOI] [PMC free article] [PubMed] [Google Scholar]; Heart Circ Physiol . 19:H29–H42. [Google Scholar]
- 19.King RB, Bassingthwaighte JB, Hales JRS, Rowell LB. Stability of heterogeneity of myocardial blood flow in normal awake baboons. Circ Res. 1985;57:285–295. doi: 10.1161/01.res.57.2.285. [DOI] [PMC free article] [PubMed] [Google Scholar]
- 20.Bassingthwaighte JB, van Beek JHGM, King RB. Fractal branchings: the basis of myocardial flow heterogeneities? Mathematical approaches to cardiac arrhythmias. In: Jalife J, editor. Ann N Y Acad Sci. Vol. 591. 1990. pp. 392–401. [DOI] [PMC free article] [PubMed] [Google Scholar]
- 21.Bassingthwaighte JB, Chan IS, Wang CY. Computationally efficient algorithms for capillary convection-permeation-diffusion models for blood-tissue exchange. Ann Biomed Eng. 1992;20:687–725. doi: 10.1007/BF02368613. [DOI] [PubMed] [Google Scholar]
- 22.King RB, Deussen A, Raymond GR, Bassingthwaighte JB. A vascular transport operator. Am J Physiol (Heart Circ Physiol 34) 1993;265:H2196–H2208. doi: 10.1152/ajpheart.1993.265.6.H2196. [DOI] [PMC free article] [PubMed] [Google Scholar]
- 23.Bassingthwaighte JB. Plasma indicator dispersion in arteries of the human leg. Circ Res. 1966;19:332–346. doi: 10.1161/01.res.19.2.332. [DOI] [PMC free article] [PubMed] [Google Scholar]
- 24.Chan IS, Goldstein AA, Bassingthwaighte JB. SENSOP: a derivative-free solver for non-linear least squares with sensitivity scaling. Ann Biomed Eng. 1993;21:621–631. doi: 10.1007/BF02368642. [DOI] [PMC free article] [PubMed] [Google Scholar]
- 25.Taeymans Y, Carlier PG, Gilles R, Philippart C. MRI of acute myocardial infarction in dogs using dynamic contrast enhanced ultrafast GE and tagging sequences (abstr). Proceedings of the Society of Magnetic Resonance in Medicine; 1993; Berkeley, Calif: Society of Magnetic Resonance in Medicine; 1993. p. 539. [Google Scholar]
- 26.Wilke N, Xu Y, Zhang Y, et al. MR first pass imaging in the assessment of myocardial perfusion using a blood pool contrast agent (abstr). Proceedings of the Society of Magnetic Resonance in Medicine; 1993; Berkeley, Calif: Society of Magnetic Resonance in Medicine; 1993. p. 537. [Google Scholar]
- 27.Wilke N, Xu Y, Merkle H, et al. Magnetic resonance first pass imaging in the assessment of myocardial perfusion (abstr); Circulation (suppl) Abstracts from the 66th scientific sessions; Atlanta, Ga: American Heart Association; 1993. abstract 1469. [Google Scholar]
- 28.Van Hecke P, Marchal G, Bosmans H, et al. NMR imaging study of the pharmacodynamics of polylysine-gadolinium-DTPA in the rabbit and the rat. Magn Reson Imaging. 1991;9:313–321. doi: 10.1016/0730-725x(91)90417-k. [DOI] [PubMed] [Google Scholar]
- 29.Tong CY, Prato FS, Wisenberg G, et al. Techniques for the measurement of the local myocardial extraction efficiency for inert diffusible contrast agents such as gado-pentetate dimeglumine. Magn Reson Med. 1993;30:332–336. doi: 10.1002/mrm.1910300309. [DOI] [PubMed] [Google Scholar]
- 30.Tong CY, Prato FS, Wisenberg G, et al. Measurement of the extraction efficiency and distribution volume for Gd-DTPA in normal and diseased canine myocardium. Magn Reson Med. 1993;30:337–346. doi: 10.1002/mrm.1910300310. [DOI] [PubMed] [Google Scholar]
- 31.Watson MT, Lorenz CH, Delbeke D, et al. Quantification of regional myocardial perfusion: a comparison of contrast-enhanced magnetic resonance imaging and positron emission tomography (abstr). Proceedings of the Society of Magnetic Resonance in Medicine; 1993; Berkeley, Calif: Society of Magnetic Resonance in Medicine; 1993. p. 636. [Google Scholar]
- 32.Gonzalez F, Bassingthwaighte JB. Heterogeneities in regional volumes of distribution and flows in the rabbit heart. Am J Physiol (Heart Circ Physiol 127) 1990;258:H1012–H1024. doi: 10.1152/ajpheart.1990.258.4.H1012. [DOI] [PMC free article] [PubMed] [Google Scholar]
- 33.Donahue KM, Burstein D. Proton exchange rates in myocardial tissue with Gd-DTPA administration (abstr). Proceedings of the Society of Magnetic Resonance in Medicine; 1993; Berkeley, Calif: Society of Magnetic Resonance in Medicine; 1993. p. 623. [Google Scholar]
- 34.Stodal H, Haupt I, Syha J, Haase A. Regional blood volume determination by Gd-DTPA-polylyslne using quantitative T1 snapshot FLASH MRI-movies (abstr). Proceedings of the Society of Magnetic Resonance in Medicine; 1993; Berkeley, Calif: Society of Magnetic Resonance in Medicine; 1993. p. 239. [Google Scholar]
- 35.Kuwatsuru R, Shames DM, Mühler A, et al. Quantification of tissue plasma volume in the rat by contrast-enhanced magnetic resonance imaging. Magn Reson Med. 1993;30:76–81. doi: 10.1002/mrm.1910300112. [DOI] [PubMed] [Google Scholar]
- 36.Jerosch-Herold M, Stillman AE, Wilke N. Book of abstracts: scientific conference on the application of magnetic resonance to the cardiovascular system. Atlanta, Ga: American Heart Association; 1993. Artifact formation during myocardial first pass of contrast agent (abstr) abstract P26. [Google Scholar]
- 37.Wilke N, Jerosch-Herold M, Stillman AE, et al. Concepts of myocardial perfusion imaging in magnetic resonance imaging. Magn Reson Q. 1994;10:249–286. [PubMed] [Google Scholar]


